

Effect of frequency and rhythmicity on flicker light-induced hallucinatory phenomena
- PMID: 37040392
- PMCID: PMC10089352
- DOI: 10.1371/journal.pone.0284271
Effect of frequency and rhythmicity on flicker light-induced hallucinatory phenomena
Abstract
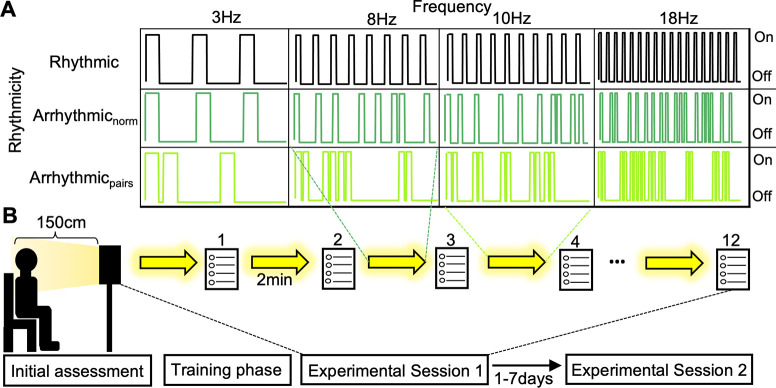
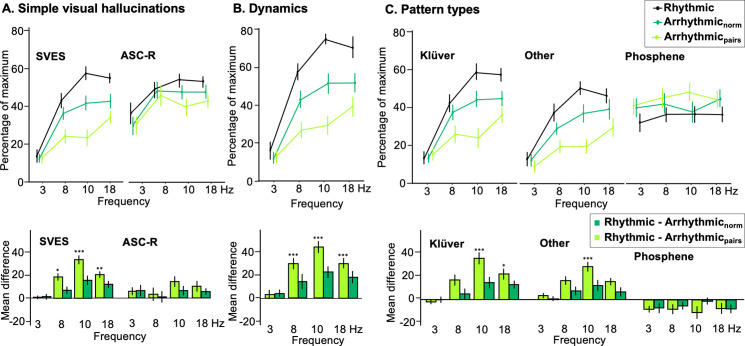
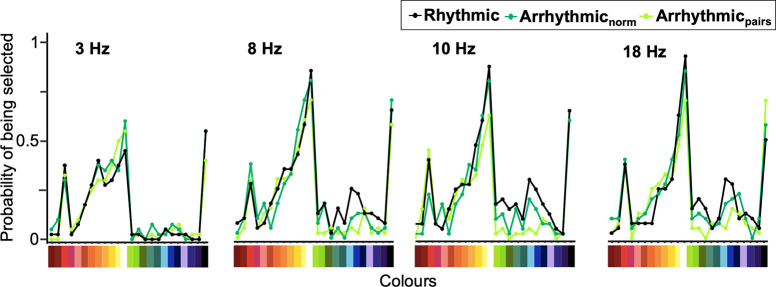
Flicker light stimulation (FLS) uses stroboscopic light on closed eyes to induce transient visual hallucinatory phenomena, such as the perception of geometric patterns, motion, and colours. It remains an open question where the neural correlates of these hallucinatory experiences emerge along the visual pathway. To allow future testing of suggested underlying mechanisms (e.g., changes in functional connectivity, neural entrainment), we sought to systematically characterise the effects of frequency (3 Hz, 8 Hz, 10 Hz and 18 Hz) and rhythmicity (rhythmic and arrhythmic conditions) on flicker-induced subjective experiences. Using a novel questionnaire, we found that flicker frequency and rhythmicity significantly influenced the degree to which participants experienced simple visual hallucinations, particularly the perception of Klüver forms and dynamics (e.g., motion). Participants reported their experience of geometric patterns and dynamics was at highest intensity during 10 Hz rhythmic stimulation. Further, we found that frequency-matched arrhythmic FLS strongly reduced these subjective effects compared to equivalent rhythmic stimulation. Together, these results provide evidence that flicker rhythmicity critically contributes to the effects of FLS beyond the effects of frequency alone, indicating that neural entrainment may drive the induced phenomenal experience.
Copyright: © 2023 Amaya et al. This is an open access article distributed under the terms of the Creative Commons Attribution License, which permits unrestricted use, distribution, and reproduction in any medium, provided the original author and source are credited.
Conflict of interest statement
I have read the journal’s policy and the authors of this manuscript have the following competing interests: TTS: This research was supported by an unrestricted donation from Lumenate Growth ltd to Freie Universität Berlin allocated to TTS. This does not alter our adherence to PLOS ONE policies on sharing data and materials.
Figures
References
-
- Schwartzman DJ, Schartner M, Ador BB, Simonelli F, Chang AY-C, Seth AK. Increased spontaneous EEG signal diversity during stroboscopically-induced altered states of consciousness. Biorxiv. 2019; 511766. doi: 10.1101/511766 - DOI
-
- Cowan JD. Visual Hallucinations and Migraine Aura. Encyclopedia of Computational Neuroscience. 2013; 1–11. doi: 10.1007/978-1-4614-7320-6_515–1 - DOI
Publication types
MeSH terms
LinkOut - more resources
Full Text Sources
