

Mass Spectrometry Imaging-Based Single-Cell Lipidomics Profiles Metabolic Signatures of Heart Failure
- PMID: 37040505
- PMCID: PMC10076023
- DOI: 10.34133/research.0019
Mass Spectrometry Imaging-Based Single-Cell Lipidomics Profiles Metabolic Signatures of Heart Failure
Abstract
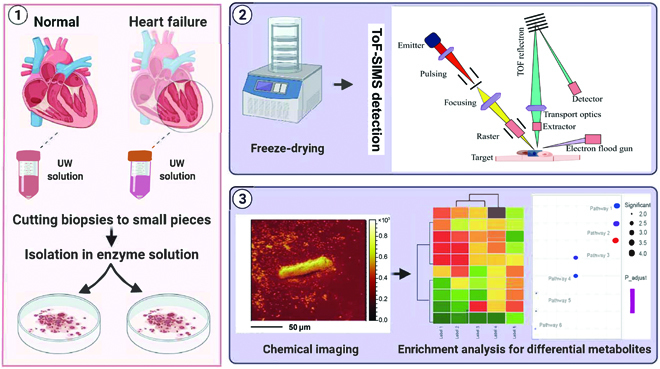
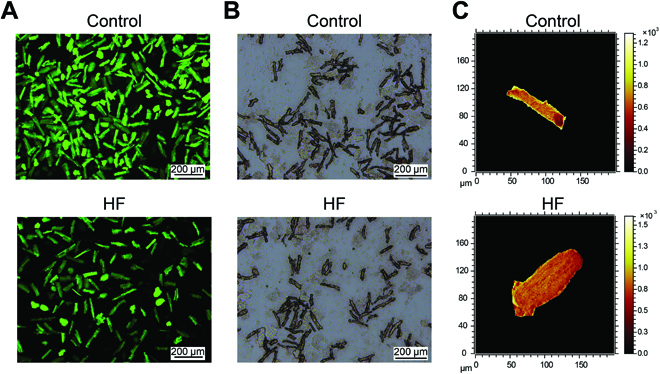
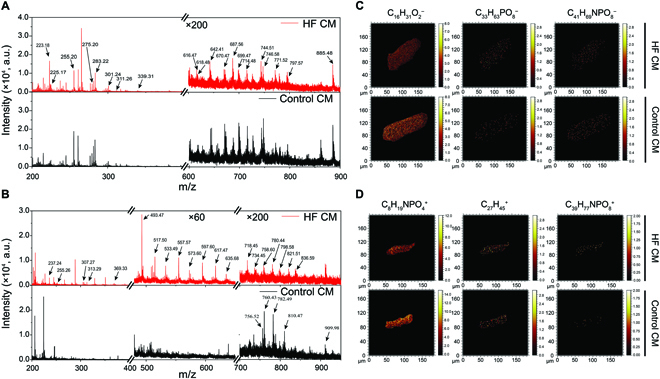
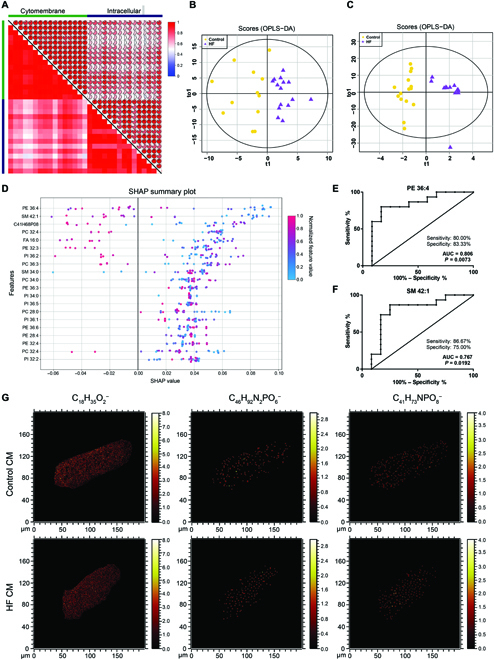
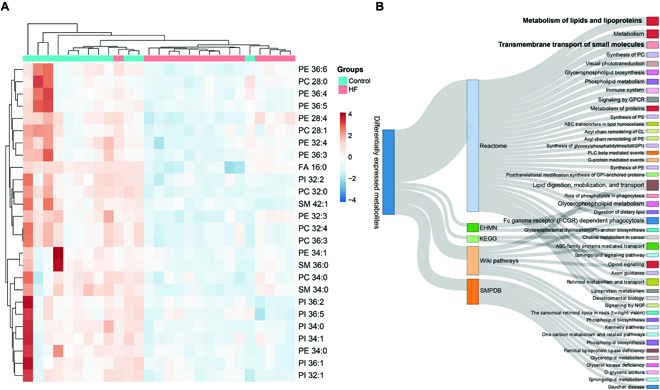
Heart failure (HF), leading as one of the main causes of mortality, has become a serious public health issue with high prevalence around the world. Single cardiomyocyte (CM) metabolomics promises to revolutionize the understanding of HF pathogenesis since the metabolic remodeling in the human hearts plays a vital role in the disease progression. Unfortunately, current metabolic analysis is often limited by the dynamic features of metabolites and the critical needs for high-quality isolated CMs. Here, high-quality CMs were directly isolated from transgenic HF mice biopsies and further employed in the cellular metabolic analysis. The lipids landscape in individual CMs was profiled with a delayed extraction mode in time-of-flight secondary ion mass spectrometry. Specific metabolic signatures were identified to distinguish HF CMs from the control subjects, presenting as possible single-cell biomarkers. The spatial distributions of these signatures were imaged in single cells, and those were further found to be strongly associated with lipoprotein metabolism, transmembrane transport, and signal transduction. Taken together, we systematically studied the lipid metabolism of single CMs with a mass spectrometry imaging method, which directly benefited the identification of HF-associated signatures and a deeper understanding of HF-related metabolic pathways.
Copyright © 2023 Jie Ren et al.
Figures
Similar articles
-
Metabolic profiles identify circulating biomarkers associated with heart failure in young single ventricle patients.Metabolomics. 2021 Oct 3;17(10):95. doi: 10.1007/s11306-021-01846-8. Metabolomics. 2021. PMID: 34601638 Free PMC article.
-
Circulating metabolic signatures of heart failure in precision cardiology.Precis Clin Med. 2023 Mar 14;6(1):pbad005. doi: 10.1093/pcmedi/pbad005. eCollection 2023 Mar. Precis Clin Med. 2023. PMID: 37020642 Free PMC article. Review.
-
Lipoxygenase drives lipidomic and metabolic reprogramming in ischemic heart failure.Metabolism. 2019 Jul;96:22-32. doi: 10.1016/j.metabol.2019.04.011. Epub 2019 Apr 15. Metabolism. 2019. PMID: 30999004
-
Temporal lipid profiling in the progression from acute to chronic heart failure in mice and ischemic human hearts.Atherosclerosis. 2022 Dec;363:30-41. doi: 10.1016/j.atherosclerosis.2022.11.005. Epub 2022 Nov 10. Atherosclerosis. 2022. PMID: 36455306
-
Integration of lipidomics and metabolomics for in-depth understanding of cellular mechanism and disease progression.J Genet Genomics. 2020 Feb 20;47(2):69-83. doi: 10.1016/j.jgg.2019.11.009. Epub 2019 Dec 18. J Genet Genomics. 2020. PMID: 32178981 Review.
Cited by
-
Exercise-Induced miR-210 Promotes Cardiomyocyte Proliferation and Survival and Mediates Exercise-Induced Cardiac Protection against Ischemia/Reperfusion Injury.Research (Wash D C). 2024 Feb 26;7:0327. doi: 10.34133/research.0327. eCollection 2024. Research (Wash D C). 2024. PMID: 38410280 Free PMC article.
-
Cell-cell interactions in the heart: advanced cardiac models and omics technologies.Stem Cell Res Ther. 2024 Oct 12;15(1):362. doi: 10.1186/s13287-024-03982-z. Stem Cell Res Ther. 2024. PMID: 39396018 Free PMC article. Review.
-
Application of Spatial Omics in the Cardiovascular System.Research (Wash D C). 2025 Mar 8;8:0628. doi: 10.34133/research.0628. eCollection 2025. Research (Wash D C). 2025. PMID: 40062231 Free PMC article. Review.
-
Mass spectrometry-based metabolomic as a powerful tool to unravel the component and mechanism in TCM.Chin Med. 2025 May 12;20(1):62. doi: 10.1186/s13020-025-01112-2. Chin Med. 2025. PMID: 40355943 Free PMC article. Review.
-
Trends in Mass Spectrometry-Based Single-Cell Proteomics.Anal Chem. 2025 Mar 25;97(11):5893-5907. doi: 10.1021/acs.analchem.5c00661. Epub 2025 Mar 16. Anal Chem. 2025. PMID: 40091206 Review. No abstract available.
References
-
- Xu S, Liu M, Bai Y, Liu H. Multi-dimensional organic mass cytometry: Simultaneous analysis of proteins and metabolites on single cells. Angew Chem Int Ed Eng. 2021;60(4):1806–1812. - PubMed
-
- Wishart DS. Metabolomics for investigating physiological and pathophysiological processes. Physiol Rev. 2019;99(4):1819–1875. - PubMed
LinkOut - more resources
Full Text Sources
Research Materials
Miscellaneous
