. 2023 Sep 1;35(9):3363-3382.
doi: 10.1093/plcell/koad101.

Cauliflower mosaic virus protein P6 is a multivalent node for RNA granule proteins and interferes with stress granule responses during plant infection

Affiliations

Cauliflower mosaic virus protein P6 is a multivalent node for RNA granule proteins and interferes with stress granule responses during plant infection

Gesa Hoffmann et al. Plant Cell. .

Abstract

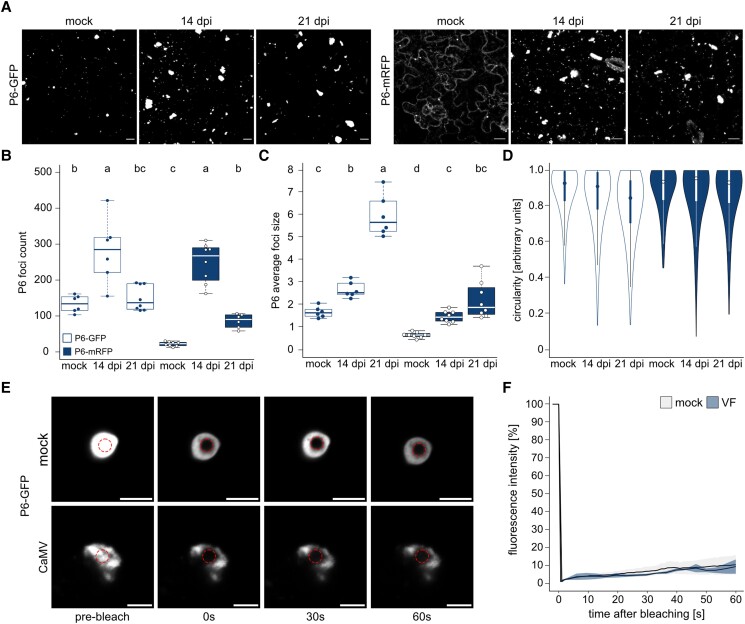
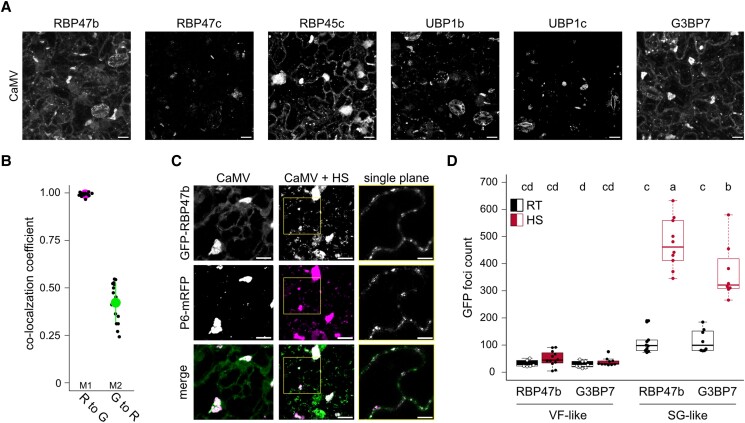
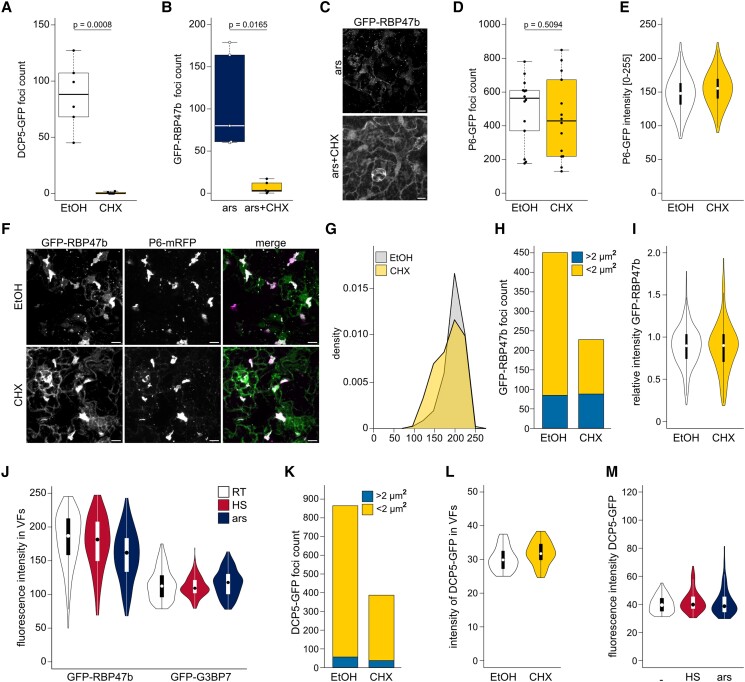
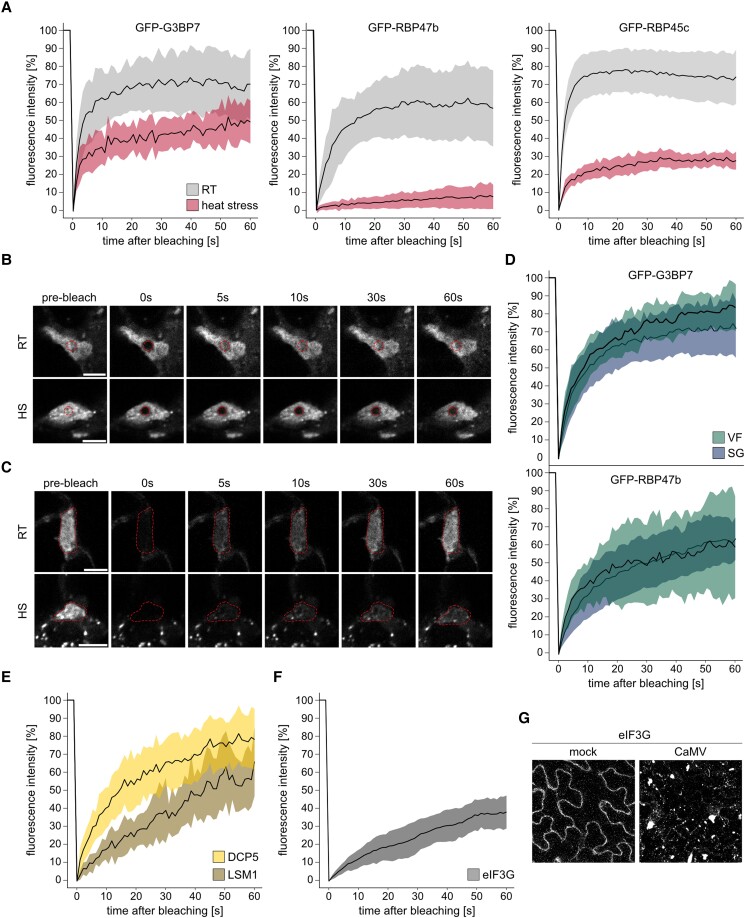
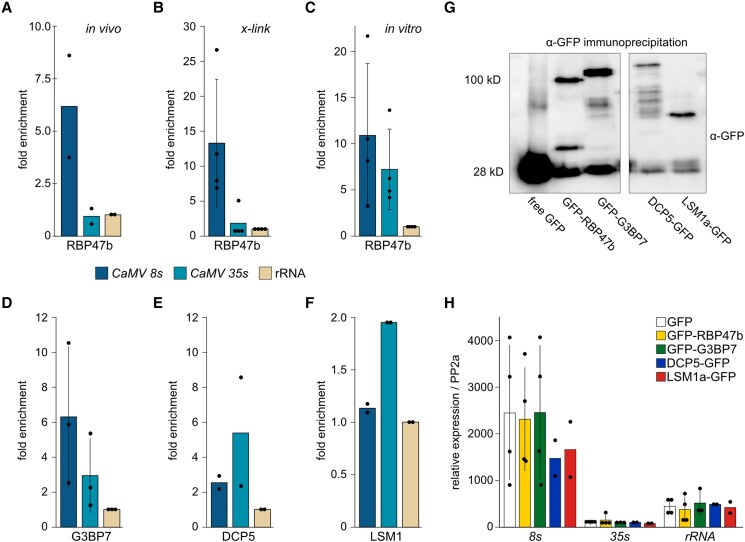
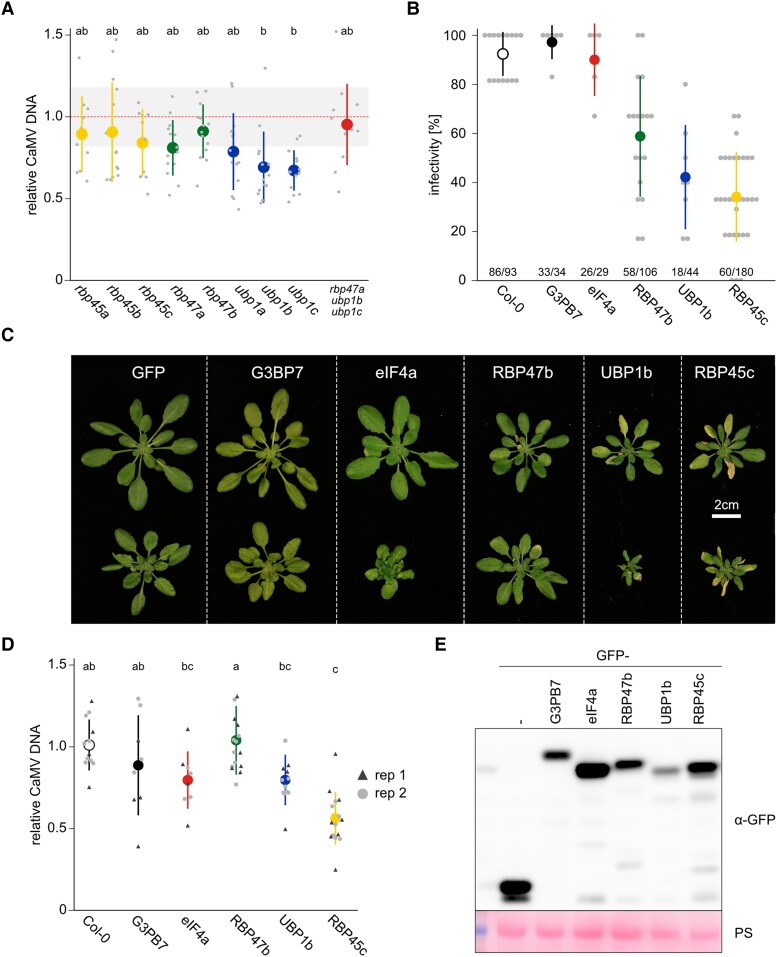
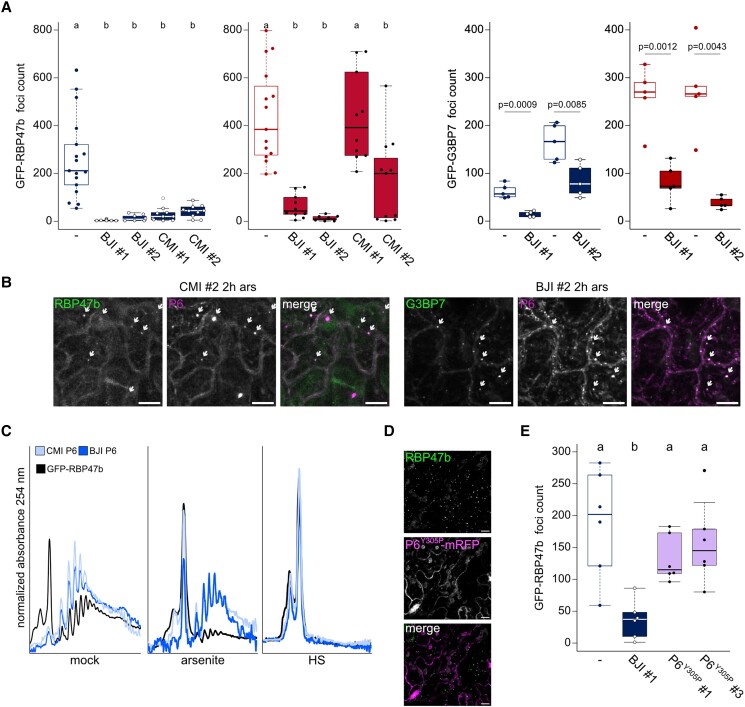
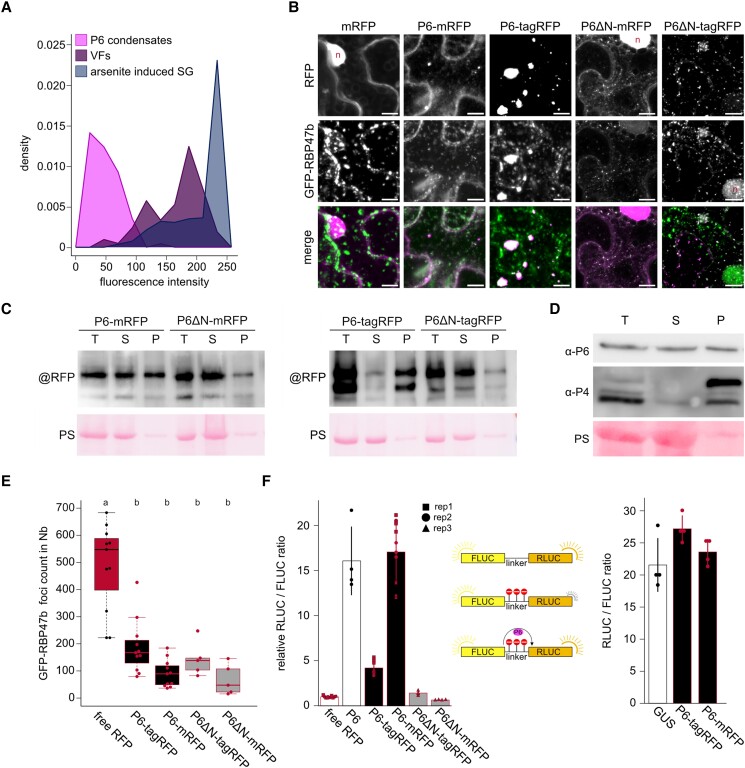
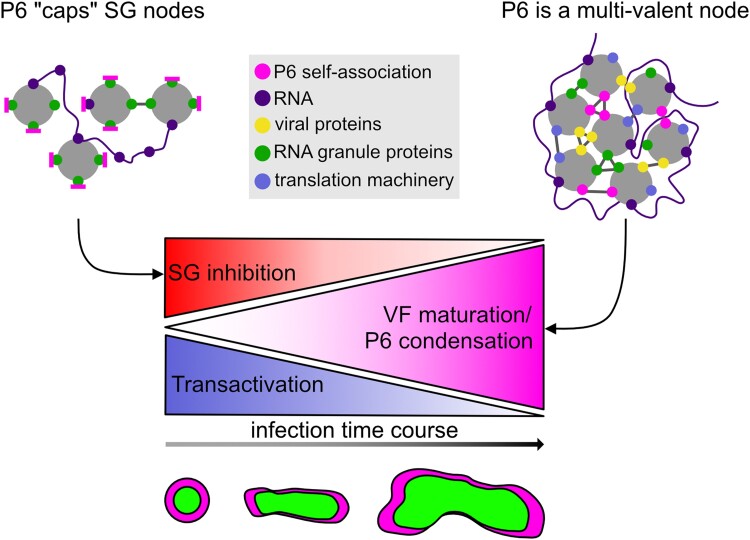
Biomolecular condensation is a multipurpose cellular process that viruses use ubiquitously during their multiplication. Cauliflower mosaic virus replication complexes are condensates that differ from those of most viruses, as they are nonmembranous assemblies that consist of RNA and protein, mainly the viral protein P6. Although these viral factories (VFs) were described half a century ago, with many observations that followed since, functional details of the condensation process and the properties and relevance of VFs have remained enigmatic. Here, we studied these issues in Arabidopsis thaliana and Nicotiana benthamiana. We observed a large dynamic mobility range of host proteins within VFs, while the viral matrix protein P6 is immobile, as it represents the central node of these condensates. We identified the stress granule (SG) nucleating factors G3BP7 and UBP1 family members as components of VFs. Similarly, as SG components localize to VFs during infection, ectopic P6 localizes to SGs and reduces their assembly after stress. Intriguingly, it appears that soluble rather than condensed P6 suppresses SG formation and mediates other essential P6 functions, suggesting that the increased condensation over the infection time-course may accompany a progressive shift in selected P6 functions. Together, this study highlights VFs as dynamic condensates and P6 as a complex modulator of SG responses.


Conflict of interest statement

Conflict of interest statement. None declared.

Figures

Figure 1.
Figure 1.
P6 establishes an immobile matrix in VFs. A) Maturation of P6 foci during an infection time-course (noninfected, 14 and 21 dpi) with CaMV was followed in Arabidopsis P6-GFP and P6-mRFP marker lines by microscopy. Representative images are confocal Z-stack projections (scale bars = 10 µm). B) The number of P6-GFP and -mRFP foci in 100 × 100 µm2 at timepoints corresponding to A). Counts were obtained with a custom ImageJ pipeline using 6 to 8 replicate images. C) Average size of P6 foci in stacks corresponding to B). Values were calculated from 6 to 8 replicates with a custom ImageJ pipeline. D) Circularity distribution of P6 foci at each time point, as determined by ImageJ circularity masking. E) FRAP analysis of P6-GFP in mock conditions (n = 7) and in VFs at 21 dpi (n = 8). The photobleached region is indicated by a red circle. Scale bars = 5 µm. F) Normalized fluorescence intensities in FRAP analysis corresponding to (E) are plotted against time after bleaching. Solid lines represent mean, shades denote ±Sd. Letters in (B) to (C) indicate statistical groups determined by 1-way ANOVA followed by Tukey's HSD test (α = 0.05). For boxplots: the box represents the IQR, the solid lines represent the median. Whiskers extend to a maximum of 1.5× IQR beyond the box. For Violinplots: the box represents the IQR, the solid lines represent the median. Whiskers extend to a maximum of 1.5× IQR beyond the box. Violin shows the kernel probability density of the data.
Figure 2.
Figure 2.
SG proteins localize to VFs. A) Localization of canonical SG markers in Arabidopsis at 21 dpi with CaMV. Representative images are confocal Z-stack projections (Scale bars = 10 µm). B) Mander's colocalization coefficients of GFP-RBP47b (G) and P6-mRFP (R) at 21 dpi with CaMV. Values were calculated from 16 Z-stacks using the ImageJ plugin JACoP. C) Colocalization of GFP-RBP47b and P6-mRFP 21 dpi with CaMV after 30 min of HS. Representative images are confocal Z-stack projections (scale bars = 10 µm). The insets from CaMV + HS (yellow squares) are shown in the right column and represent single plain images (scale bars = 5 µm). D) Foci counts in 100 × 100 µm2 in infected tissues for GFP-RBP47b and GFP-G3BP7. Foci were separated into SG-like (<2 µm2) or VF-like (>2 µm2). HS, heat shock; RT, room temperature. Counts were averaged from 10 replicate images with a custom ImageJ pipeline. Letters indicate statistical groups determined by 1-way ANOVA followed by Tukey's HSD test (α = 0.05).
Figure 3.
Figure 3.
RNA granule components in VFs are unresponsive to SG/PB inhibition or induction. A) DCP5-GFP foci counts in 100 × 100 µm2 after EtOH (control) or 200 µM CHX treatment for 2 h. Counts were averaged from 6 replicates. B) GFP-RBP47b foci counts in 100 × 100 µm after 1 mM arsenite + EtOH and 1 mM arsenite +200 µM CHX treatment for 2 h. Counts were averaged from 6 replicates. C) Representative image of the GFP-RBP47b marker line after induction by arsenite (ars; upper panel) and additional treatment with CHX (lower panel) corresponding to (B) (scale bars = 10 µm). D) P6-GFP foci counts in 100 × 100 µm2 after EtOH or 200 µM CHX treatment for 2 h. Counts were averaged from 14 replicates. E) Fluorescent intensity of P6-GFP foci after EtOH and CHX treatment in (D). Violin plots represent counts of 7,513 (EtOH) and 5,839 (CHX) foci. F) Representative image of GFP-RBP47b and P6-mRFP double marker line 21 dpi with CaMV after treatment with either EtOH (upper panel) or 200 µM CHX (lower panel) for 2 h (Scale bars = 10 µm). G) Frequency diagram of P6-mRFP signal intensity in VFs after EtOH or CHX treatment. The x axis denotes the fluorescence intensity, the y axis denotes the counts in each bin (bin width = 25). The same imaging set up was used as in (F) to (I). H) GFP-RBP47b total foci count split between SG-like foci (<2 µm2) and VF-like foci (>2 µm2) after EtOH or CHX treatment. The same imaging set up was used as in (F), (G), and (I). I) Relative intensity of GFP-RBP47b compared to P6-mRFP within VFs after EtOH or CHX treatment. The same imaging set up was used as in (F) to (H). J) Fluorescent intensity of GFP-RBP47b and GFP-G3BP7 foci in RT, after 30 min HS at 38 °C, or after 1 mM arsenite treatment for 2 h (ars); n = 135 to 153 VFs in each condition. K) DCP5-GFP total foci count split between SG-like foci (<2 µm2) and VF-like foci (>2 µm2) after EtOH or 200 µM CHX treatment for 2 h. L) Fluorescent intensity of DCP5-GFP in VFs after EtOH (n = 57) or CHX treatment (n = 38) as in (K). M) Fluorescent intensity of DCP5-GFP in VFs in ambient temperatures, after 30 min HS at 38 °C or 1 mM arsenite treatment for 2 h; n = 82 to 95 VFs in each condition. Statistical significance for (A), (B), and (D) was calculated by Welch Two Sample t-test. For boxplots, the box represents the IQR, the solid lines represent the median. Whiskers extend to a maximum of 1.5× IQR beyond the box. For violinplots, the box represents the IQR, the solid lines represent the median. Whiskers extend to a maximum of 1.5× IQR beyond the box. Violin shows the kernel probability density of the data.
Figure 4.
Figure 4.
RNA granule proteins shuttle rapidly within VFs and their surroundings. A) FRAP analysis of the indicated proteins in VFs at 21 dpi at ambient temperatures (RT) or after 30 min of 38 °C HS. Normalized fluorescence intensities are plotted against time after photobleaching; n = 5 to 13. B) Representative image series from FRAP analysis of GFP-RBP47b after photobleaching corresponding to RT and HS in (A). Photobleached region is indicated by a circle. Scale bars = 5 µm. C) Representative image series from FRAP analysis of GFP-G3BP7 after photobleaching the whole VF at RT or after 30 min of 38 °C HS. Photobleached region is indicated by an outline. Scale bars = 5 µm. D) FRAP analysis of the indicated proteins in VFs and SGs at 21 dpi after 2 h of 1 mM arsenite treatment. Normalized fluorescence intensities are plotted against time after bleaching; n = 11/13 for VFs and 17/31 for SGs. E) FRAP analysis of DCP5 (n = 35) and LSM1a (n = 16) proteins in VFs at 21 dpi at ambient temperatures. Normalized fluorescence intensities are plotted against time after bleaching. F) FRAP analysis of eIF3g in VFs at 21 dpi at ambient temperatures. Normalized fluorescence intensities are plotted against time after bleaching; n = 7. G) Localization of eIF3g-GFP under uninfected mock conditions and 21 dpi with CaMV. Representative images are composed of confocal Z-stacks (scale bars = 10 µm). A, D to F) Solid lines represent mean, shades denote ±Sd.
Figure 5.
Figure 5.
SG and PB proteins strongly associate with different viral RNAs. A) Fold enrichment of viral RNAs in native RIPA from GFP-RBP47b over free GFP-expressing plants using ribosomal (r)RNA for calibration. Data points represent independent experiments; n = 2 independent experiments. B) As in (A) but including an in planta FA cross-linking step prior to RIPA; n = 4 independent experiments. C) Fold enrichment of viral RNAs in an in vitro RIPA with GST-RBP47b over the GST control using rRNA for calibration. Data points represent independent experiments; n = 4 independent experiments. D, E, and F) Fold of enrichment of viral RNAs in FA cross-linked RIPAs from GFP-G3BP7 (G), DCP5-GFP (H), and LSM1a-GFP (I) over free GFP expressing plants using rRNA for calibration. Data points represent independent experiments; n = 2 to 3 independent experiments. G) Immunoblot analysis using anti-GFP to verify capture of baits in the RIPAs of GFP, RBP47b, G3BP7, DCP5, and LSM1a; n = 2 to 3 independent experiments. Ponceau S (PS) staining served as loading control. H) Relative expression of viral RNAs and rRNA in input fractions of RIPA samples normalized to housekeeping gene PP2a; n = 4 independent experiments. Bars indicate mean of independent experiments, error bars denote ±Sd. Dots indicate single experiments.
Figure 6.
Figure 6.
Overexpression (OEX) of UBP1 family members reduces CaMV infectivity. A) Viral DNA accumulation in systemic leaves of the indicated genotypes at 21 dpi, as determined by RT-qPCR. Average is depicted by large dots, and replicates by small dots (n = 12), error bars denote ±Sd. Values are relative to Col-0 plants and normalized to 18S ribosomal DNA as the internal reference. Letters indicate statistical groups determined by 1-way ANOVA followed by Tukey's HSD test (α = 0.05). B) Infection success of CaMV scored at 21 dpi. Six plants were infected per pot and infectivity calculated as the fraction of systemically infected plants/total number of plants per pot. The total number of plants screened for each line is indicated below the graph. Average is depicted by large dots, and replicates by small dots, error bars denote ±Sd. C) Representative images of OEX lines of SG components not infected (upper panel) and 21 dpi with CaMV (lower panel). Scale bar = 2 cm. D) Viral DNA accumulation in systemic leaves of the indicated OEX lines at 21 dpi, as determined by RT-qPCR. Average is depicted by 1 large dot, and replicates by small symbols (n = 8 to 16), error bars denote ±Sd. Values are relative to Col-0 plants and normalized to 18S ribosomal DNA as the internal reference. Letters indicate statistical groups determined by 1-way ANOVA followed by Tukey's HSD test (α = 0.05). E) Immunoblot analysis using anti-GFP to visualize GFP-fusion protein accumulation in OEX-lines. All tested lines expressed GFP-fusion proteins (GFP-). Free GFP (GFP-) was used as control line. PS staining served as loading control.
Figure 7.
Figure 7.
P6 inhibits SG formation. A) GFP-RBP47b and GFP-G3BP7 foci counts in double marker lines with P6-mRFP in 100 × 100 µm2 regions. Counts were averaged from 10 to 15 replicates after 1 mM arsenite (ars) treatment for 2 h (left panel) or 30 min of 38 °C HS treatment (right panel). # denotes independent transgenic lines. The G3BP7 data for lines nos 1 and 2 were obtained separately and thus have individual controls (parental lines, marked with “-”) to their left; statistically significance differences for these groups were determined by Welch Two Sample t-test. B) Representative images of GFP-RBP47b and GFP-G3BP7 corresponding to (A) and (B). Examples of condensates containing both the SG marker and P6 are marked by arrows (scale bars = 10 µm). C) Polysome profiles of GFP-RBP47b with and without expression of P6s in untreated plants and after arsenite or heat treatment as in (A). D) Representative images of GFP-RBP47b and P6Y305P-mRFP double-marker line (scale bars = 10 µm). Note, the signal intensity of this mutant P6 was clearly lower, causing a partial bleed-through signal from chloroplasts in the P6 channel. E) GFP-RBP47b foci counts in double marker lines with P6Y305P-mRFP in 100 × 100 µm2 regions. Counts were averaged from 6 replicates after arsenite treatment. Two independent lines were used (nos 1 and 2), “-” marks parental control line. A, E) Letters indicate statistical groups determined by 1-way ANOVA followed by Tukey's HSD test (α = 0.05). For boxplots: the box represents the IQR, the solid lines represent the median. Whiskers extend to a maximum of 1.5× IQR beyond the box.
Figure 8.
Figure 8.
SG inhibition and trans-activation can be uncoupled and are reduced by P6 condensation. A) Density polygon (bin width = 25) of GFP-RBP47b fluorescence intensities within preassembled P6-mRFP condensates (n = 90) in the transgenic lines (Fig. 7A), VFs from plants at 21 dpi (n = 83) and SGs induced using 1 mM arsenite treatment (n = 634). B) Representative image composed of confocal Z-stack projection of GFP-RBP47b/P6 coexpression in N. benthamiana at 3 d after infiltration. The specific P6 constructs are indicated above the images (scale bars = 10 µm). C) Immunoblot analysis of the P6 constructs expressed in N. benthamiana at 3 dai (days after infiltration). Total (T) protein samples were extracted and subjected to differential centrifugation, resulting in soluble (S) and pellet (P) fraction. Blots were probed with mRFP and tagRFP specific antibodies, respectively. PS staining served as a loading control. D) Immunoblot of CaMV proteins P6 and P4 in systemically infected Arabidopsis leaves at 21 dpi probed with specific antibodies. Total (T) protein samples were extracted and subjected to differential centrifugation, resulting in soluble (S) and pellet (P) fraction. PS staining served as a loading control. E) GFP-RBP47b foci counts in 100 × 100 µm2 regions of N. benthamiana (Nb) leaves coexpressing the indicated P6 constructs at 3 dai after a 30 min 38 °C HS treatment. Counts were averaged from 10 (full length constructs) or 5 (P6ΔN constructs) replicates and analyzed with a custom ImageJ pipeline. The box represents the IQR, the solid lines represent the median. Whiskers extend to a maximum of 1.5× IQR beyond the box. F) Analysis of transactivation activity for the indicated P6 constructs compared to free mRFP in N. benthamiana. P6s and control were coinfiltrated with FLUC-3Xstop-RLUC and luciferase activity was analyzed at 3 dai (left panel). Increased activity of transactivation is indicated by a higher RLUC to FLUC ratio. P6 has no influence on the ratio of RLUC/FLUC when coexpressed with FLUC-linker-RLUC without the stop codons (right panel; n = 4). Bars depict mean of values, error bars denote ±Sd. Symbols indicate replicates within 3 independent repetitions.
Figure 9.
Figure 9.
Proposed model for P6 cap and node properties in SGs and VF condensation. The presence of P6 within SGs disrupts the interaction network of canonical SG proteins. P6 occupies the binding sites needed for condensation, thereby acting as a “valence cap” and thus inhibiting the establishment of SGs. On the other hand, SG proteins are sequestered into VFs, where P6 is a multivalent protein that interacts with RNA, viral proteins (including itself), as well as a plethora of host proteins. As such, P6 provides a basis for several interactions, building a matrix that grows over time into mature VFs. The more P6 that is bound within this tight network, the less interaction capacity it has for SG inhibition and translational transactivation, implying a gradual shift in P6 functions during the infection time-course.

Similar articles

Cited by

References

    1. Abulfaraj AA, Mariappan K, Bigeard J, Manickam P, Blilou I, Guo X, Al-Babili S, Pflieger D, Hirt H, Rayapuram N. The Arabidopsis homolog of human G3BP1 is a key regulator of stomatal and apoplastic immunity. Life Sci Alliance. 2018:1(2):e201800046. 10.26508/lsa.201800046 - DOI - PMC - PubMed
    1. Alberti S, Gladfelter A, Mittag T. Considerations and challenges in studying liquid-liquid phase separation and biomolecular condensates. Cell. 2019:176(3):419–434. 10.1016/j.cell.2018.12.035 - DOI - PMC - PubMed
    1. Alers-Velazquez R, Jacques S, Muller C, Boldt J, Schoelz J, Leisner S. Cauliflower mosaic virus P6 inclusion body formation: a dynamic and intricate process. Virology. 2021:553:9–22. 10.1016/j.virol.2020.10.003 - DOI - PubMed
    1. Bak A, Gargani D, Macia JL, Malouvet E, Vernerey MS, Blanc S, Drucker M. Virus factories of Cauliflower mosaic virus are virion reservoirs that engage actively in vector transmission. J Virol. 2013:87(22):12207–12215. 10.1128/JVI.01883-13 - DOI - PMC - PubMed
    1. Bernstam L, Nriagu J. Molecular aspects of arsenic stress. J Toxicol Environ Health B Crit Rev. 2000:3(4):293–322. 10.1080/109374000436355 - DOI - PubMed

Publication types

MeSH terms