. 2023 Jun 26;35(7):2570-2591.
doi: 10.1093/plcell/koad105.

CycC1;1-WRKY75 complex-mediated transcriptional regulation of SOS1 controls salt stress tolerance in Arabidopsis

Affiliations

CycC1;1-WRKY75 complex-mediated transcriptional regulation of SOS1 controls salt stress tolerance in Arabidopsis

Kai-Kai Lu et al. Plant Cell. .

Erratum in

Abstract

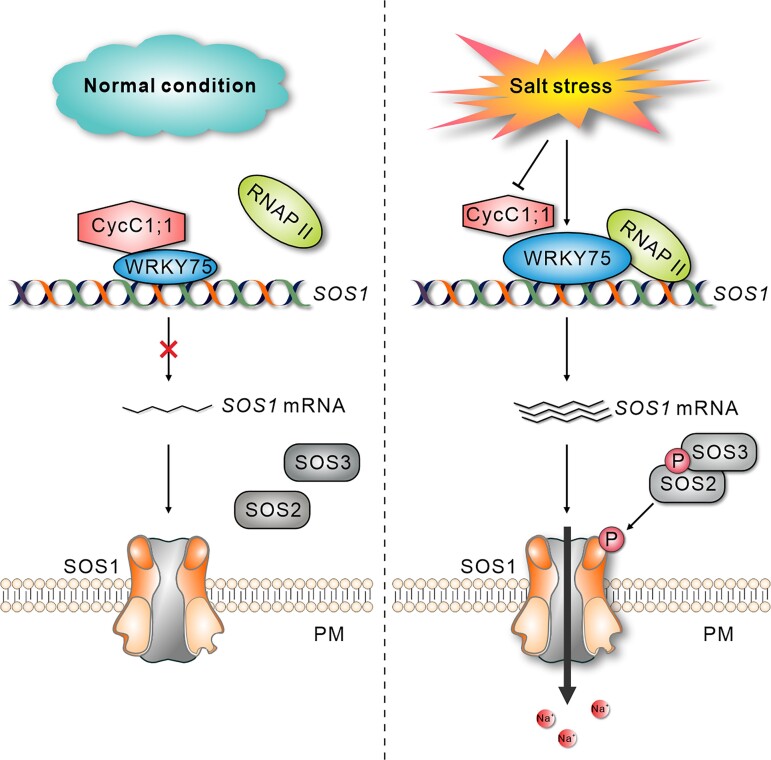
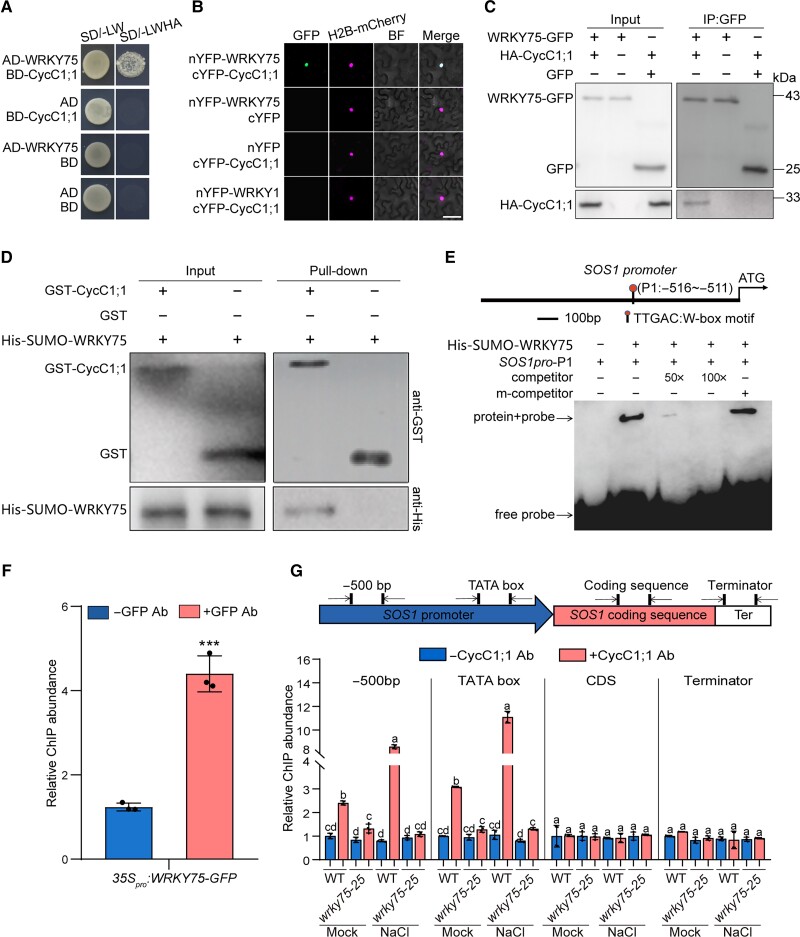
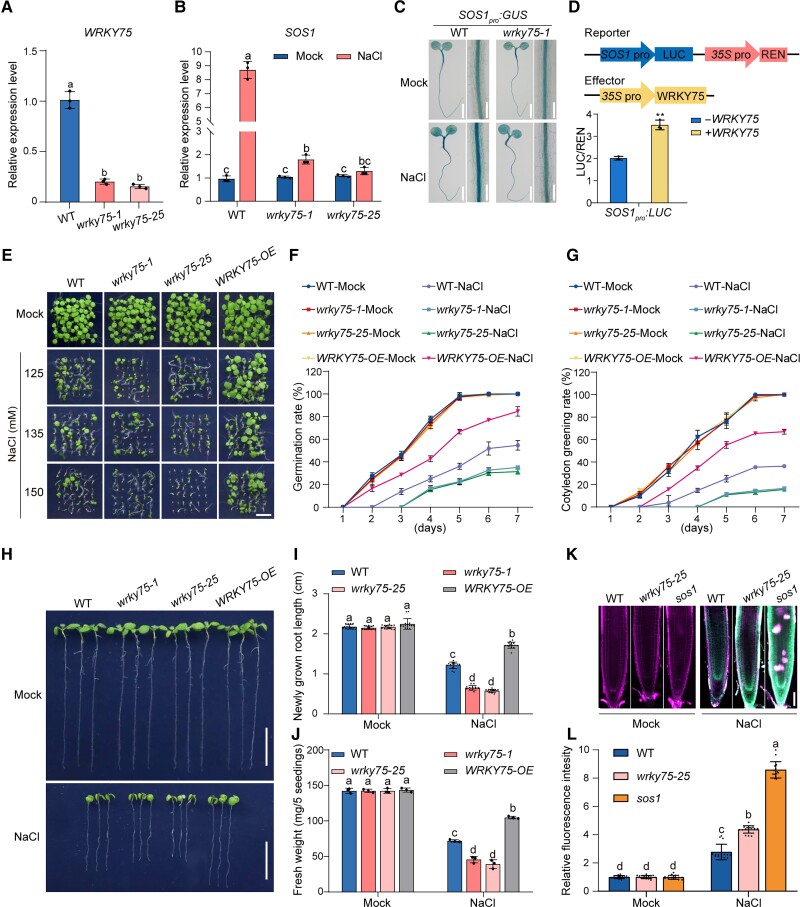
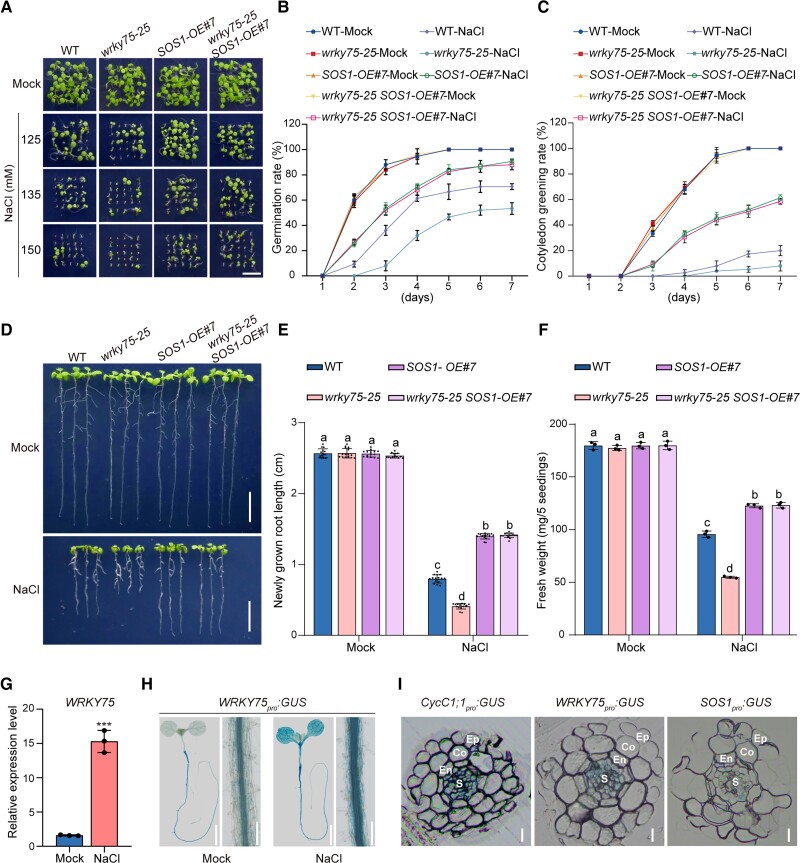
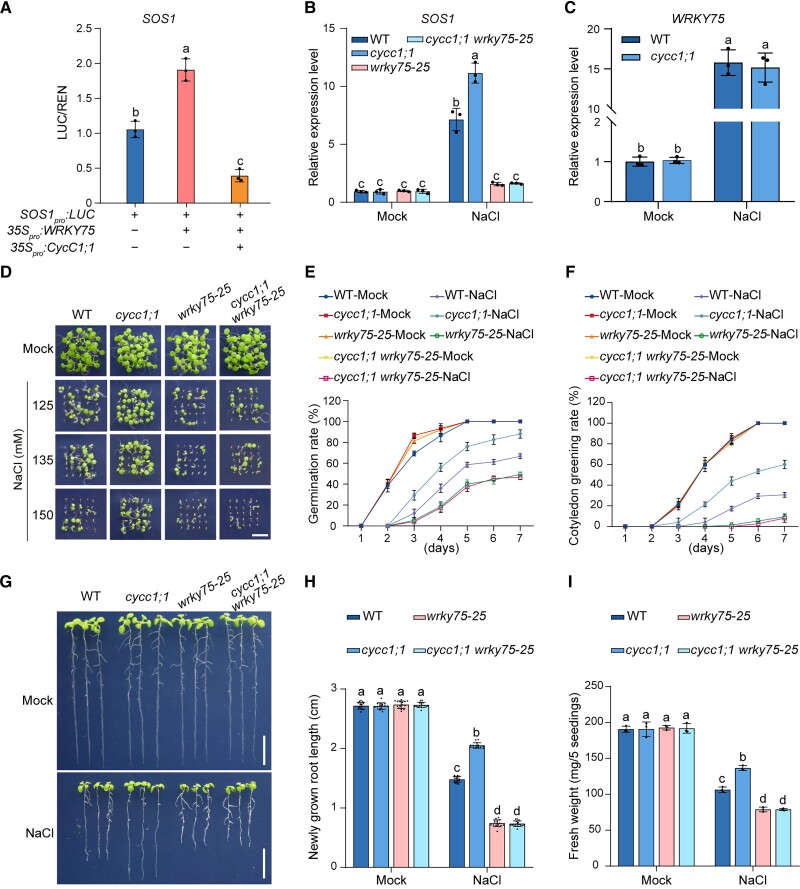
SALT OVERLY SENSITIVE1 (SOS1) is a key component of plant salt tolerance. However, how SOS1 transcription is dynamically regulated in plant response to different salinity conditions remains elusive. Here, we report that C-type Cyclin1;1 (CycC1;1) negatively regulates salt tolerance by interfering with WRKY75-mediated transcriptional activation of SOS1 in Arabidopsis (Arabidopsis thaliana). Disruption of CycC1;1 promotes SOS1 expression and salt tolerance in Arabidopsis because CycC1;1 interferes with RNA polymerase II recruitment by occupying the SOS1 promoter. Enhanced salt tolerance of the cycc1;1 mutant was completely compromised by an SOS1 mutation. Moreover, CycC1;1 physically interacts with the transcription factor WRKY75, which can bind to the SOS1 promoter and activate SOS1 expression. In contrast to the cycc1;1 mutant, the wrky75 mutant has attenuated SOS1 expression and salt tolerance, whereas overexpression of SOS1 rescues the salt sensitivity of wrky75. Intriguingly, CycC1;1 inhibits WRKY75-mediated transcriptional activation of SOS1 via their interaction. Thus, increased SOS1 expression and salt tolerance in cycc1;1 were abolished by WRKY75 mutation. Our findings demonstrate that CycC1;1 forms a complex with WRKY75 to inactivate SOS1 transcription under low salinity conditions. By contrast, under high salinity conditions, SOS1 transcription and plant salt tolerance are activated at least partially by increased WRKY75 expression but decreased CycC1;1 expression.


Conflict of interest statement

Conflict of interest statement. None declared.

Figures

Graphical Abstract
Graphical Abstract
Figure 1.
Figure 1.
CycC1;1 negatively regulates plant salt tolerance. A to C) Phenotypes A) of the wild-type, cycc1;1, and complementation (Com) plants grown on 1/2× MS medium supplemented with 0 mM, 125 mM, 135 mM, or 150 mM NaCl for 5 d. Bar = 0.5 cm. Quantitative analysis of seed germination B) and cotyledon greening rates C) of plants grown on 1/2× MS medium supplemented with 0 mM or 125 mM NaCl for 7 d. Data are means ± Sd of 3 independent biological repeats. D to F) Root elongation and fresh weight analysis. Five-day-old wild-type, cycc1;1, and Com plants were transferred to 1/2× MS medium supplemented with 0 mM or 125 mM NaCl for additional growth. Photographs were taken 5 d after transfer D). Bar = 1 cm. The lengths of newly grown roots E) and the fresh weights F) of the seedlings were also analyzed. Data are means ± Sd (n = 15 for root length and n = 3 for fresh weight). Bars with different letters indicate significant differences at P < 0.05, determined using ANOVA with a Tukey's multiple comparison test (Supplemental Data Set 1). G) RT-qPCR results showing the expression of CycC1;1 in different plant tissues, including stem, root, seed, rosette leaf, flower, and silique. The experiment was repeated 3 times. Data are means ± Sd (n = 4). ACTIN2 was used as a reference gene. H) Glucuronidase (GUS) staining images of the CycC1;1pro:GUS transgenic reporter plants. a, seed; b, 1-d-old germinating seed; c, 3-d-old seedling; d, 5-d-old seedling; e, 7-d-old seedling; f, cauline leaf; g, rosette leaf; h, flower; i, silique; j, 5-d-old seedling root tip. a to c, j, bar = 2 mm; d to i, bar = 0.5 cm. I) Nuclear localization of CycC1;1-GFP in the 5-d-old 35Spro:CycC1;1-GFP transgenic plant root. DAPI was used to stain the nucleus. Bar = 100 μm. J) The expression of CycC1;1 in 5-d-old wild-type plant seedlings treated with or without 100 mM for 12 h. The experiment was repeated 3 times. Error bars indicate mean ± Sd (n = 4). Asterisks indicate significant differences determined by Student's t test (***P < 0.001). K) GUS staining images of the 5-d-old CycC1;1pro:GUS transgenic seedlings treated without or with 100 mM for 12 h. Bar = 0.5 cm.
Figure 2.
Figure 2.
CycC1;1 negatively regulates salt-induced SOS1 expression in plants. A, B) Sodium accumulation in wild-type and cycc1;1 mutant seedling roots. Five-day-old wild-type and cycc1;1 seedlings were treated with 100 mM NaCl for 3 h and then stained in a 10 μM ENG-2 AM solution containing 0.05% Pluronic F-127 for 3 h. Fluorescence images A) were taken, and the ENG-2 AM fluorescence intensity B) was analyzed. Bar = 50 μm. Data are means ± Sd of 3 independent repeats (n = 15). Bars with different letters indicate significant differences at P < 0.05, revealed using ANOVA with a Tukey's multiple comparison test (Supplemental Data Set 1). C) The expression of SOS1 in the wild-type and cycc1;1 mutant seedlings subjected to salt stress. Seven-day-old wild-type and cycc1;1 mutant seedlings treated with or without 100 mM NaCl for 12 h. Data are means ± Sd (n = 3). Bars with different letters indicate significant differences at P < 0.05, revealed using ANOVA with a Tukey's multiple comparison test (Supplemental Data Set 1). D) GUS staining images of 5-d-old transgenic SOS1pro:GUS in the wild-type, cycc1;1, and OE backgrounds treated with 0 mM or 100 mM NaCl for 12 h. Bar = 0.5 cm. E, F) LUC reporter gene assay to examine the effect of CycC1;1 on SOS1 expression. The schematic diagram E) shows the reporters and effectors used in the assay. The relative LUC intensity F) represents the SOS1pro:LUC activity relative to the internal control (REN driven by 35Spro). The activity of SOS1pro:LUC without CycC1;1 expression was set to 1. Data are means ± Sd (n = 3). Asterisks indicate significant differences determined by Student's t test (***P < 0.001). G to I) NMT showing Na+ fluxes. Ten-day-old wild-type and cycc1;1 mutant seedlings cultured in 1/2× MS liquid medium were treated with 0 mM G) or 150 mM NaCl H) for 5 h, and then the continuous transient Na+ fluxes were recorded for about 6 min. Each point is the mean of 4 individual plants. Quantitative analysis of the means of net Na+ fluxes within a continuous period of 0 to 6 min I). Data are means ± Sd (n = 3). Bars with different letters indicate significant differences at P < 0.05, revealed using ANOVA with a Tukey's multiple comparison test (Supplemental Data Set S1). J) A diagram showing the positions of SOS1 gene primers used for ChIP-qPCR is shown at the top. The ChIP-qPCR results showing the association of CycC1;1 with SOS1 is shown at the bottom. Chromatin was extracted from 7-d-old wild-type seedlings and then precipitated with either an anti-CycC1;1 antibody (+Ab) or only IgG (−Ab). Data are means ± Sd (n = 3). Asterisks indicate significant differences determined by Student's t test (***P < 0.001). K) Occupancy of RNAP II at the SOS1 promoter in the wild-type and cycc1;1 mutants. Chromatin was extracted from 7-d-old wild-type and cycc1;1 mutant seedlings and precipitated with an anti-RPB2 antibody (+RPB2) or only IgG (−RPB2). Data are means ± Sd (n = 4). Bars with different letters indicate significant differences at P < 0.05, determined using ANOVA with a Tukey's multiple comparison test.
Figure 3.
Figure 3.
CycC1;1 affects plant salt tolerance through SOS1. A to C) Phenotypes A) of the wild-type, cycc1;1, sos1, and cycc1;1 sos1 plants grown on 1/2× MS medium supplemented with 0 mM, 125 mM, 135 mM, or 150 mM NaCl for 5 d. Quantitative analysis of seed germination B) and cotyledon greening rates C) of plants grown on 1/2× MS medium supplemented with 0 mM or 125 mM NaCl for 7 d. Data are means ± Sd of 3 independent experiments (n = 3). D to F) Root elongation and fresh weight analysis. Five-day-old wild-type, cycc1;1, sos1, and cycc1;1 sos1 plants were transferred to 1/2× MS medium supplemented with 0 mM or 125 mM NaCl for additional growth. The photographs were taken 5 d after transfer D). Bar = 1 cm. The lengths of newly grown roots E) and the fresh weights F) of the seedlings were also analyzed. Data are means ± Sd (n = 15 for root length and n = 3 for fresh weight). Bars with different letters indicate significant differences at P < 0.05, revealed using ANOVA with a Tukey's multiple comparison test (Supplemental Data Set 1). G to I) Net Na+ fluxes in root tips using NMT. Ten-day-old wild-type, cycc1;1, sos1, and cycc1;1 sos1 mutant seedlings cultured in 1/2× MS liquid medium were treated with 0 mM G) or 150 mM NaCl H) for 5 h, and then continuous transient Na+ fluxes were recorded for about 6 min. Each point is the mean of data from 4 individual plants. Quantitative analysis of the means of net Na+ fluxes within a continuous period of 0 to 6 min I). Data are means ± Sd (n = 3). Bars with different letters indicate significant differences at P < 0.05, revealed using ANOVA with a Tukey's multiple comparison test.
Figure 4.
Figure 4.
CycC1;1 associates with SOS1 promoter by interacting with WRKY75. A) Interaction between WRKY75 and CycC1;1 examined by Y2H assay. Protein interactions were examined based on the growth of yeast cells on selective media. SD indicates synthetic dropout medium. −L/W indicates Leu and Trp dropout plates. −L/W/H/A indicates Trp, Leu, His, and Ade dropout plates. B) BiFC showing CycC1;1 interaction with WRKY75. nYFP-WRKY75 and cYFP-CycC1;1 were transiently coexpressed in N. benthamiana leaves, and YFP fluorescence was observed under confocal microscopy. H2B-mCherry (Rosa et al. 2014) was used as a nuclear marker. Bar = 20 μm. C) Interaction between WRKY75 and CycC1;1 assayed by Co-IP. GFP or GFP-tagged WRKY75 and HA-tagged CycC1;1 were transiently coexpressed in N. benthamiana leaves, and proteins were immunoprecipitated using anti-GFP antibody-conjugated agarose beads. The resulted precipitates were detected using anti-GFP and anti-HA antibodies, respectively. D) GST pull-down for the analysis of in vitro interaction between WRKY75 and CycC1;1. 6×His-SUMO-WRKY75 were mixed with GST-CycC1;1 or GST and immobilized on Glutathione Sepharose beads. After washing, the eluted proteins were subjected to immunoblot analysis with anti-GST or anti-His antibodies, respectively. E) The EMSA experiment showing that WRKY75 can bind to the SOS1 promoter in vitro. A diagram showing the SOS1 promoter has a typical W-box motif (−516∼−511 bp) recognized by WRKY75 transcription factor is shown at the top. Purified 6×His-SUMO-WRKY75 was incubated with biotin-labeled SOS1 promoter probes, and unlabeled probes (mutated or not mutated) were used as competitors. F) ChIP-qPCR showing that WRKY75 can bind to the SOS1 promoter in vivo. Chromatin was extracted from 7-d-old 35Spro:WRKY75-GFP transgenic seedlings and then precipitated with either an anti-GFP antibody (+Ab) or only IgG (−Ab). Data are means ± Sd (n = 3). Asterisks indicate significant differences determined by Student's t test (***P < 0.001). G) A diagram showing the positions of SOS1 gene primers used for ChIP-qPCR is shown at the top. The ChIP-qPCR results showing the changes of CycC1;1 association with SOS1 in the wild-type and wrky75-25 mutant are shown at the bottom. Chromatin was extracted from 7-d-old wild-type and wrky75-25 mutant seedlings and precipitated with anti-CycC1;1 antibody (+Ab) or only IgG (−Ab). Data are means ± Sd (n = 4). Bars with different letters indicate significant differences at P < 0.05, determined using ANOVA with a Tukey's multiple comparison test.
Figure 5.
Figure 5.
WRKY75 is required for salt-induced SOS1 expression. A) Expression of WRKY75 in 5-d-old wild-type, wrky75-1, and wrky75-25 mutant plants. Data are means ± Sd (n = 3). Bars with different letters indicate significant differences at P < 0.05, determined using ANOVA with a Tukey's multiple comparison test. B) Expression of SOS1 in 5-d-old wild-type, wrky75-1, and wrky75-25 mutant plants treated with 0 mM (Mock) or 100 mM NaCl for 12 h. Data are means ± Sd (n = 3). Bars with different letters indicate significant differences at P < 0.05, revealed using ANOVA with a Tukey's multiple comparison test. C) GUS staining images of 5-d-old SOS1pro:GUS and SOS1pro:GUS wrky75-1 seedlings treated with 0 mM or 100 mM NaCl for 12 h. Bar = 0.5 cm. D) LUC reporter gene assay showing WRKY75-mediated activation of SOS1 expression. The schematic diagrams at the top show the reporters and effectors used in the assay. The relative LUC intensity represents the SOS1pro:LUC activity relative to the internal control (REN driven by the 35S promoter). The activity of SOS1pro:LUC without WRKY75 expression was set to 1. Data are means ± Sd (n = 3). Asterisks indicate significant differences determined by Student's t test (**P < 0.01). E to G) Phenotypes E) of the wild-type, wrky75-1, wrky75-25, and 35Spro:WRKY75-GFP (WRKY75-OE) plants grown on 1/2× MS medium supplemented with 0 mM, 125 mM, 135 mM, or 150 mM NaCl for 5 d. Quantitative analysis of seed germination F) and cotyledon greening G) of plants grown on 1/2× MS medium supplemented with 0 mM or 125 mM NaCl for 7 d. Data are means ± Sd of 3 independent repeats. H to J) Root elongation and fresh weight analysis. Five-day-old wild-type, wrky75-1, wrky75-25, and WRKY75-OE plants were transferred to 1/2× MS medium supplemented with 0 mM or 125 mM NaCl for additional growth. The photographs in H) were taken 5 d after transfer. Bar = 1 cm. The length of newly grown roots I) and the fresh weight J) of the seedlings were also analyzed. Data are means ± Sd of 3 independent repeats (n = 15 for root length and n = 3 for fresh weight). Bars with different letters indicate significant differences at P < 0.05, determined using ANOVA with a Tukey's multiple comparison test. K, L) Sodium accumulation in wild-type, wrky75-25, and sos1 mutant seedling roots. Five-day-old plant seedlings were treated with 100 mM NaCl for 12 h and then stained by 10 μM ENG-2 AM solution containing 0.05% Pluronic F-127 for 3 h. Fluorescence images K) were taken, and relative ENG-2 AM fluorescence intensity L) was analyzed. Data are means ± Sd of 3 independent repeats (n = 15). Bars with different letters indicate significant differences at P < 0.05, revealed using ANOVA with a Tukey's multiple comparison test.
Figure 6.
Figure 6.
WRKY75 acts upstream of SOS1 in the regulation of plant salt stress tolerance. A to C) Phenotypes A) of the wild-type, wrky75-25, 35Spro:SOS1-GFP#7 (SOS1-OE#7), and wrky75-25 SOS1-OE#7 plants grown on 1/2× MS medium supplemented with 0 mM, 125 mM, 135 mM, or 150 mM NaCl for 5 d. Quantitative analysis of seed germination B) and cotyledon greening rates C) of plants grown on 1/2× MS medium supplemented with 0 mM or 125 mM NaCl for 7 d. Data are means ± Sd (n = 3). D to F) Root elongation and fresh weight analysis. Five-day-old wild-type, wrky75-25, 35Spro:SOS1-GFP#7 (SOS1-OE#7), and wrky75-25 SOS1-OE#7 plants were transferred to 1/2× MS medium supplemented with 0 mM or 125 mM NaCl for additional growth. The photographs were taken 5 d after transfer D). Bar = 1 cm. The lengths of newly grown roots E) and the fresh weights F) of the seedlings were also analyzed. Data are means ± Sd (n = 15 for root length and n = 3 for fresh weight). Bars with different letters indicate significant differences at P < 0.05, determined using ANOVA with a Tukey's multiple comparison test. G) The expression of WRKY75 in 5-d-old wild-type plants treated with 0 mM or 100 mM NaCl for 12 h. Data are means ± Sd (n = 3). Asterisks indicate significant differences determined by Student's t test (***P < 0.001). H) GUS staining images of 5-d-old WRKY75pro:GUS transgenic plant seedlings and longitudinal sections of roots of plants treated with 0 mM or 100 mM NaCl for 12 h. Bar = 0.5 cm. I) GUS staining images showing transverse sections of 7-d-old CycC1;1pro:GUS, WRKY75pro:GUS, and SOS1pro:GUS seedling roots. Ep, epidermis; Co, cortex; En, endodermis; S, stele. Bar = 10 μm.
Figure 7.
Figure 7.
CycC1;1 interferes WRKY75-mediated transcriptional activation for SOS1. A) LUC reporter gene assay showing the effect of CycC1;1 on WRKY75-mediated activation of SOS1 expression. The relative LUC intensity represents the SOS1pro:LUC activity relative to the internal control (REN driven by the 35S promoter). The activity of SOS1pro:LUC without WRKY75 expression was set to 1. Data are means ± Sd (n = 3). B) The expression of SOS1 in 5-d-old wild-type, cycc1;1, wrky75-25, and cycc1;1 wrky75-25 mutant seedlings treated with 0 mM or 100 mM NaCl for 6 h. Data are means ± Sd (n = 3). Bars with different letters indicate significant differences at P < 0.05, determined using ANOVA with a Tukey's multiple comparison test. C) The expression of WRKY75 in 5-d-old wild-type and cycc1;1 mutant seedlings treated without or with 100 mM NaCl for 12 h. Data are means ± Sd (n = 3). ns, no significant differences. D to F) Phenotypes D) of the wild-type, cycc1;1, wrky75-25, and cycc1;1 wrky75-25 mutant plants grown on 1/2× MS medium supplemented with 0 mM, 125 mM, 135 mM, or 150 mM NaCl for 5 d. Quantitative analysis of seed germination E) and cotyledon greening rates F) of plants grown on 1/2× MS medium supplemented with 0 mM or 125 mM NaCl for 7 d. Data are means ± Sd (n = 3). G to I) Root elongation and fresh weight analysis. Five-day-old wild-type, cycc1;1, wrky75-25, and cycc1;1 wrky75-25 mutant plants were transferred to 1/2× MS medium supplemented with 0 mM or 125 mM NaCl for additional growth. The photographs were taken 5 d after transfer G). Bar = 1 cm. The lengths of newly grown roots H) and the fresh weights I) of the seedlings were also analyzed. Data are means ± Sd (n = 15 for root length and n = 3 for fresh weight). Bars with different letters indicate significant differences at P < 0.05, determined using ANOVA with a Tukey's multiple comparison test.
Figure 8.
Figure 8.
A proposed model showing the mechanism of CycC1;1–WRKY75 complex-mediated transcriptional regulation of SOS1 in response to different salinity conditions in Arabidopsis. Under the normal condition, CycC1;1 interacts with WRKY75 to form a transcriptional repression complex that inactivates SOS1 expression by interfering RNAP II occupancy on the promoter of SOS1 in WT seedlings. When plants are subjected to high salinity stress, the expression of CycC1;1 is suppressed while WRKY75 expression is stimulated, leading to increased recruitment of RNAP II to the SOS1 promoter, thereby activating SOS1 expression and enhancing salt tolerance in WT seedlings. When CycC1;1 is disrupted in the cycc1;1 mutant, WRKY75 transcriptional activation of SOS1 is further enhanced under high salinity conditions, thus leading to higher salt stress tolerance in the mutant than in the WT. In contrast to the cycc1;1 mutant, the wrky75 mutant has impaired salt-induced SOS1 transcription and thus attenuated salt stress tolerance. WT, wild-type; PM, plasma membrane; cycc1;1, CycC1;1 loss-of-function mutant; wrky75, WRKY75 loss-of-function mutant.

Comment in

References

    1. Agrawal R, Jiří F, Thakur JK. Kinase module of Mediator complex: important signalling processor for development and survival of plants. J Exp Bot. 2021:72(2):224–240. 10.1093/jxb/eraa439 - DOI - PubMed
    1. Asturias FJ, Jiang YW, Myers LC, Gustafsson CM, Kornberg RD. Conserved structures of mediator and RNA polymerase II holoenzyme. Science. 1999:283(5404):985–987. 10.1126/science.283.5404.985 - DOI - PubMed
    1. Barajas-Lopez JD, Moreno JR, Gamez-Arjona FM, Pardo JM, Punkkinen M, Zhu JK, Quintero FJ, Fujii H. Upstream kinases of plant SnRKs are involved in salt stress tolerance. Plant J. 2018:93(1):107–118. 10.1111/tpj.13761 - DOI - PMC - PubMed
    1. Chai H, Guo J, Zhong Y, Hsu CC, Zou C, Wang P, Zhu JK, Shi H. The plasma-membrane polyamine transporter PUT3 is regulated by the Na+/H+ antiporter SOS1 and protein kinase SOS2. New Phytol. 2020:226(3):785–797. 10.1111/nph.16407 - DOI - PubMed
    1. Chen J, Mohan R, Zhang Y, Li M, Fu ZQ. NPR1 promotes its own and target gene expression in plant defense by recruiting CDK8. Plant Physiol. 2019:181(1):289–304. 10.1104/pp.19.00124 - DOI - PMC - PubMed

Publication types

MeSH terms

LinkOut - more resources