Review
. 2023 Aug 10:6:47-71.
doi: 10.1146/annurev-biodatasci-020422-050255. Epub 2023 Apr 11.

Computational Methods for Single-Cell Proteomics

Affiliations
Review

Computational Methods for Single-Cell Proteomics

Sophia M Guldberg et al. Annu Rev Biomed Data Sci. .

Abstract

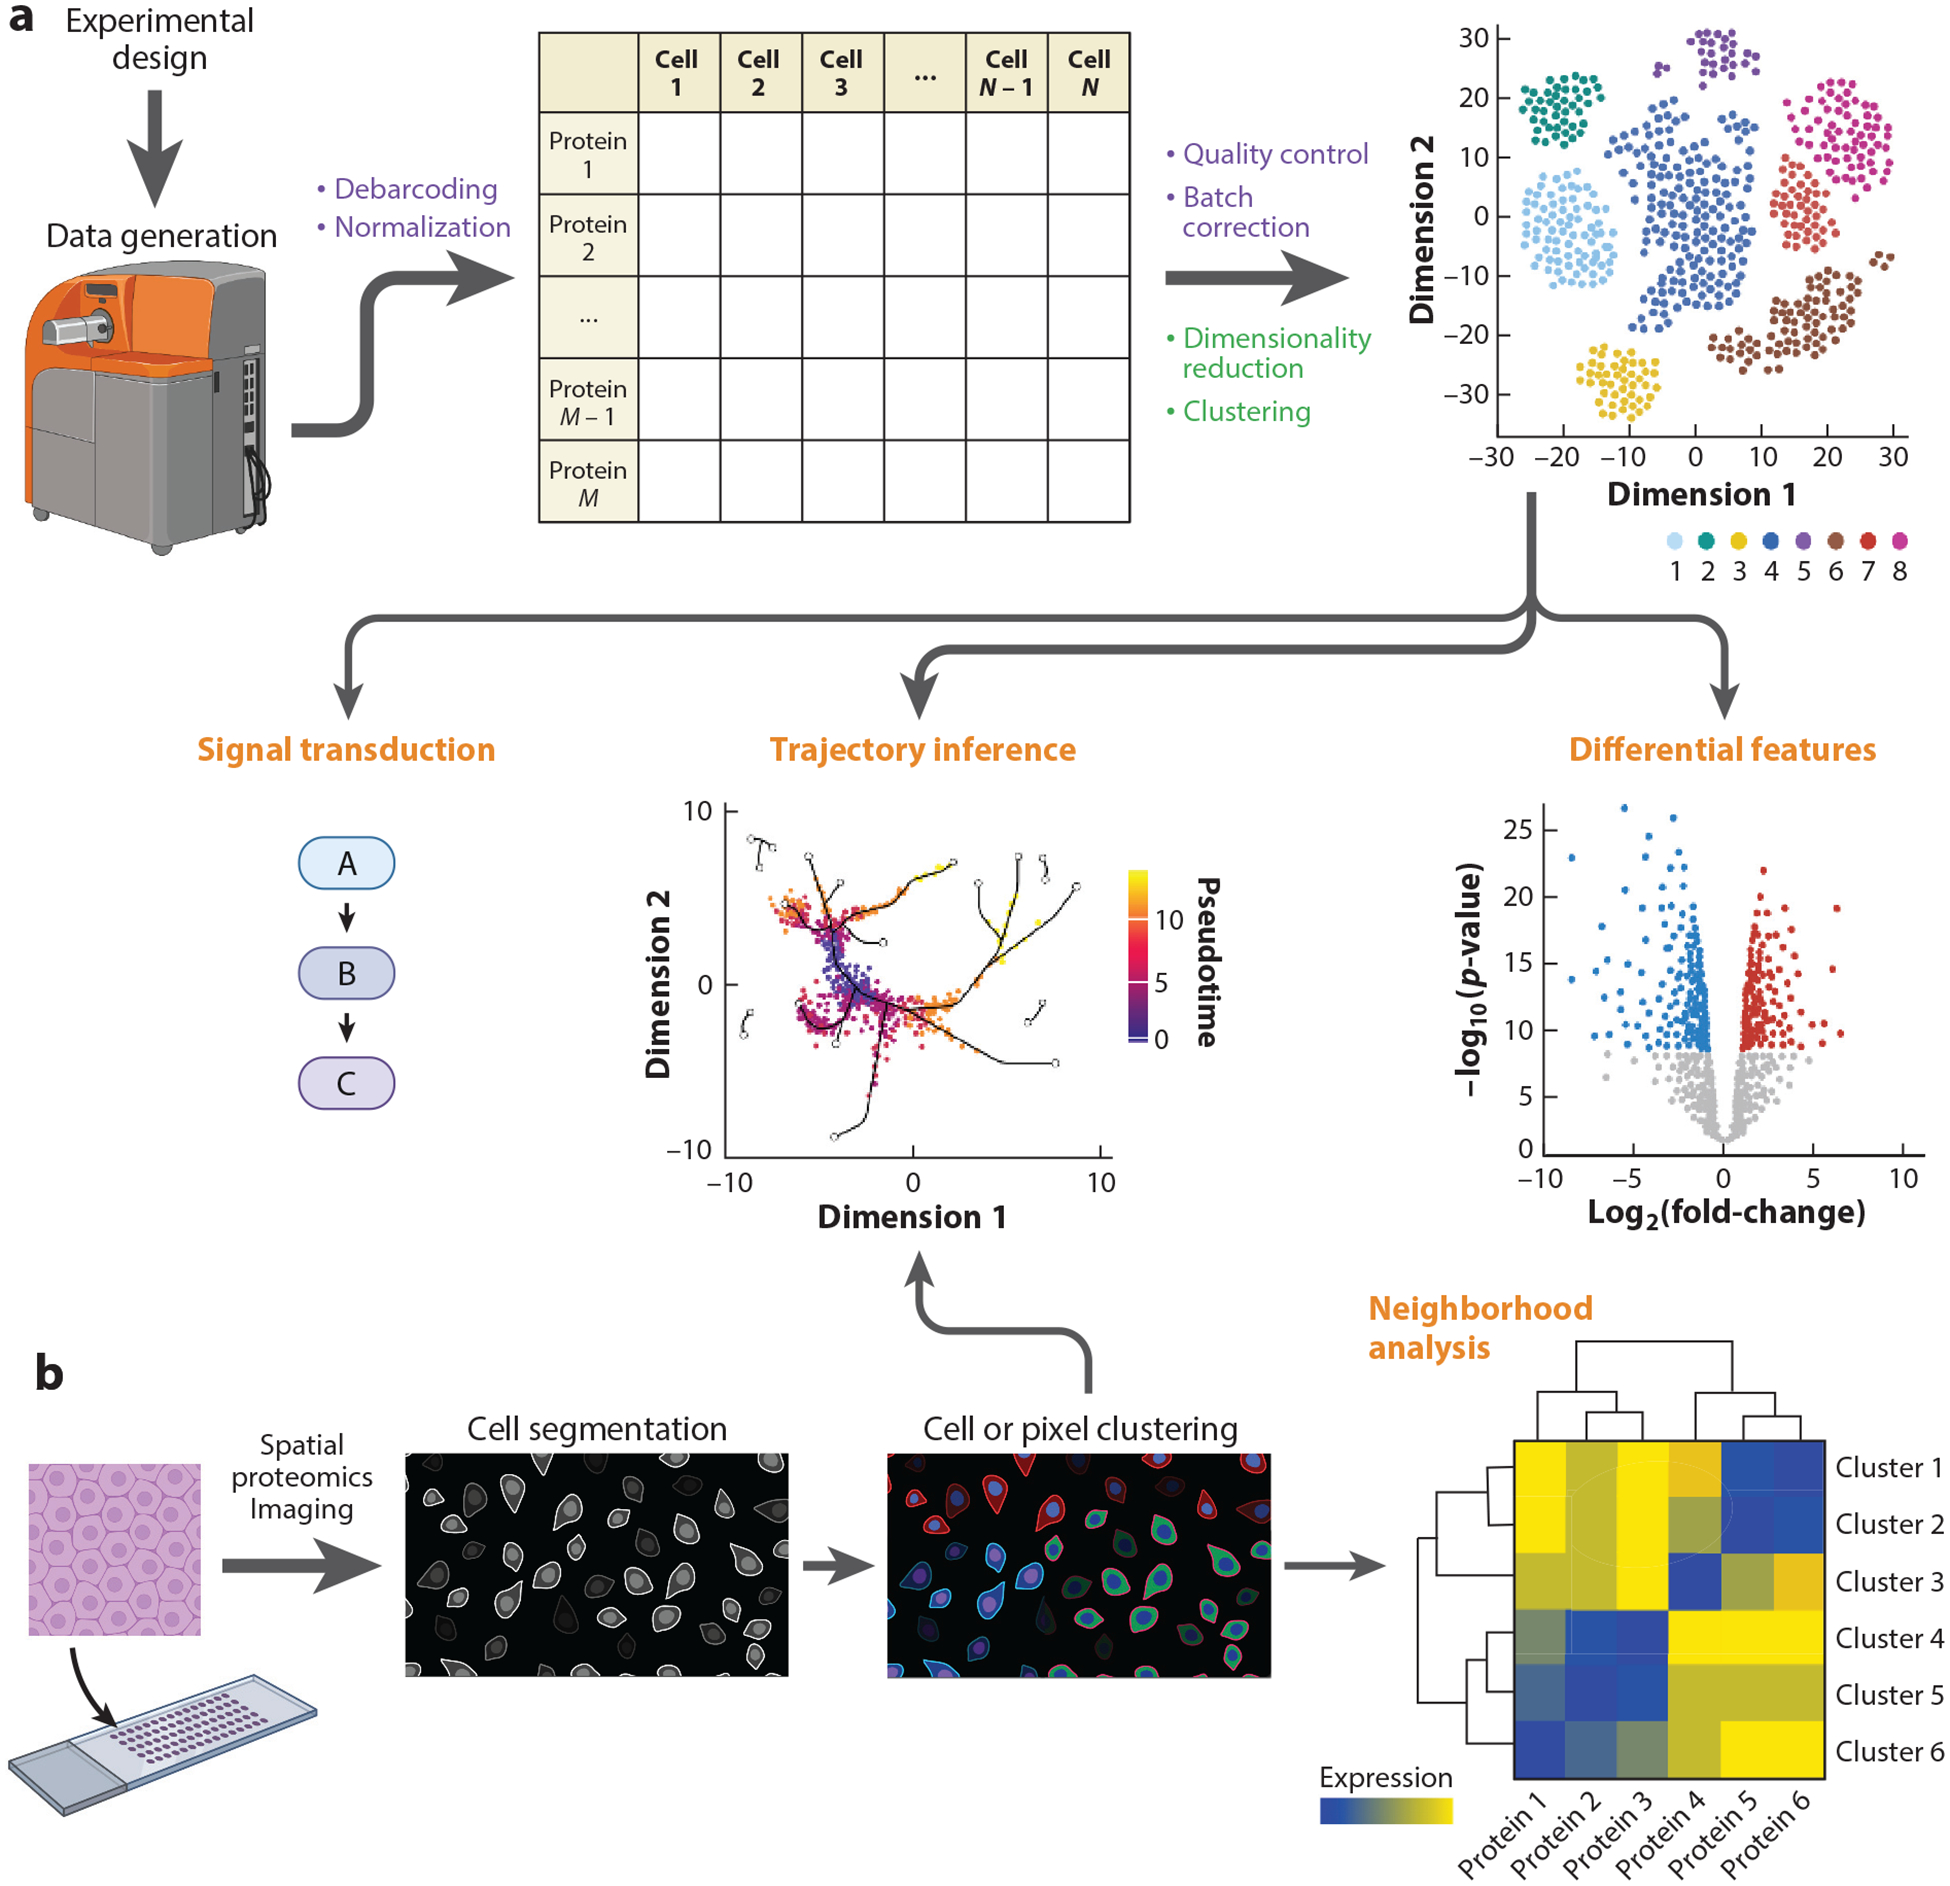
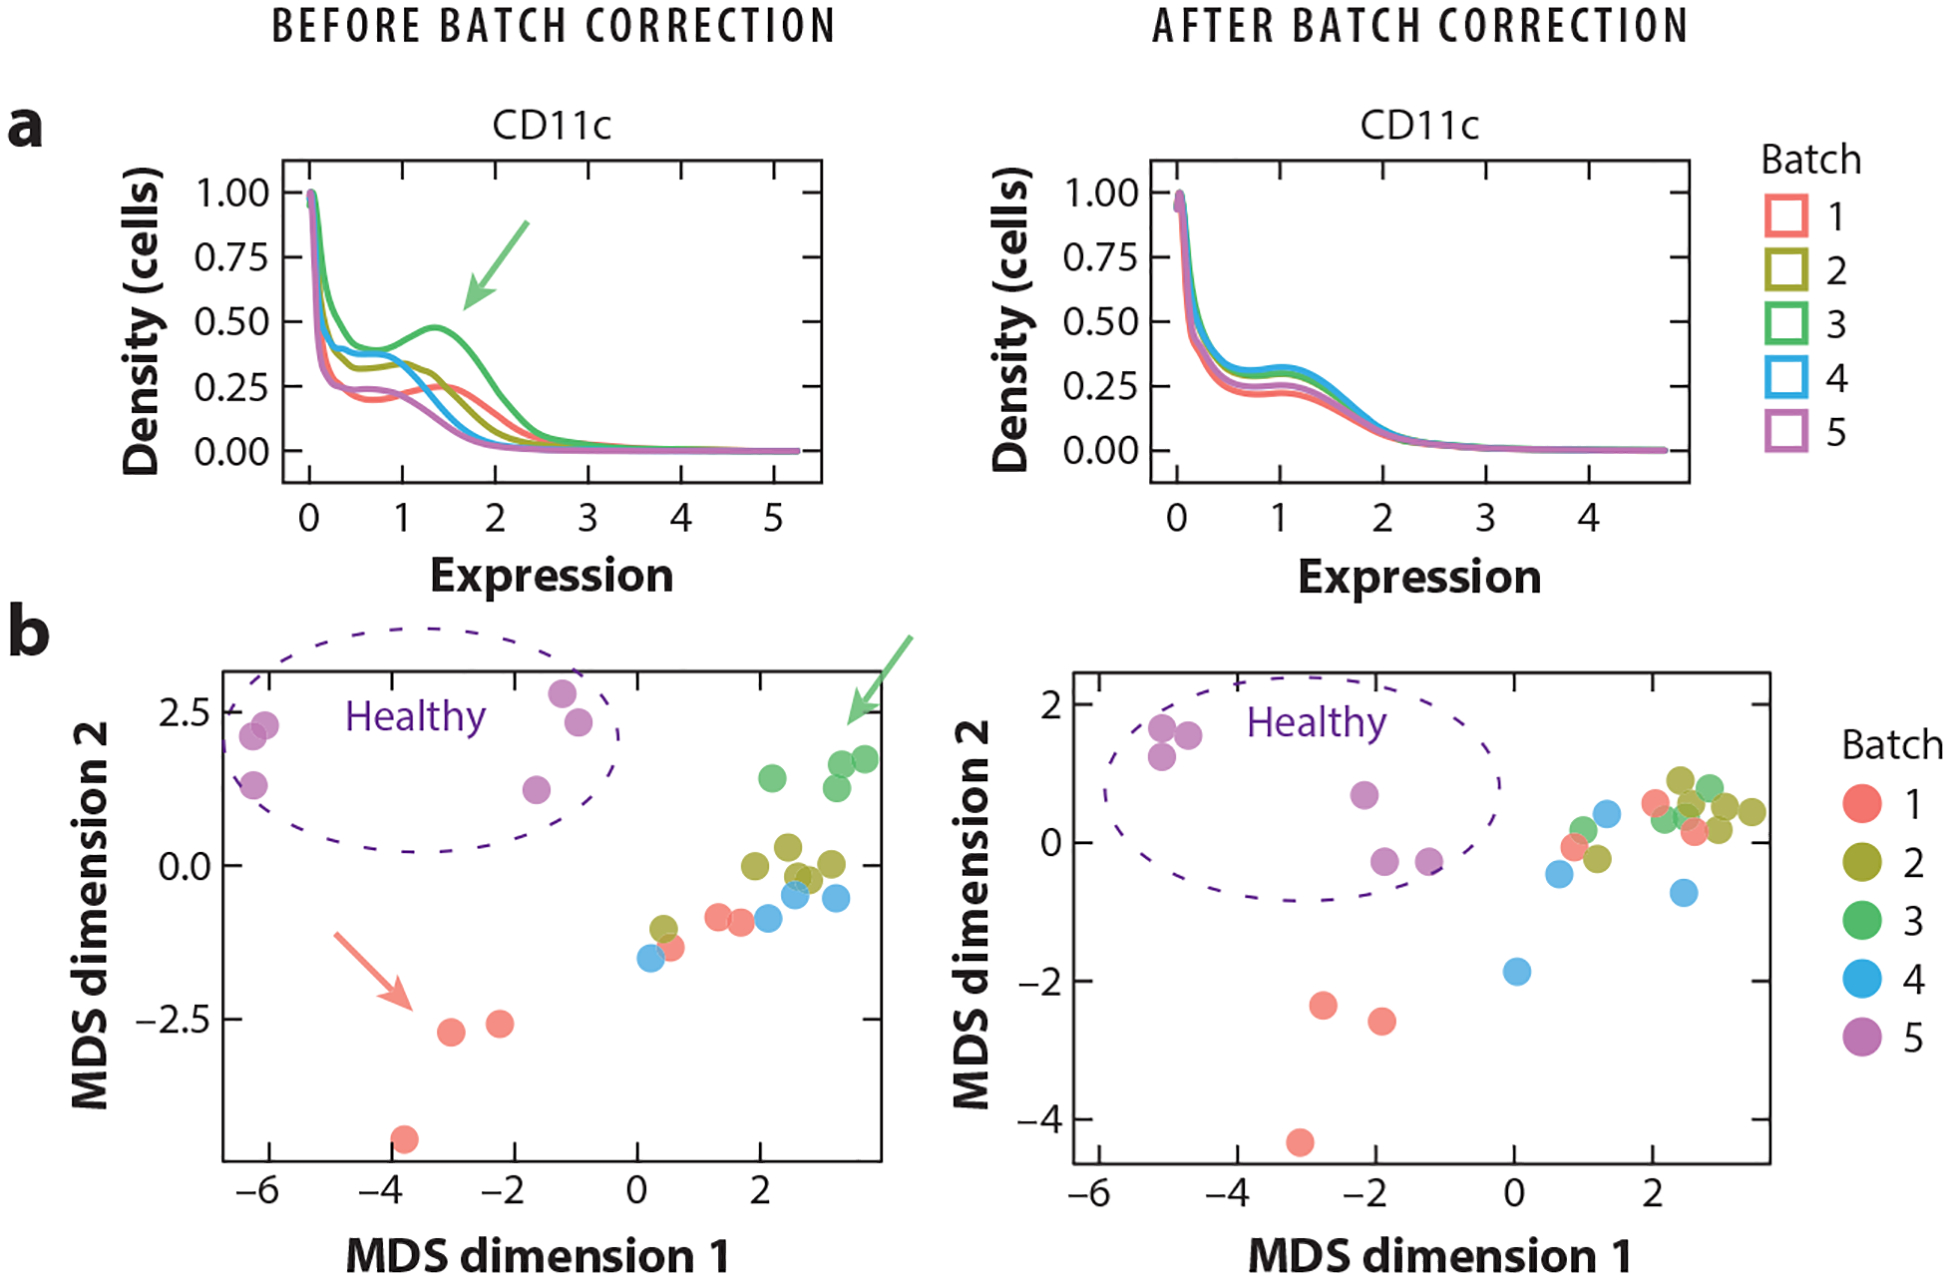
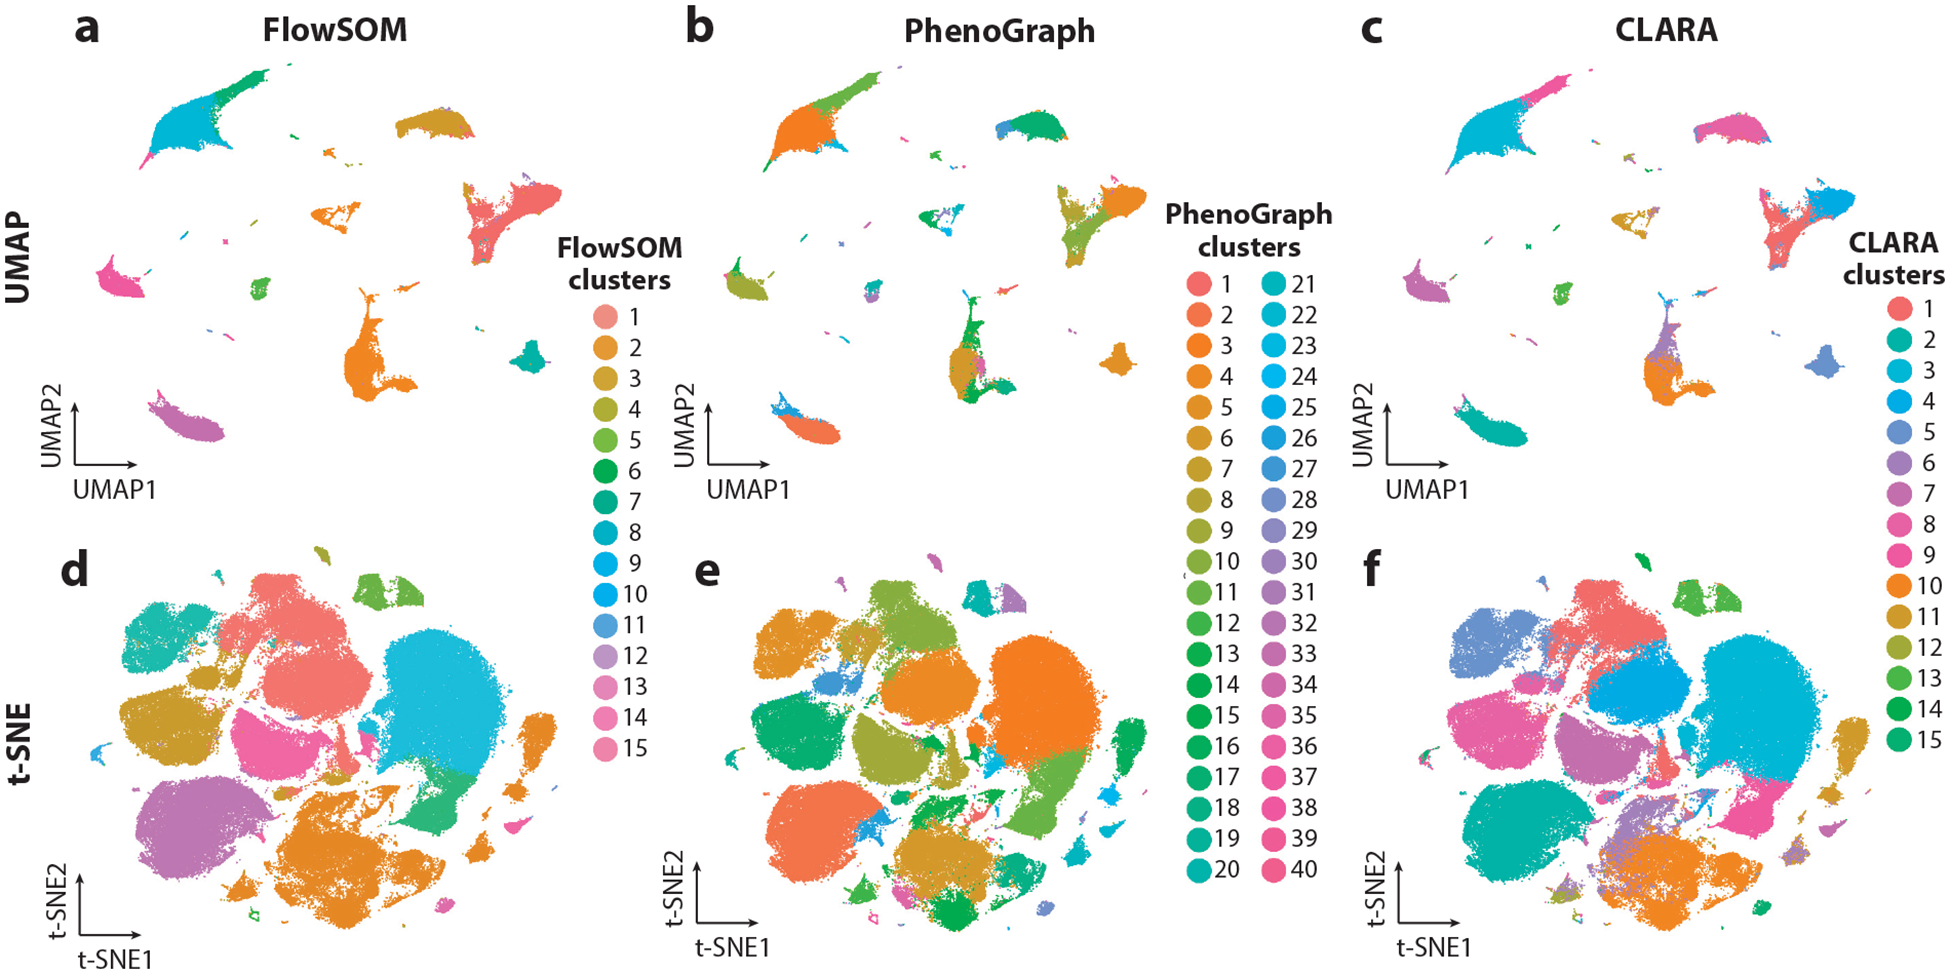
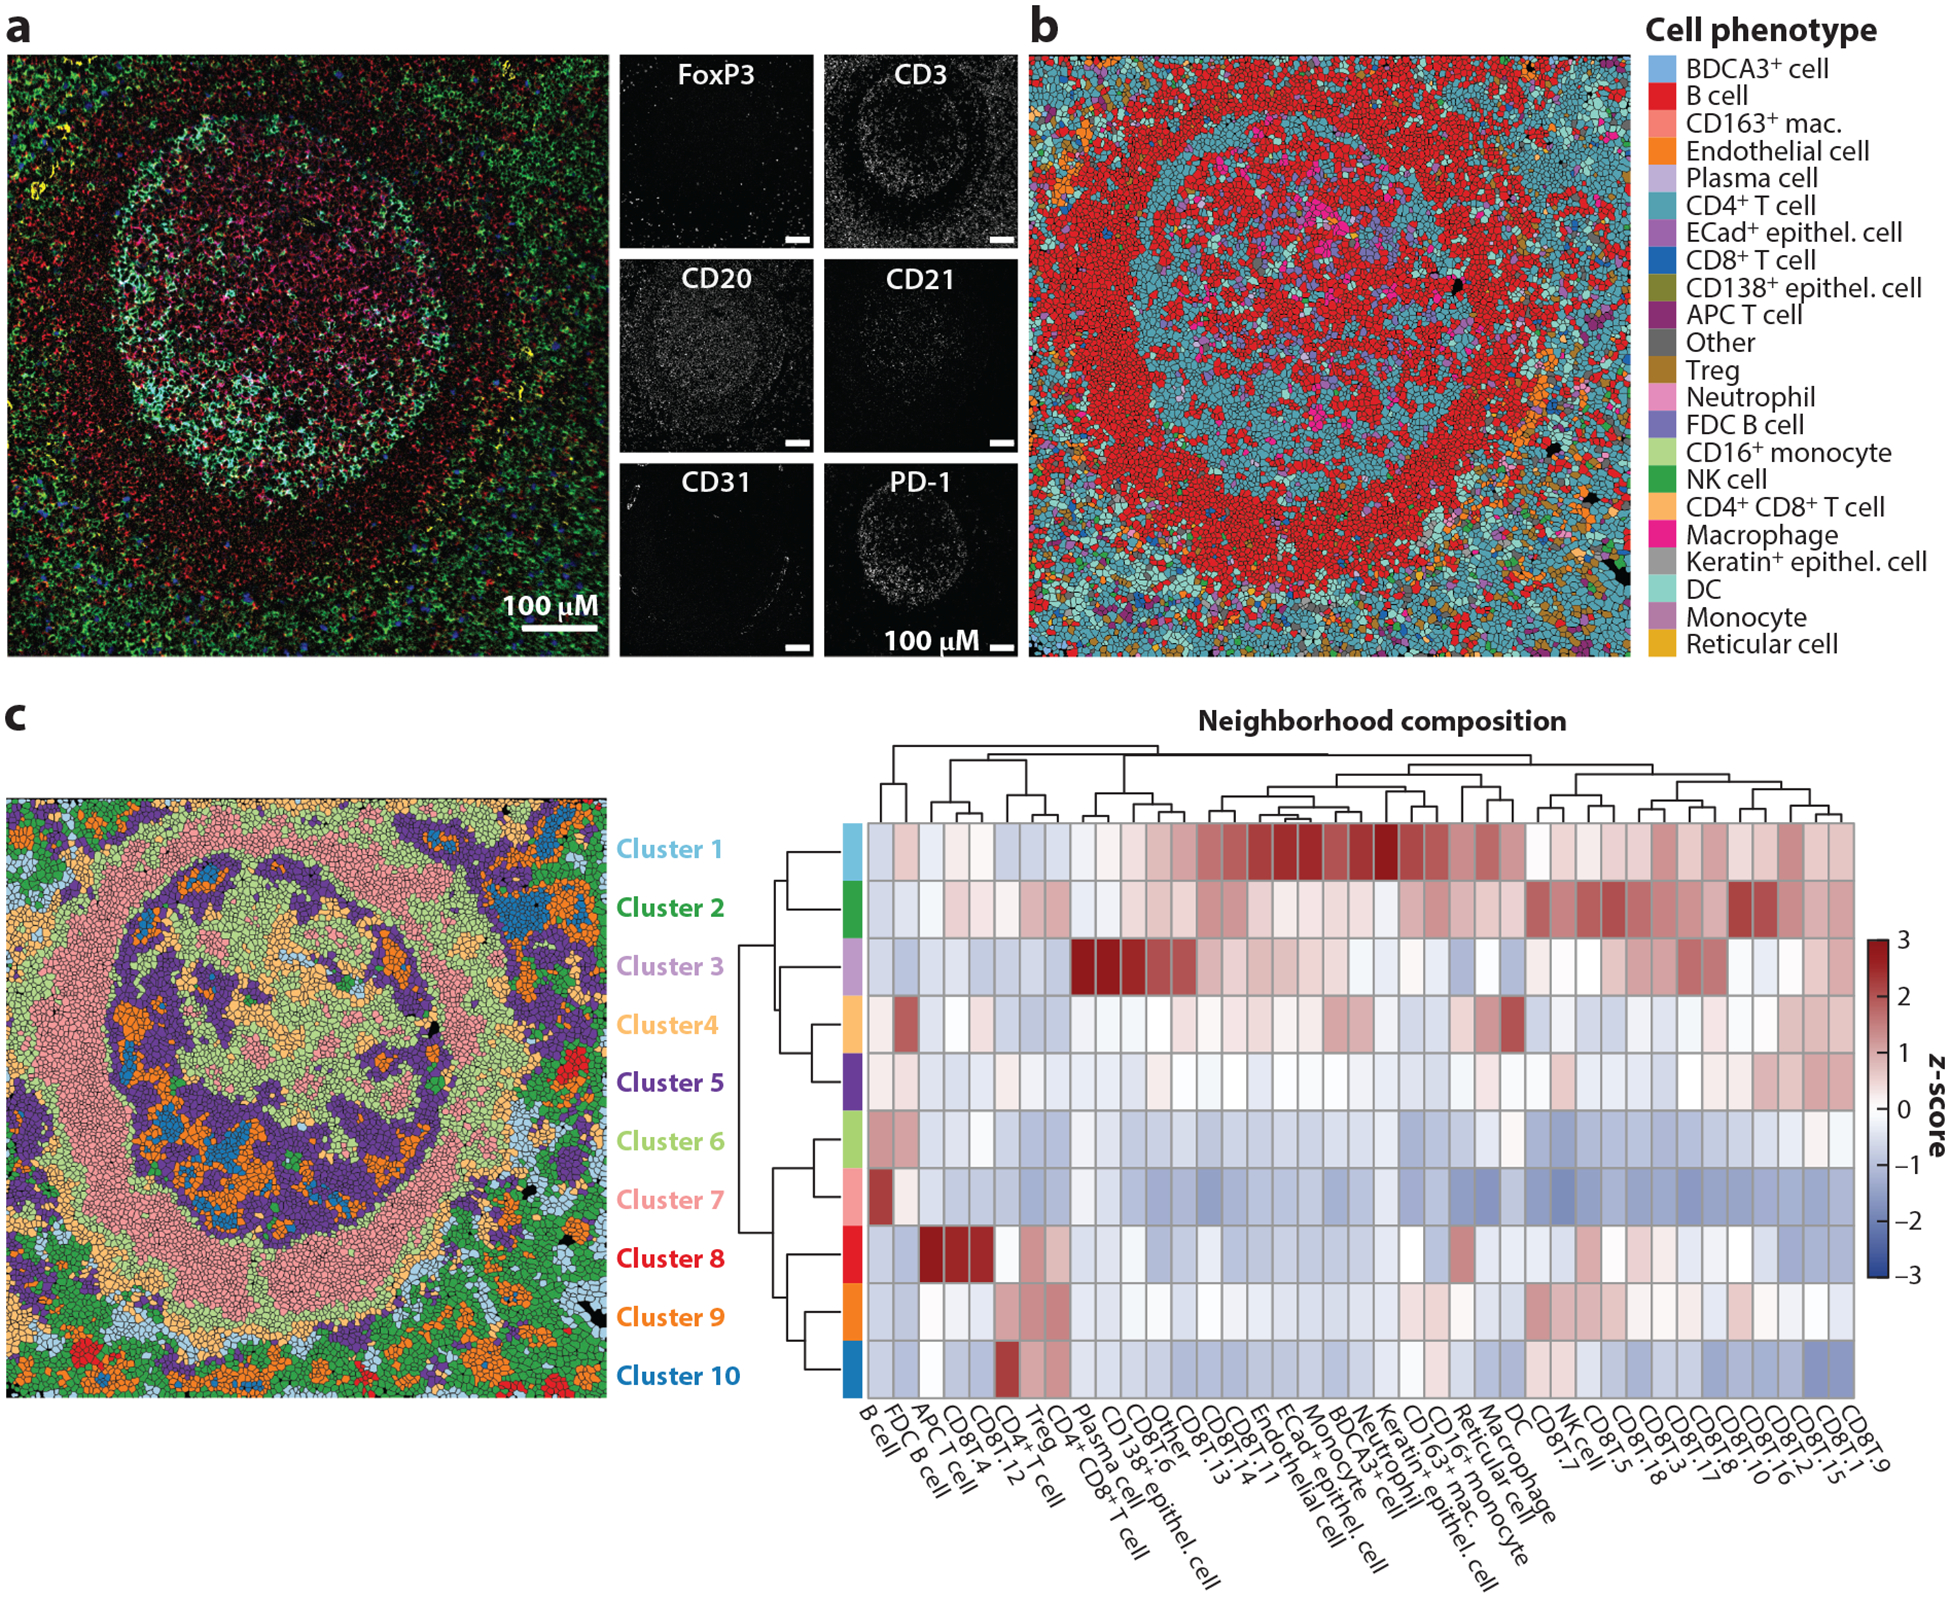
Advances in single-cell proteomics technologies have resulted in high-dimensional datasets comprising millions of cells that are capable of answering key questions about biology and disease. The advent of these technologies has prompted the development of computational tools to process and visualize the complex data. In this review, we outline the steps of single-cell and spatial proteomics analysis pipelines. In addition to describing available methods, we highlight benchmarking studies that have identified advantages and pitfalls of the currently available computational toolkits. As these technologies continue to advance, robust analysis tools should be developed in tandem to take full advantage of the potential biological insights provided by these data.

Keywords: clustering; computational methods; data analysis; mass cytometry; spatial proteomics; trajectory inference.


Figures

Figure 1
Figure 1
Overview of single-cell and spatial proteomics data generation and analysis. (a) Following proper experimental design, single-cell proteomics data are generated using a mass cytometer. Preprocessing steps (purple) include debarcoding and normalization to yield an M proteins × N cells expression matrix. After quality control and batch correction, the first steps of downstream analysis (green) are usually data visualization through dimensionality reduction and clustering. Later dataset-specific analysis steps (orange) might include differential feature analysis or trajectory inference. Single-cell proteomics datasets that include detection of posttranslational modifications often include signal transduction analysis. (b) Spatial proteomics uses a variety of techniques (our review focuses on multiplexed ion beam imaging by time-of-flight) to detect protein expression with spatial coordinates on arrayed tissue sections. Regardless of the data generation modality, cell segmentation is often the first analysis step after data preprocessing. Follow-up analysis often includes cell or pixel clustering and neighborhood analysis. Trajectory inference algorithms, either those that only use expression data or newer methods that also incorporate spatial information, can be used as well. Figure adapted from images created with BioRender.com.
Figure 2
Figure 2
Correcting for batch effects in mass cytometry data. Here, samples have been obtained from COVID-19 patients (batches 1–4) and healthy individuals (batch 5) (102). All batches were run with a reference sample. Plots are generated before (left) and after (right) batch correction using CytoNorm. (a) Density distribution of CD11c expression in the reference sample replicated across the five batches. Before batch correction, the density distribution varies between batches (e.g., see green arrow pointing to batch 3). CytoNorm removes batch effects. (b) Multidimensional scaling (MDS) plots of human samples in batches 1–5. Before batch correction, samples are generally grouping according to batch (e.g., see green arrow pointing to samples from batch 3) or individuals (see red arrow pointing to three samples from the same individual on different days from batch 1). CytoNorm removes batch effects (green dots dispersed), while preserving biological differences (i.e., samples from healthy individuals in batch 5 are still grouping together, as are samples from the same individual from batch 1).
Figure 3
Figure 3
Common clustering algorithms and dimensionality reduction techniques for single-cell proteomics data. The sample shown represents 172,948 peripheral blood immune cells from a COVID-19 patient at a single time point (102). (ac) UMAP (uniform manifold approximation and projection) dimensionality reduction colored using three clustering techniques: FlowSOM (self-organizing map) (a), PhenoGraph (b), and CLARA (Clustering Large Applications) (c). FlowSOM and CLARA require the number of clusters (k) to be specified, which was chosen here based on the expected number of immune populations. PhenoGraph requires the number of neighbors (here, the default value, k = 30, was used) to be specified rather than the number of clusters. (df) t-SNE (t-distributed stochastic neighbor embedding) dimensionality reduction colored using the same three clustering techniques as in panels ac.
Figure 4
Figure 4
MIBI-TOF data analysis and visualization methods. The sample shown represents a lymph node from a human patient. (a) MIBI-TOF image with multichannel overlay (left) and single-channel images (right). (b) MIBI-TOF image overlaid with cell phenotype assignment from clustering. (c) MIBI-TOF image overlaid with k-nearest-neighbor analysis (left) and heatmap of neighborhood composition for each cluster/neighborhood (right). CD8+ T cells were subclustered, and decimals indicate different CD8+ T cell cluster numbers. Abbreviations: APC, antigen-presenting cell; DC, dendritic cell; ECad, E-cadherin; FDC, follicular dendritic cell; mac., macrophage; MIBI-TOF, multiplexed ion beam imaging by time-of-flight; NK, natural killer; Treg, regulatory T cell. MIBI-TOF images provided by Maha Rahim and Candace Liu.
Figure 5
Figure 5
Flow chart depicting steps of MIBI-TOF and CODEX processing. Object shapes indicate the technology for which the method was developed. However, tools can be used across technology platforms, with the exception of those used for the preprocessing steps. Abbreviations: CODEX, codetection by indexing; CRC, colorectal cancer; LDA, latent Dirichlet analysis; MIBI-TOF, multiplexed ion beam imaging by time-of-flight; MPH, median pulse height; SOM, self-organizing map; TB, tuberculosis; TME, tumor microenvironment; TNBC, triple negative breast cancer.

Similar articles

Cited by

References

    1. O’Neill K, Aghaeepour N, Spidlen J, Brinkman R. 2013. Flow cytometry bioinformatics. PLOS Comput. Biol 9(12):e1003365. - PMC - PubMed
    1. Ornatsky OI, Lou X, Nitz M, Schäfer S, Sheldrick WS, et al. 2008. Study of cell antigens and intracellular DNA by identification of element-containing labels and metallointercalators using inductively coupled plasma mass spectrometry. Anal. Chem 80(7):2539–47 - PubMed
    1. Bendall SC, Simonds EF, Qiu P, Amir E-AD, Krutzik PO, et al. 2011. Single-cell mass cytometry of differential immune and drug responses across a human hematopoietic continuum. Science 332(6030):687–96 - PMC - PubMed
    1. Stoeckius M, Hafemeister C, Stephenson W, Houck-Loomis B, Chattopadhyay PK, et al. 2017. Simultaneous epitope and transcriptome measurement in single cells. Nat. Methods 14(9):865–68 - PMC - PubMed
    1. den Braanker H, Bongenaar M, Lubberts E. 2021. How to prepare spectral flow cytometry datasets for high dimensional data analysis: a practical workflow. Front. Immunol 12:768113. - PMC - PubMed

Publication types

MeSH terms