. 2023 Apr 27;186(9):1968-1984.e20.
doi: 10.1016/j.cell.2023.03.014. Epub 2023 Apr 10.

Positive selection of somatically mutated clones identifies adaptive pathways in metabolic liver disease

Affiliations

Positive selection of somatically mutated clones identifies adaptive pathways in metabolic liver disease

Zixi Wang et al. Cell. .

Abstract

Somatic mutations in nonmalignant tissues accumulate with age and injury, but whether these mutations are adaptive on the cellular or organismal levels is unclear. To interrogate genes in human metabolic disease, we performed lineage tracing in mice harboring somatic mosaicism subjected to nonalcoholic steatohepatitis (NASH). Proof-of-concept studies with mosaic loss of Mboat7, a membrane lipid acyltransferase, showed that increased steatosis accelerated clonal disappearance. Next, we induced pooled mosaicism in 63 known NASH genes, allowing us to trace mutant clones side by side. This in vivo tracing platform, which we coined MOSAICS, selected for mutations that ameliorate lipotoxicity, including mutant genes identified in human NASH. To prioritize new genes, additional screening of 472 candidates identified 23 somatic perturbations that promoted clonal expansion. In validation studies, liver-wide deletion of Tbx3, Bcl6, or Smyd2 resulted in protection against hepatic steatosis. Selection for clonal fitness in mouse and human livers identifies pathways that regulate metabolic disease.

Keywords: Gpam; Mboat7; NAFLD; NASH; Smyd2; Tbx3; chronic liver disease; fatty liver disease; in vivo screening; somatic mosaicism.


Conflict of interest statement

Declaration of interests Y.H. consults for Helio Genomics, Espervita Therapeutics, and Roche Diagnostics. Y.H. is a shareholder of Alentis Therapeutics and Espervita Therapeutics. M.H. consults for Spliceor, is on the speakers panel for Boston Scientific, and has research support from Pfizer and AstraZeneca. H.Z. consults for Alnylam Pharmaceuticals, Jumble Therapeutics, and Chroma Medicines, and serves on the SAB of Ubiquitix. H.Z. has research support from Chroma Medicines. H.Z. owns stock in Ionis and Madrigal Pharmaceuticals. M.H., H.Z., and P.C. consult for FL86 and Flagship Pioneering. M.H. and P.C. are co-inventors on patents on somatic mutants in liver disease, including ACVR2A and GPAM. Z.W., H.Z., and L.L. are co-inventors on patents on GPAM, TBX3, and SMYD2 siRNAs.

Figures
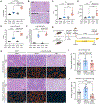
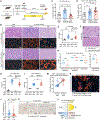
Figure 1.
Figure 1.. Mboat7 loss of function mutations, which caused lipid accumulation, led to decreased clonal fitness.
A. Liver/body weight ratios of liver-specific Mboat7 WT and KO mice fed with 1.5 months of chow or WD (n = 7, 7, 7, 8 mice for each group). These mice were given high doses of AAV8-TBG-Cre to generate liver-wide Mboat7 deletion in almost all hepatocytes. B. Representative H&E staining of Mboat7 WT and KO liver sections after 1.5 months of WD. C-D. Liver function testing with plasma AST and ALT (n = 5, 7, 7, 8 mice for each group). E-F. Cholesterol and triglyceride measurements from liver tissues (n = 6, 7, 6, 6 mice for each group). G. Schema for the mosaic Mboat7 lineage tracing experiment. LSL-tdTomato het or Mboat7f/f; LSL-tdTomato het mice were injected with a low dose of AAV8-TBG-Cre to generate mosaic Tomato+ WT hepatocytes in control mice, or Tomato+ Mboat7 mutant hepatocytes in experimental mice. These mice were then fed with either chow or WD for 4 months. Livers were collected one week after AAV8-TBG-Cre and 4 months after chow or WD was initiated. H. Representative H&E and fluorescent images of liver sections at the beginning and end of lineage tracing. I. Quantification of Tomato+ cells from LSL-tdTomato het liver sections in H (n = 7, 10, 10 mice for each group). J. Quantification of Tomato+ cells from Mboat7f/f; LSL-tdTomato het liver sections in H (n = 7, 11, 10 mice for each group). Each dot in I and J represents one image field; two fields from each mouse liver are shown. Statistical analysis in I and J were performed on averaged image data from individual mice.
Figure 2.
Figure 2.. MOSAICS platform for generating and tracing somatic mutations in vivo.
A. MOSAICS AAV delivery, gene perturbation, and sgRNA tracing. The U6-sgRNA element and CAG promoter-driven SB100-P2A-Cre fusion protein are flanked by inverted repeat (IR) sequences, enabling SB100 transposase mediated genomic integration. B. Schema for functional validation of the MOSAICS platform. The MOSAICS AAV carrying a Pten sgRNA was IV injected into dox-inducible Cas9 expressing mice (TetO-Cas9 homo; Rosa-rtTA homo) to query the generation of Pten deficient hepatocytes. The same AAV was also injected into LSL-tdTomato homo mice to test SB100-P2A-Cre fusion protein expression. C. Liver sections from the validation mice described in B. H&E and PTEN IHC staining showed that the frequency of PTEN deficient hepatocytes correlated with the amount of AAV injected. Fluorescent images of LSL-tdTomato liver sections showed that the frequency of hepatocytes expressing Tomato correlated with the amount of AAV injected. D. Quantification of Pten KO cells shown in C (n = 3 mice for each AAV concentration). E. Quantification of Tomato+ cells shown in C (n = 3 mice for each AAV concentration).
Figure 3.
Figure 3.. Lineage tracing of mosaic mutant hepatocytes demonstrated that mutations that suppress lipogenesis are positively selected in fatty livers.
A. Schema for pooled tracing of mutant clones under different dietary conditions. MOSAICS AAVs carrying sgRNA libraries were injected into Cas9 expressing mice. Ten days after gene perturbation, Cas9 was turned off by dox withdrawal, and chow or WD was given to mice for 6 months. Genomic DNA was extracted and sgRNA sequences were amplified and quantified. sgRNAs that were enriched in fatty but not in normal livers were investigated. B. sgRNAs enriched in WD but not in chow fed livers. Each circle represents one sgRNA. Different sgRNAs targeting the same genes were aligned vertically. Circle sizes correlate to −log2(p). Control sgRNAs were drawn as filled black circles. C. Genes associated with sgRNAs enriched in WD fed mice (p < 0.05). See Table S2 for raw data. D. Pathways in which the enriched genes (listed in C) are involved. E. Validation of the MOSAICS platform for the most positively selected mutations. Four non-targeting sgRNAs and the sgRNAs targeting Acvr2a, Irs1, Srebf1 and Dgat2 (Table S6) were cloned into the MOSAICS vector. The eight vectors were mixed before being used for AAV production. Cas9 mice were injected with the 8-sgRNA AAV library and treated with chow or WD for 6 months. Genomic DNA was extracted and sgRNAs were sequenced. F. Normalized sgRNA reads in chow or WD fed livers (n = 8 and 8 mice for each group). See Table S2 for raw data.
Figure 4.
Figure 4.. Gpam loss of function mutations, which suppressed lipogenesis, led to increased clonal fitness.
A. Schema for the mosaic Gpam lineage tracing experiment. LSL-tdTomato het mice or Gpamf/f; LSL-tdTomato het mice were injected with a low dose of AAV8-TBG-Cre to generate mosaic Tomato+ hepatocytes in control mice, or Tomato+ and Gpam mutant hepatocytes in experimental mice. These mice were then fed with either chow or WD for 6 months. Livers were collected one week after AAV injection and 6 months after chow or WD was initiated. B. Representative H&E and fluorescent images of liver sections at the beginning and end of lineage tracing. C. Quantification of Tomato+ cells from LSL-tdTomato het liver sections in B (n = 7, 11, 11 mice for each group). Each dot represents one image field; two fields from each mouse liver were analyzed. The same time zero group of mice was used in Figure 1I. D. Quantification of Tomato+ cells from Gpamf/f; LSL-tdTomato het liver sections in B (n = 7, 15, 15 mice for each group). Each dot represents one image field; two fields from each mouse liver were shown. Statistical analysis in C and D were performed on averaged image data from individual mice. E. Liver/body weight ratios of liver-specific Gpam WT and KO mice fed with 3 months of WD (n = 6, 16, 6, 12 mice for each group). These mice were given high doses of AAV8-TBG-Cre to generate liver-wide Gpam deletion in almost all hepatocytes. F. Representative H&E staining of Gpam WT and KO liver sections after 3 months of WD. G. NAFLD activity score of the H&E sections in F. The right panel represents the total NAFLD activity score, which is the sum of the three scores on the left (n = 13 and 14 mice for each group). H-I. Triglyceride and cholesterol measurements from liver tissues (n = 6, 16, 6, 12 for each group). J. Quantification of Ki67+ hepatocytes from liver sections of Gpam WT and KO mice fed with 3 months of WD (n = 10 and 11). Each dot represents one image field; three fields from each mouse liver were analyzed. Statistical analysis was performed on averaged image data from individual mice. K. Representative Ki67 IHC staining of Gpam WT and KO liver sections after 3 months of WD. L. Distribution of Ki67+ hepatocytes in the portal vein (PV) half and central vein (CV) half of the lobule. M. Quantification of Ki67+ hepatocytes from IF staining of Gpam mosaic liver sections from B (n = 7). 60-130 Ki67+/HNF4a+ nuclei were counted per liver depending on the abundance of Ki67+ nuclei in each liver section. In each randomly selected area that was analyzed, all Ki67+ nuclei were counted. The percentage of Tomato-/Ki67+/HNF4a+ nuclei and Tomato+/Ki67+/HNF4a+ nuclei per unit area were calculated. The sum of these two groups of nuclei was defined as 100%. N. Representative IF co-staining of Tomato, Ki67, and HNF4a in Gpam mosaic liver sections from B.
Figure 5.
Figure 5.. Somatic mosaic screening of transcription and epigenetic factors identified putative therapeutic targets for NASH.
A. Results for transcription factor screening. MOSAICS vectors carrying transcription factor targeting sgRNA libraries were injected into Cas9 expressing mice. Chow or WD was fed to mice for 6 months. The genes corresponding to enriched sgRNAs in WD fed but not chow fed livers were drawn as colored circles with sizes correlating to −log2(p). Control sgRNAs were drawn as filled black circles. B. Results for epigenetic factor screening. The methods and color scheme are the same as in A. C. List of the genes corresponding to enriched sgRNAs (p < 0.05) in both MOSAICS screens. D. How we assess KO phenotypes of the top genes under WD conditions. A MOSAICS AAV carrying an individual sgRNA was injected into Cas9 mice such that each mouse had one gene deleted in the liver. Dox was withdrawn 10 days after AAV injection and WD was given for 3 months before sacrifice. E-F. Body weight and liver/body ratios of control (sgGFP and sgLacZ) and liver-specific KO mice fed with 3 months of WD. Gray dots represent control mice, blue dots represent liver-specific KO mice for known NASH genes, red dots represent transcription factor KO mice, and green dots represent epigenetic factor KO mice. Darker dots represent mice that have the most significant differences in liver/body weight ratios. Each dot represents one mouse, and the n is denoted at the bottom of each plot. G. Liver function testing using plasma ALT. The color scheme is the same as in E. The n is denoted at the bottom of the plot. H-I. Liver triglyceride and cholesterol analysis. J. Representative H&E images of liver sections are shown for the mice described in E.
Figure 6.
Figure 6.. Transcriptional analysis of Irs1, Srebf1, Bcl6, Tbx3, and Smyd2 KO livers after WD.
A. The number of genes with altered expression in the RNA-seq data when comparing control (sgGFP and sgLacZ) and KO livers after 3 months of WD. Darker and lighter colored bars represent the number of differentially expressed genes with a fold change of >=2 and >=1.5, respectively. Genes with statistically significant fold change differences of less than 1.5 were not included here. B. Venn diagram showing the shared and unique gene numbers with changed expression (fold change >=1.5) in Bcl6, Tbx3, and Irs1 KO livers. C. Venn diagram showing the shared and unique gene numbers with changed expression (fold change >=1.5) in Bcl6, Tbx3, and Srebf1 KO livers. D. Hallmark pathway enrichment analysis of RNA-seq data from A. E. Heatmaps showing the fold changes of differentially expressed genes in fatty acid, triglyceride, and cholesterol synthesis pathways. The average expression levels of control samples (four sgGFP and two sgLacZ) were normalized to 1 for each gene. F. Heatmaps showing the fold changes of differentially expressed genes in β-oxidation and TCA cycle pathways. The normalization method is the same as in E. G. Heatmaps showing the fold changes of differentially expressed collagen genes. The normalization method is the same as in E.
Figure 7.
Figure 7.. AZ505, a selective SMYD2 inhibitor, ameliorated fatty liver disease.
A. Pre-clinical testing of AZ505 in NASH models. WD or chow was given at 8 weeks of age for 2 months. AZ505 treatment started one day after WD or chow was initiated. Vehicle (2.5% DMSO in saline) or AZ505 (10 mg/kg) was given to mice intraperitoneally 3 times per week. B-D. Body weight, liver weight and liver/body weight ratios of vehicle or AZ505 treated mice before and after 2 months of WD or chow (n = 15 and 14 mice on WD, light gray and red bars; n = 11 and 10 mice on chow, dark gray and purple bars). E-F. Representative liver pictures and H&E of liver sections for vehicle or AZ505 treated mice after 2 months of WD or chow. G-H. Liver function analysis using plasma ALT and AST (n = 15 and 14 mice on WD; n = 11 and 10 mice on chow). I-J. Plasma triglyceride and cholesterol analysis (n = 15 and 14 mice on WD; n = 11 and 10 mice on chow). K-L. Liver triglyceride and cholesterol analysis of the mice on WD (n = 15 and 14).

Update of

Comment in

References

    1. Martincorena I, and Campbell PJ (2015). Somatic mutation in cancer and normal cells. Science 349, 1483–1489. 10.1126/science.aab4082. - DOI - PubMed
    1. Brunner SF, Roberts ND, Wylie LA, Moore L, Aitken SJ, Davies SE, Sanders MA, Ellis P, Alder C, Hooks Y, et al. (2019). Somatic mutations and clonal dynamics in healthy and cirrhotic human liver. Nature 574, 538–542. 10.1038/s41586-019-1670-9. - DOI - PMC - PubMed
    1. Zhu M, Lu T, Jia Y, Luo X, Gopal P, Li L, Odewole M, Renteria V, Singal AG, Jang Y, et al. (2019). Somatic mutations increase hepatic clonal fitness and regeneration in chronic liver disease. Cell 177, 608–621.e12. 10.1016/j.cell.2019.03.026. - DOI - PMC - PubMed
    1. Lawson ARJ, Abascal F, Coorens THH, Hooks Y, O’Neill L, Latimer C, Raine K, Sanders MA, Warren AY, Mahbubani KTA, et al. (2020). Extensive heterogeneity in somatic mutation and selection in the human bladder. Science 370, 75–82. 10.1126/science.aba8347. - DOI - PubMed
    1. Diehl AM, and Day C (2017). Cause, pathogenesis, and treatment of nonalcoholic steatohepatitis. N. Engl. J. Med 377, 2063–2072. 10.1056/NEJMra1503519. - DOI - PubMed

Publication types

Substances