. 2023 May 8;58(9):727-743.e11.
doi: 10.1016/j.devcel.2023.03.011. Epub 2023 Apr 10.

Understanding cell fate acquisition in stem-cell-derived pancreatic islets using single-cell multiome-inferred regulomes

Affiliations

Understanding cell fate acquisition in stem-cell-derived pancreatic islets using single-cell multiome-inferred regulomes

Han Zhu et al. Dev Cell. .

Abstract

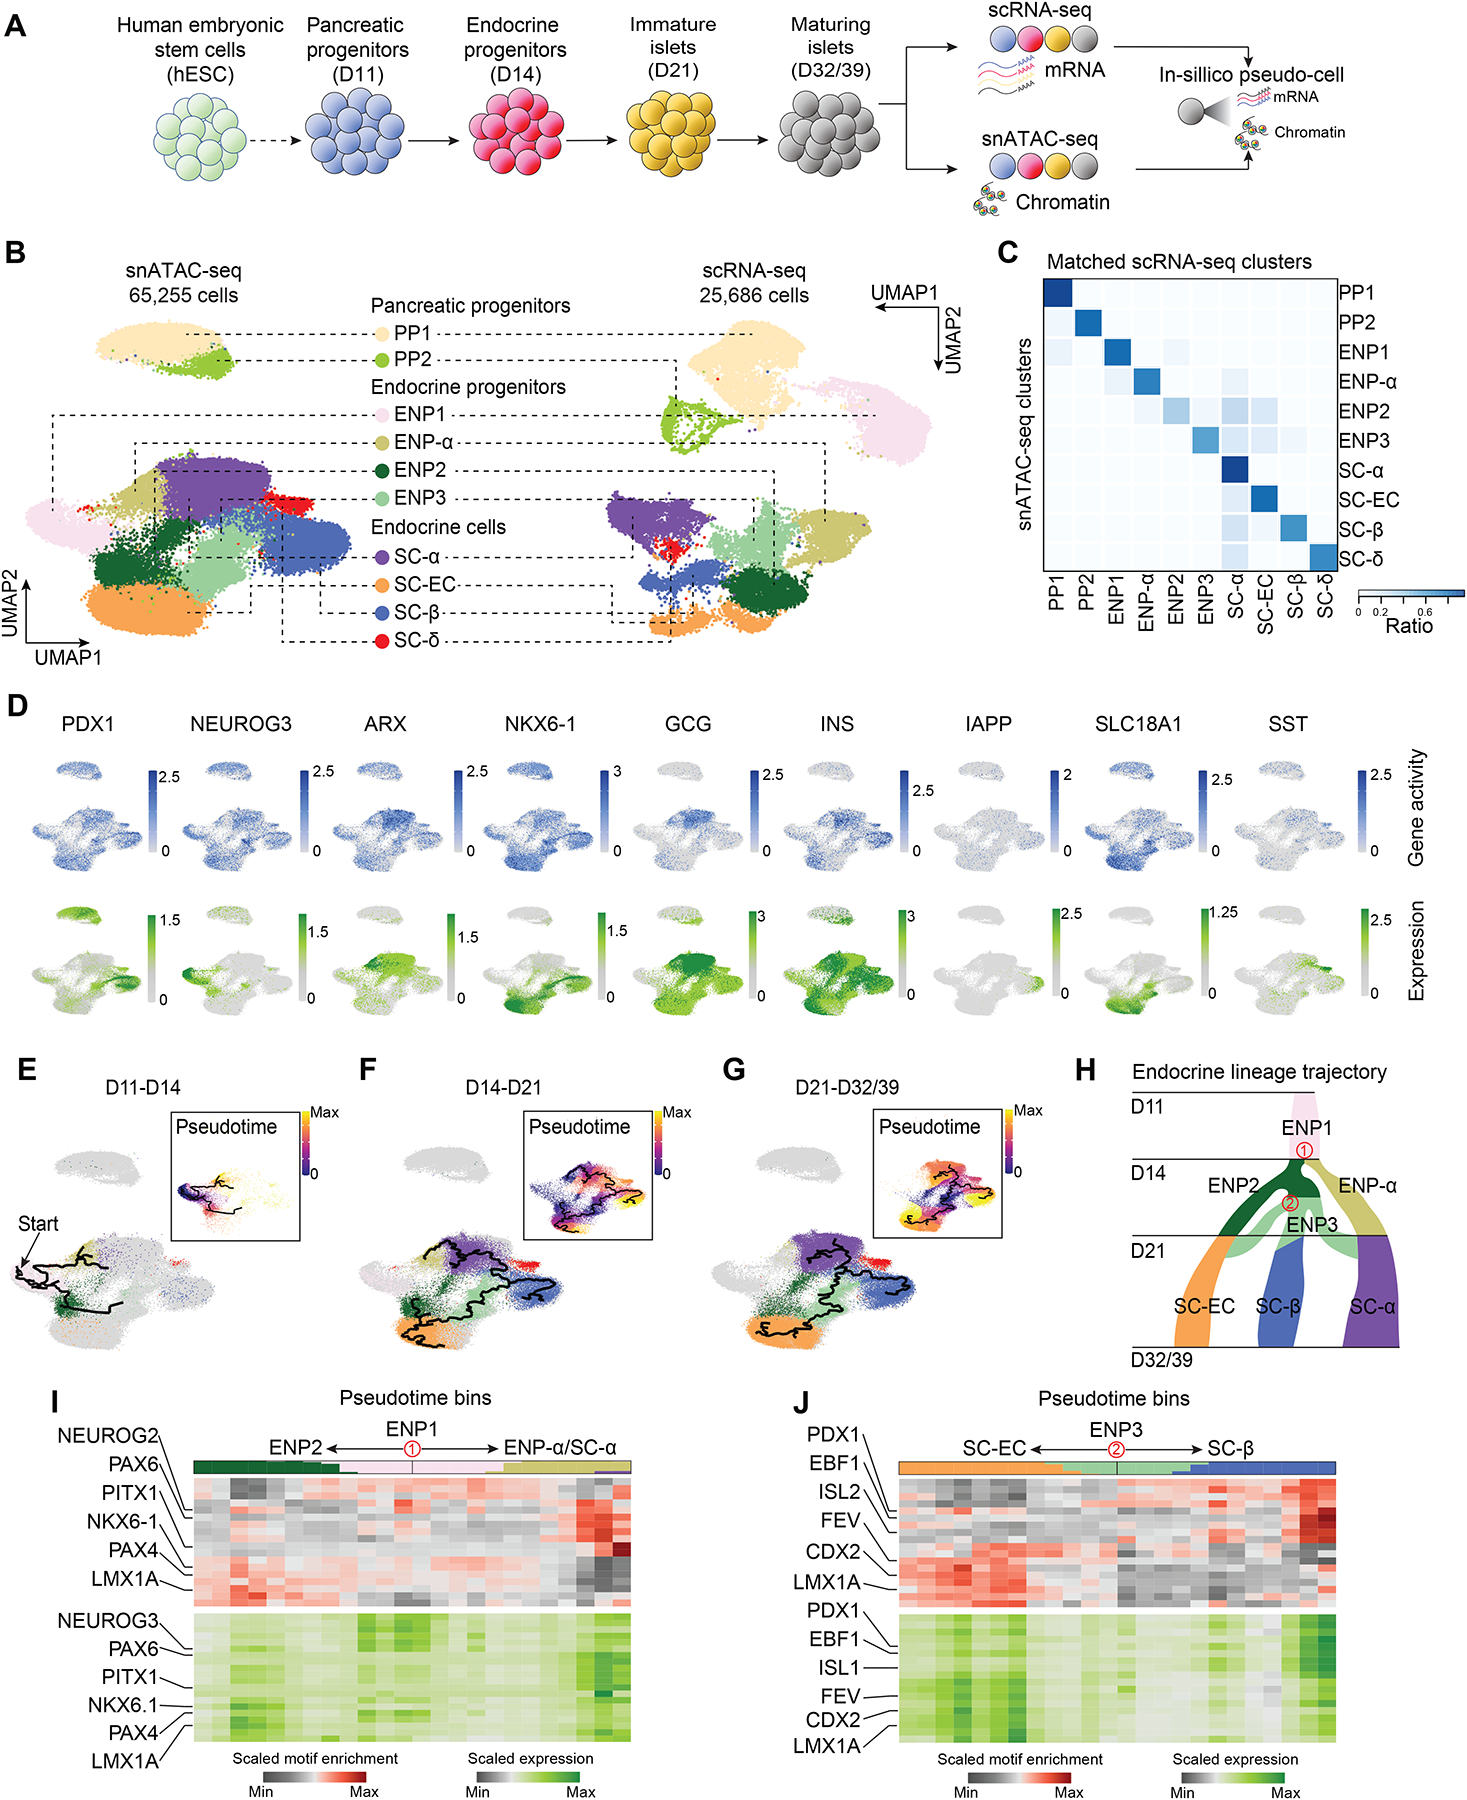
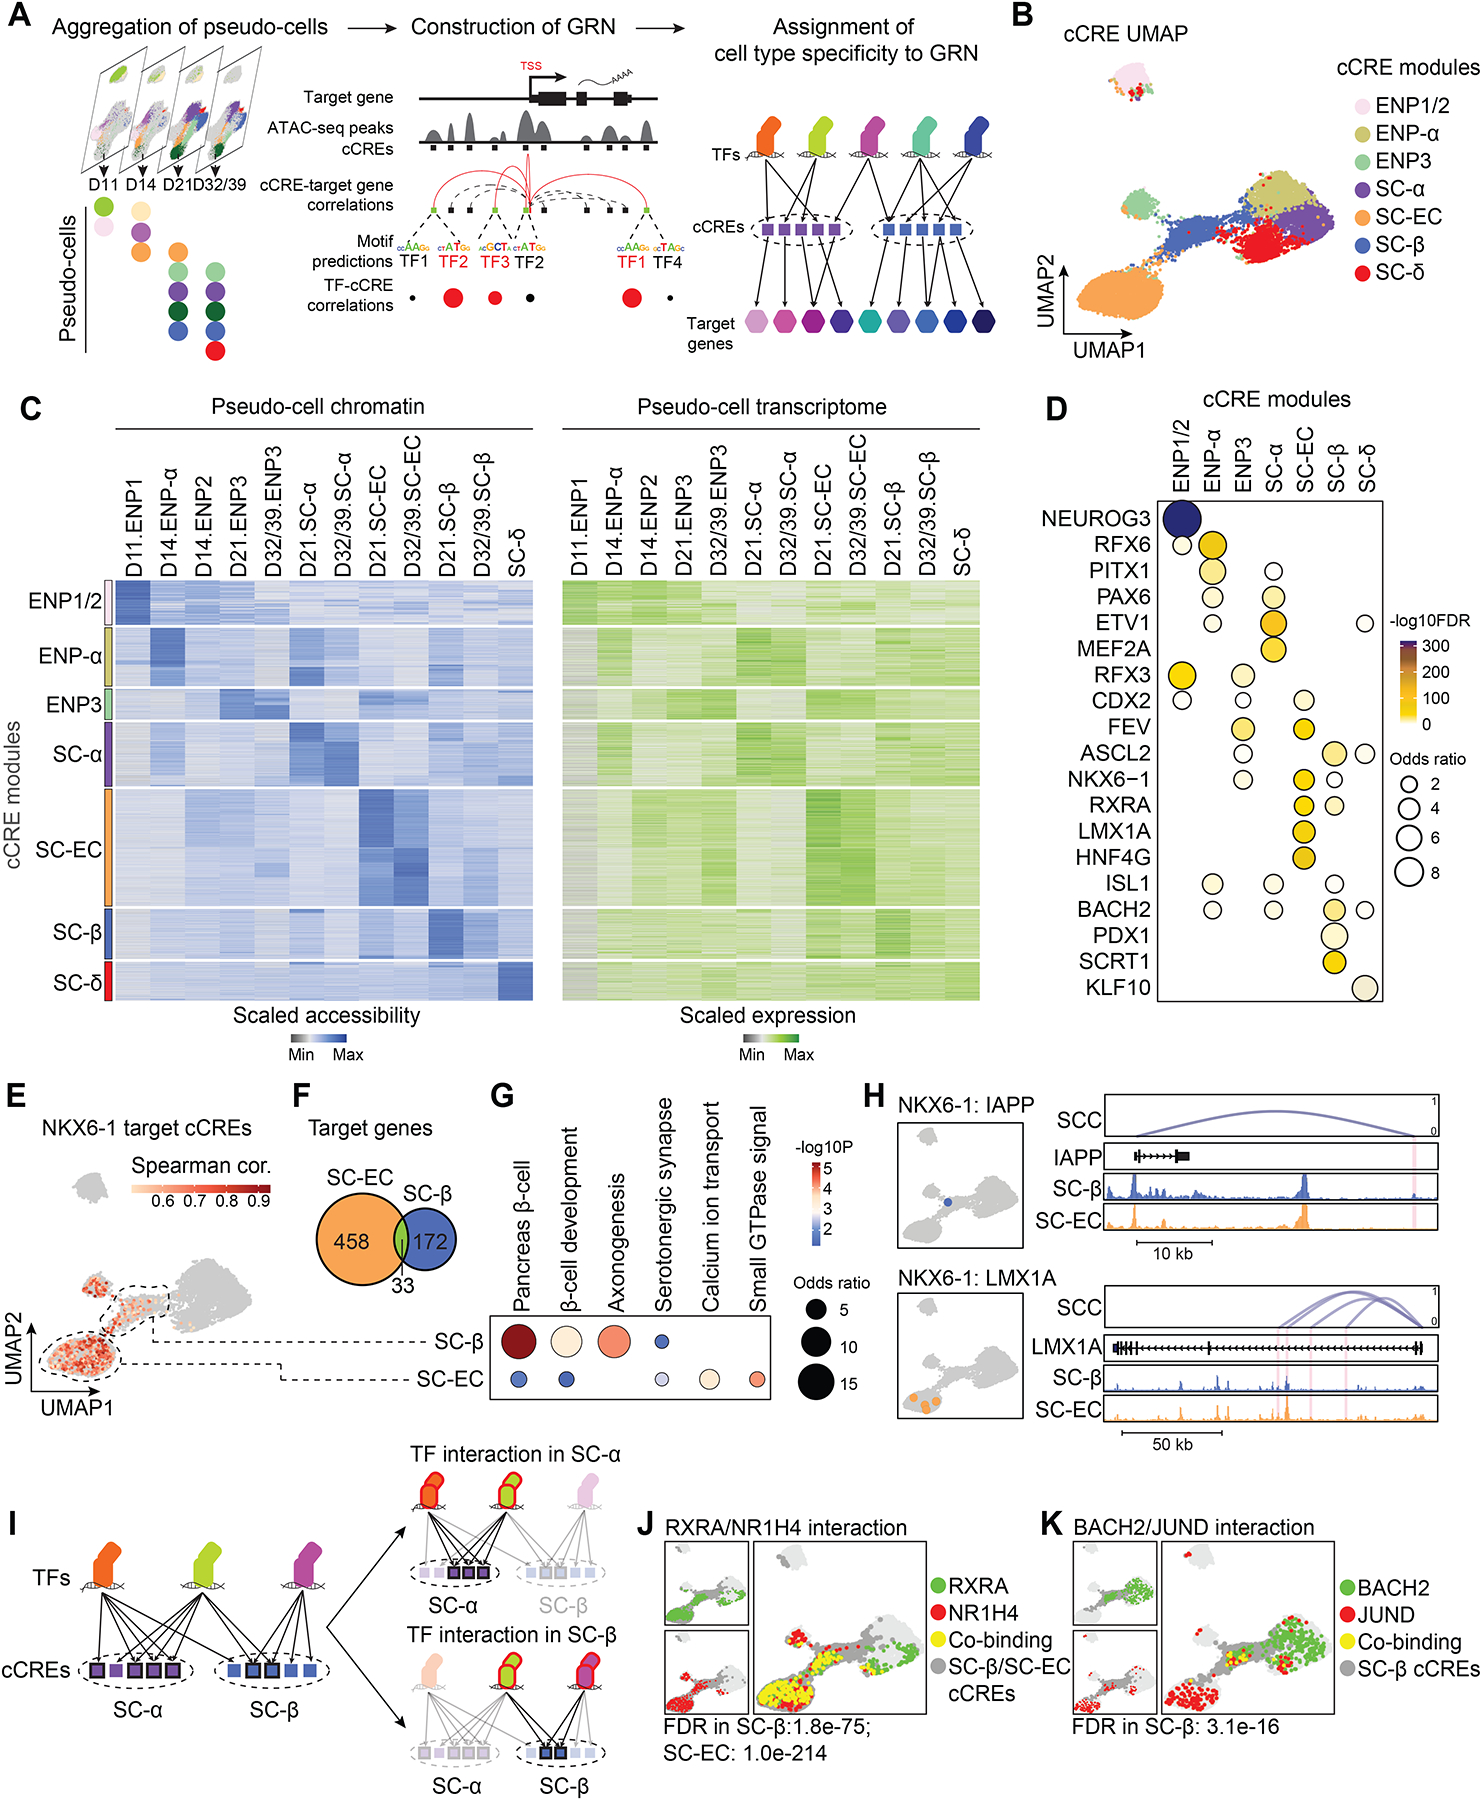
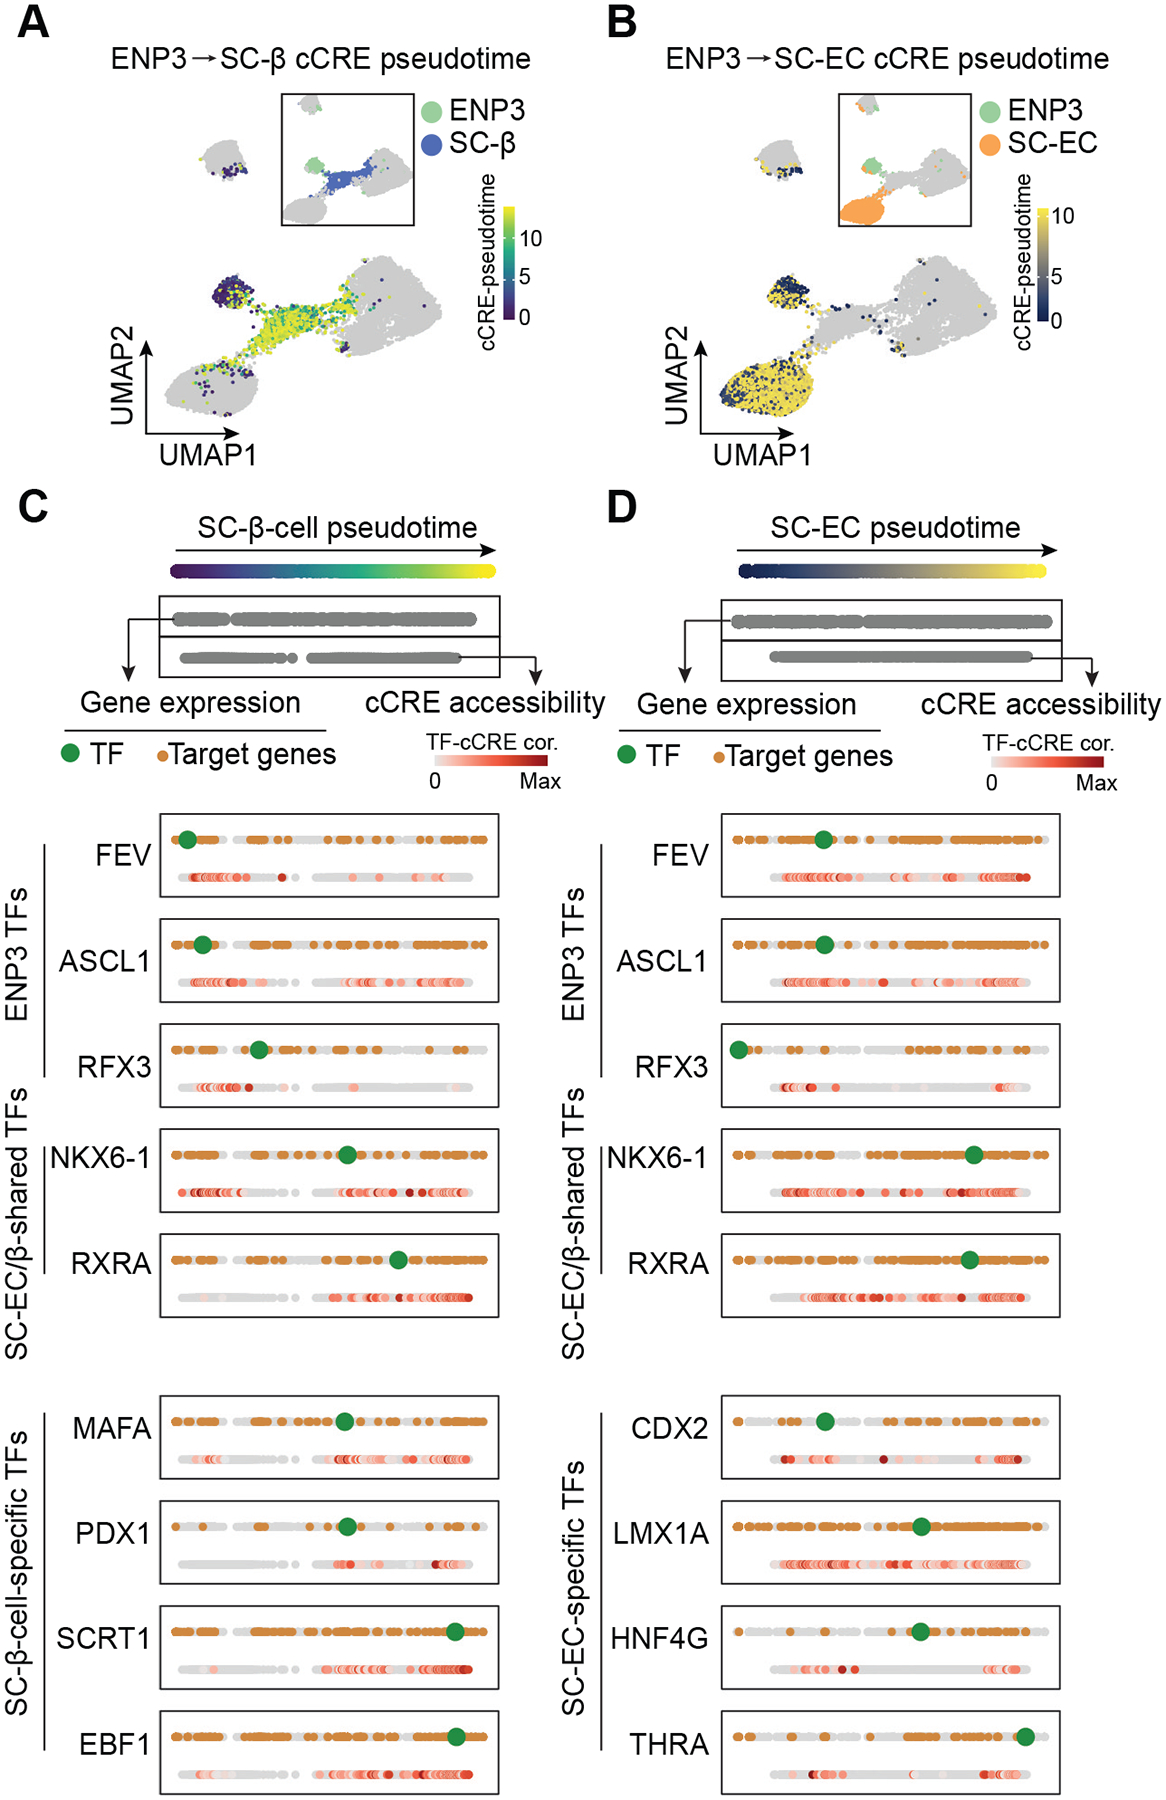
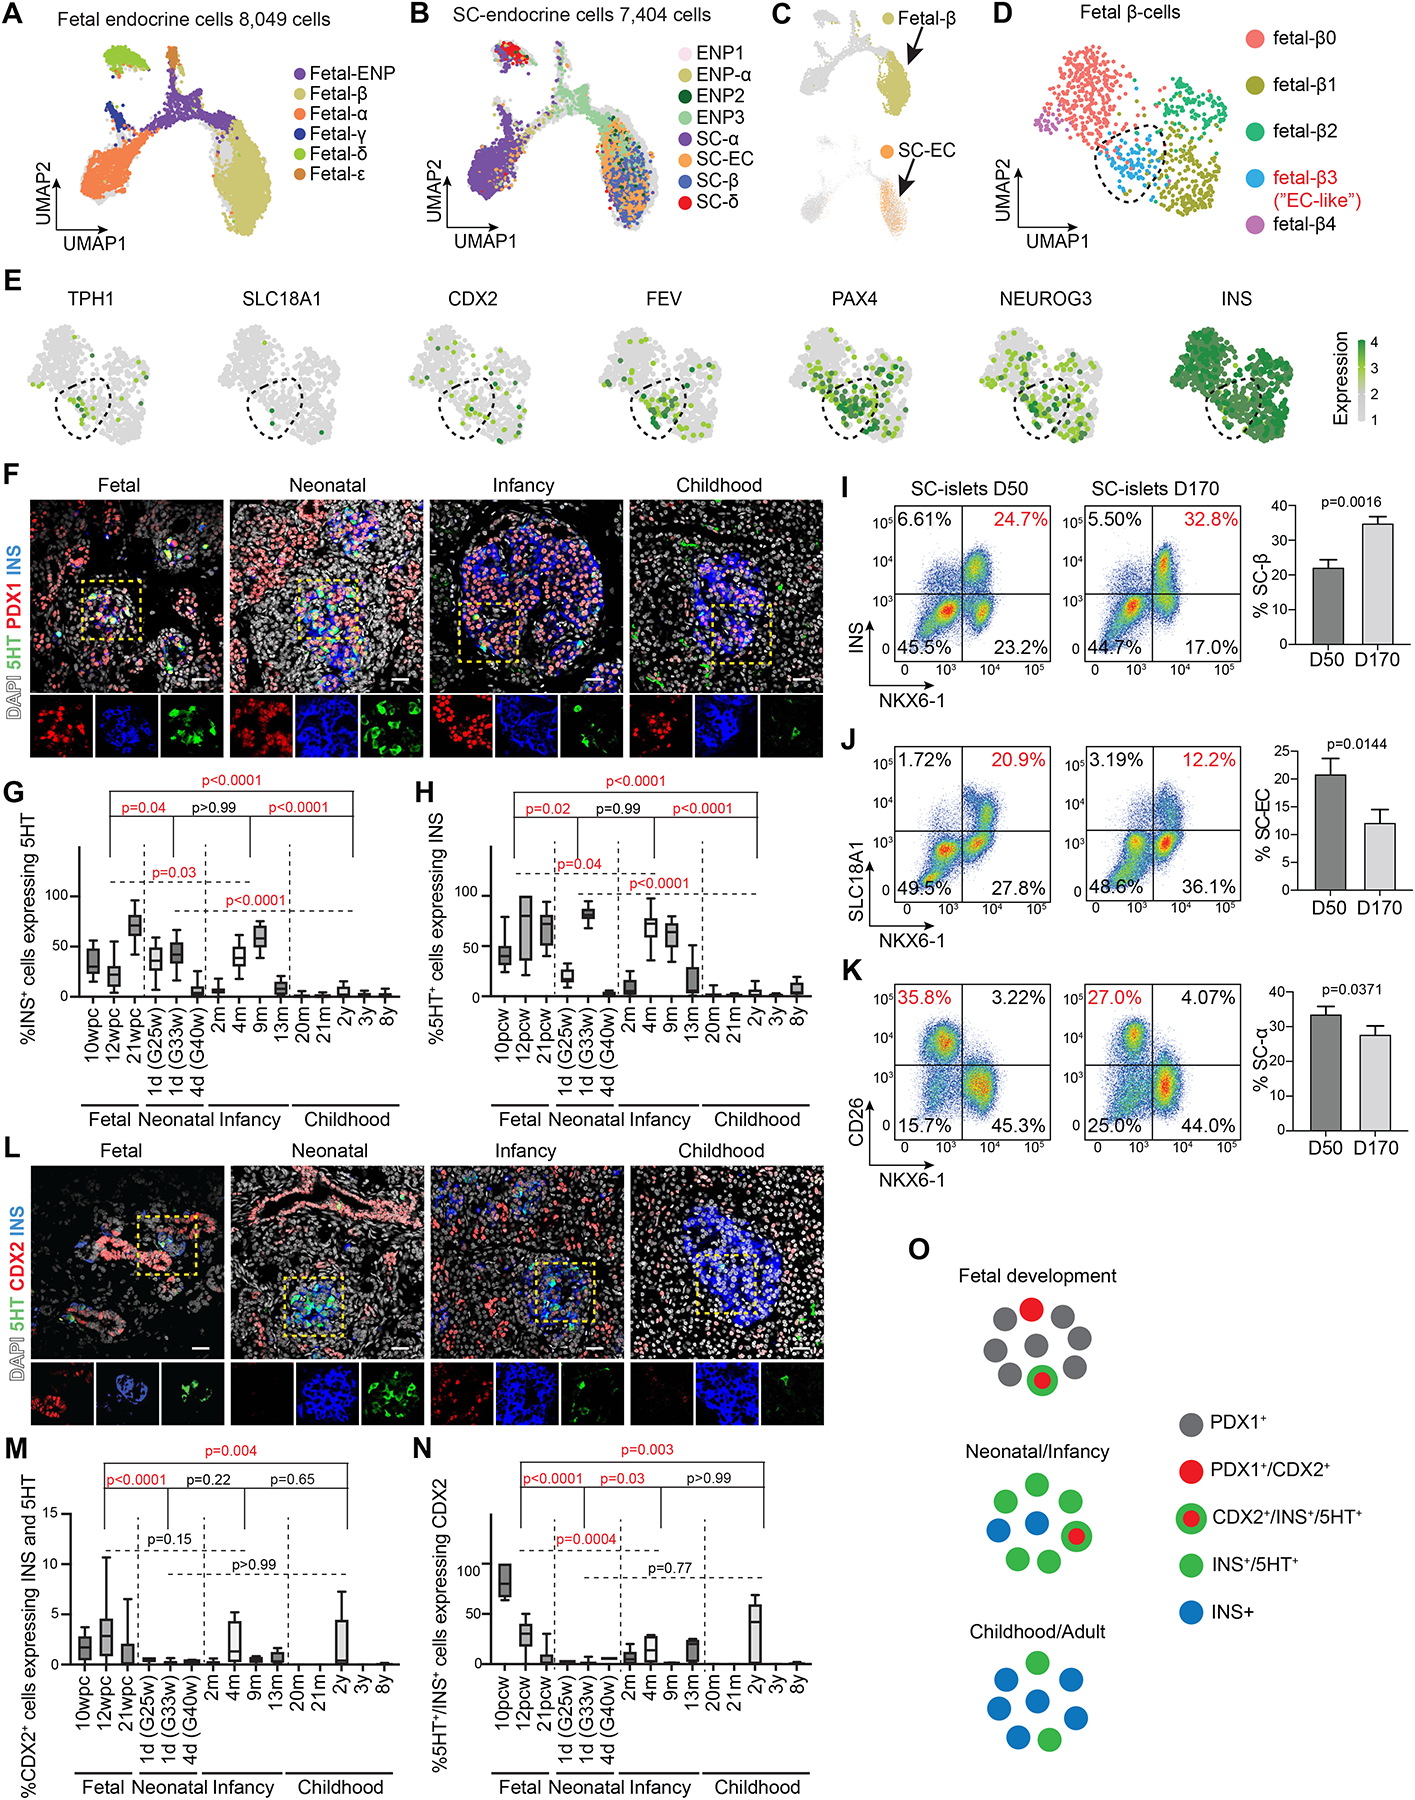
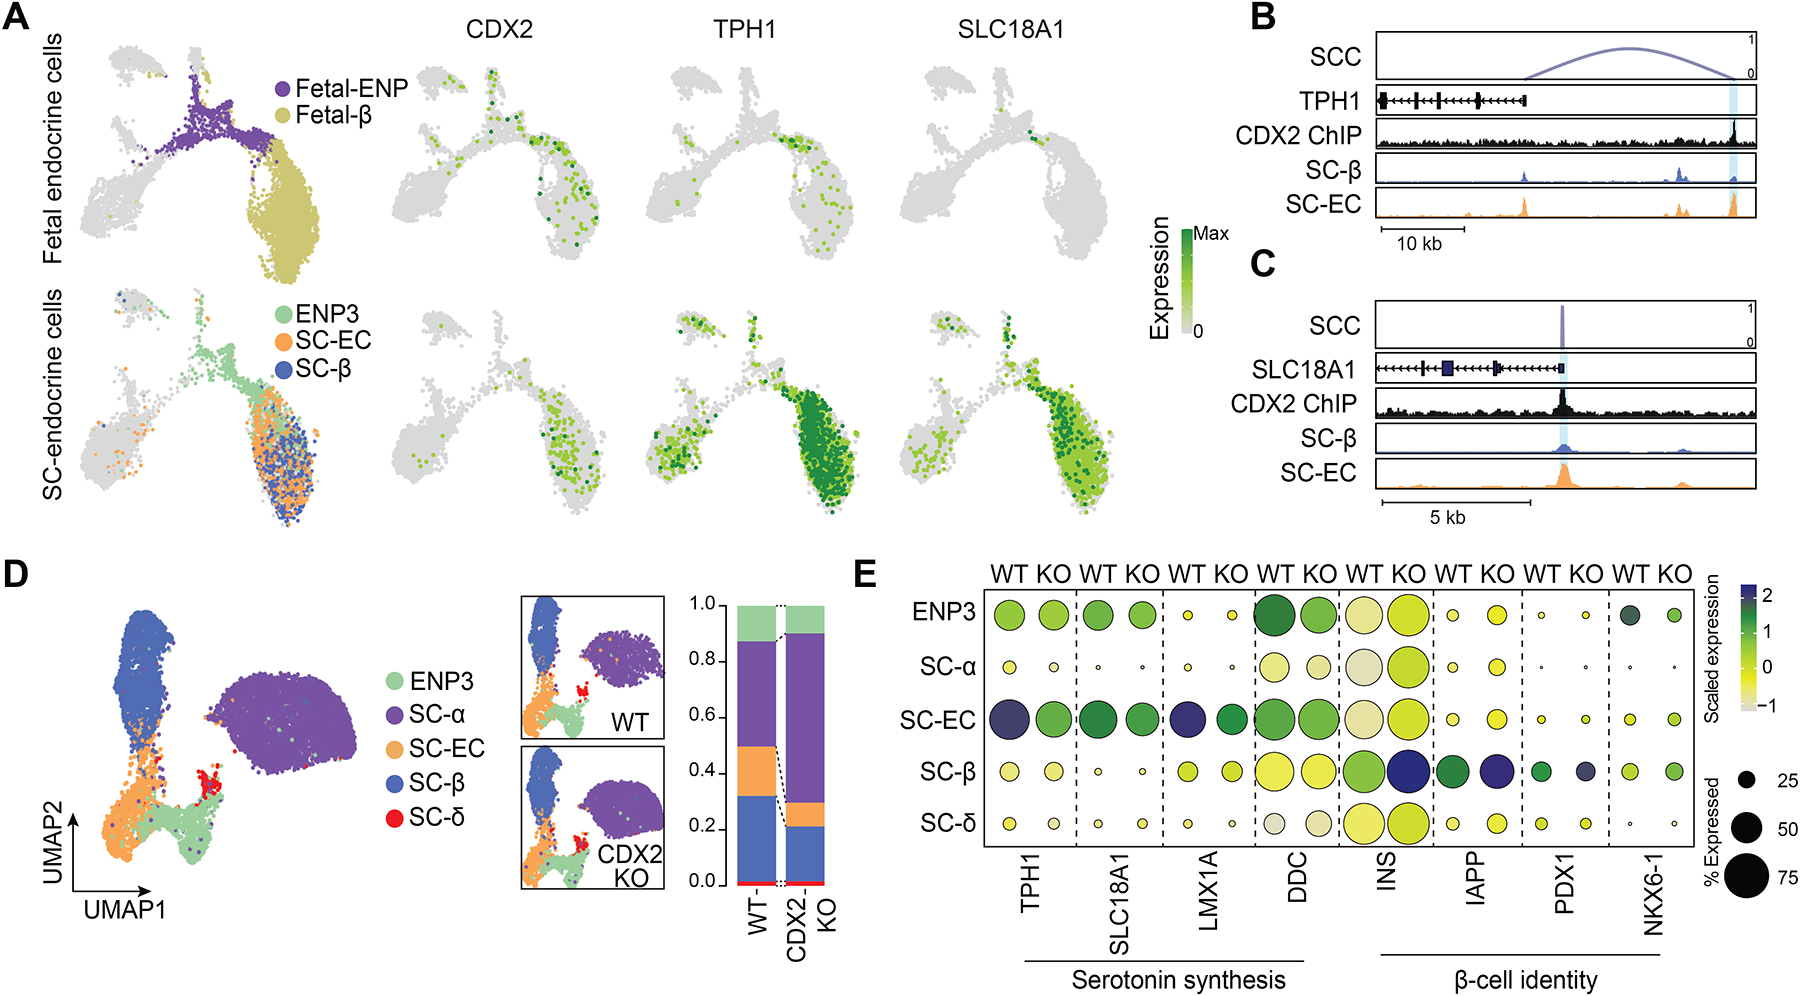
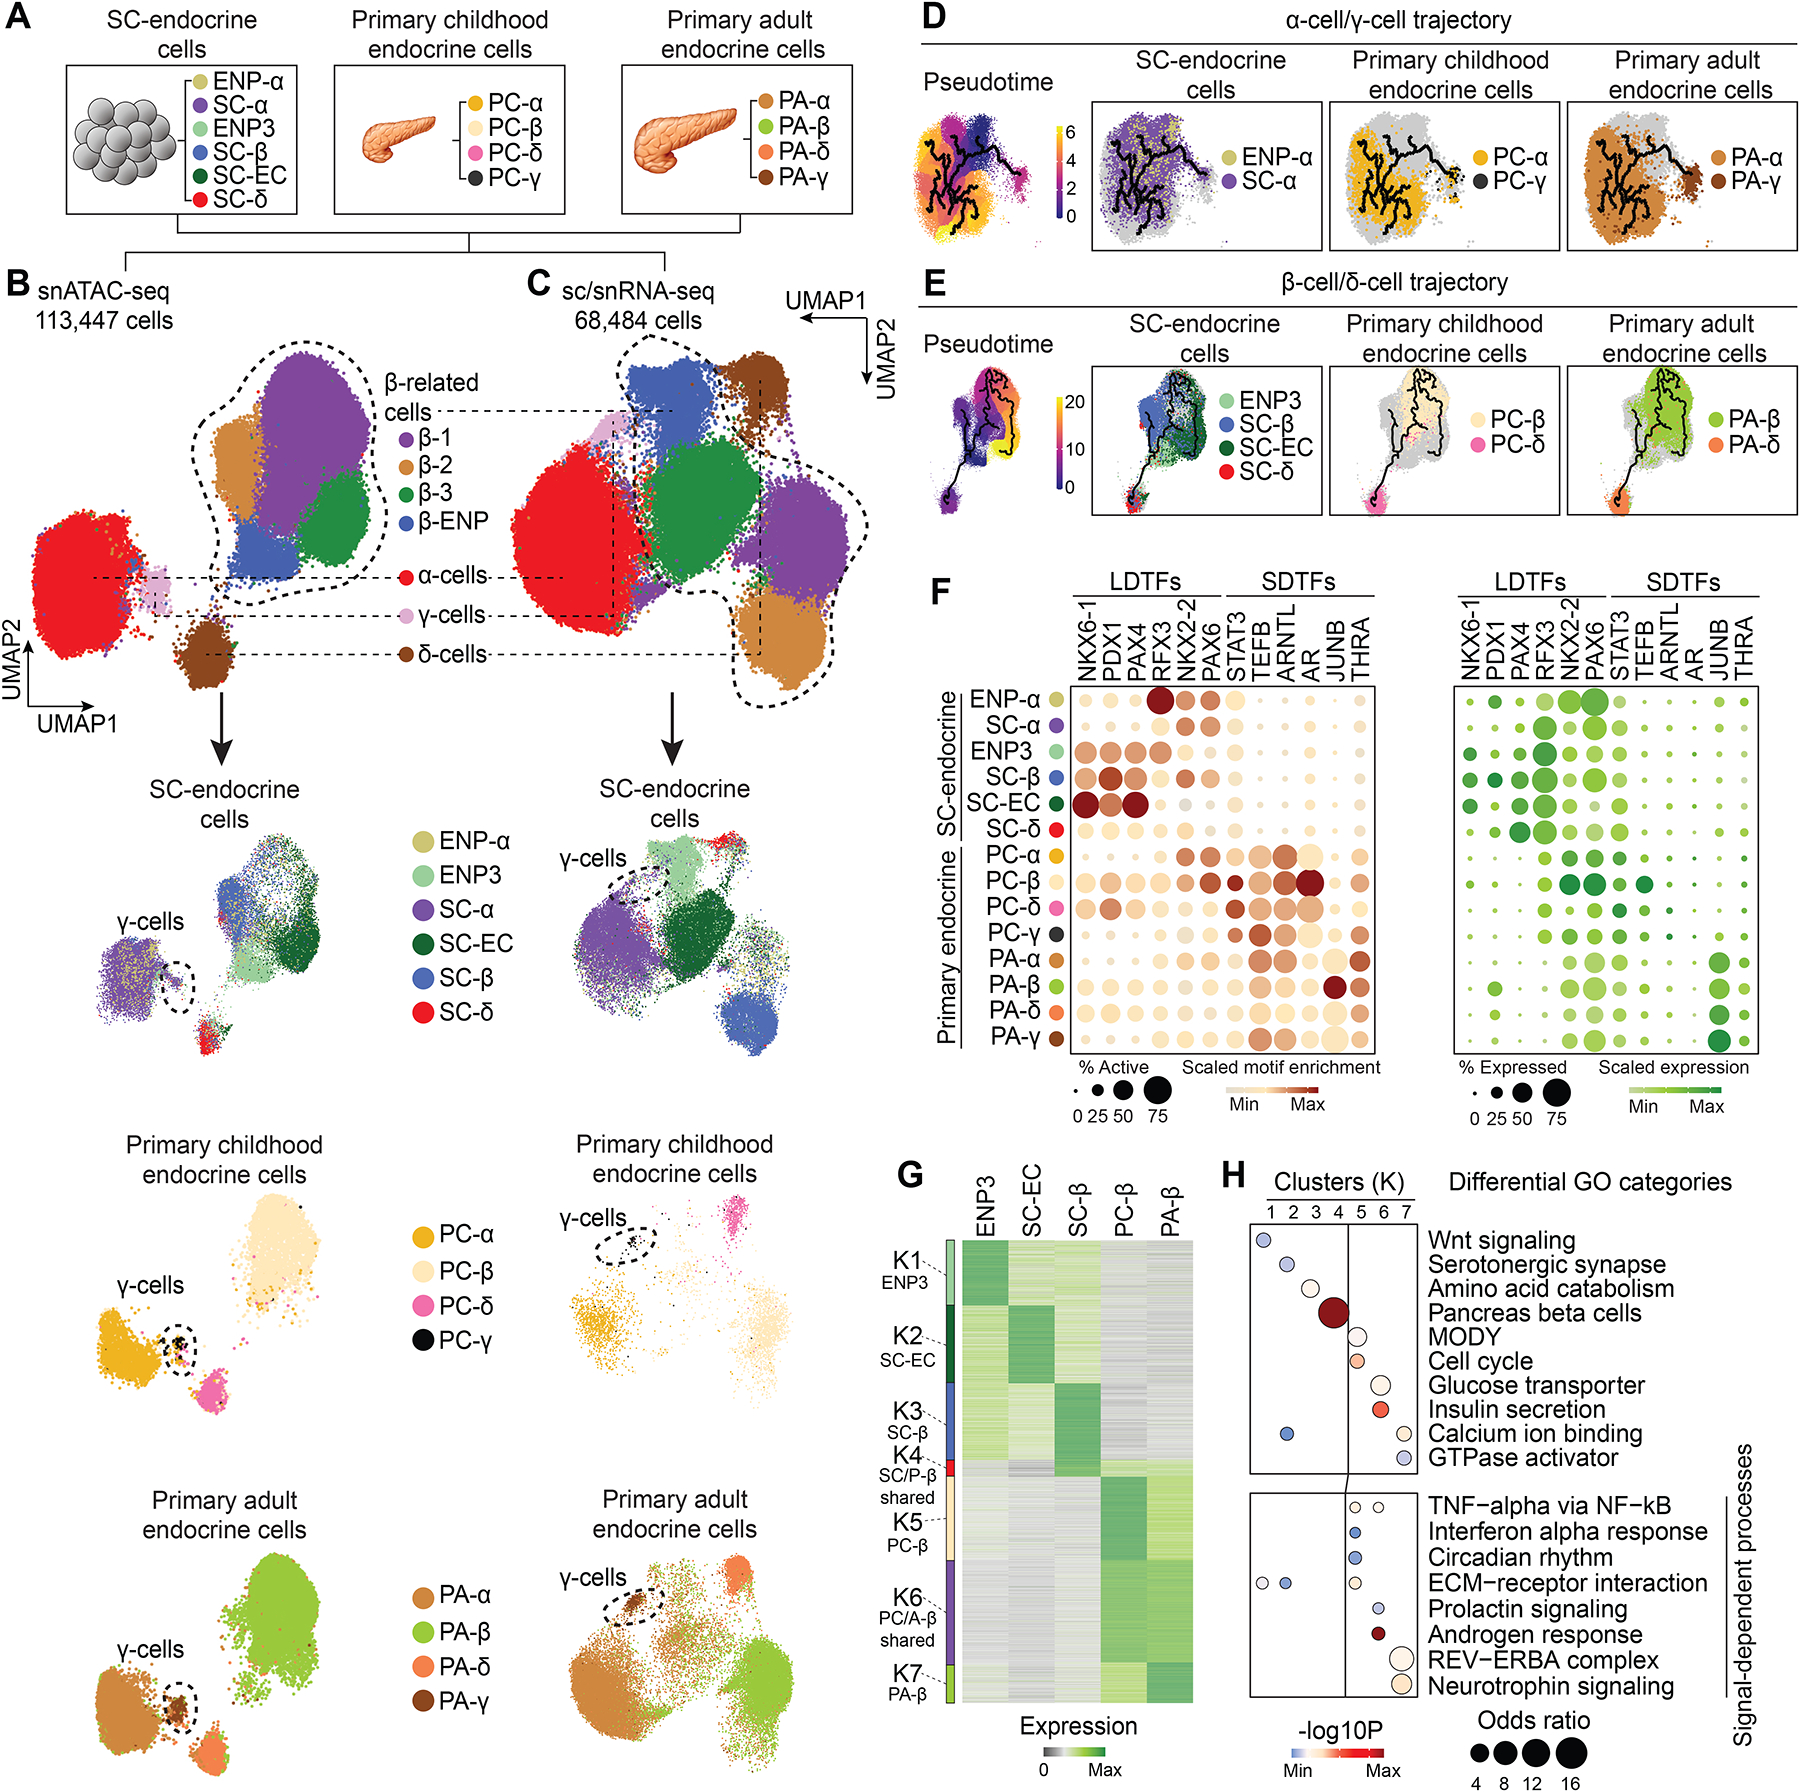
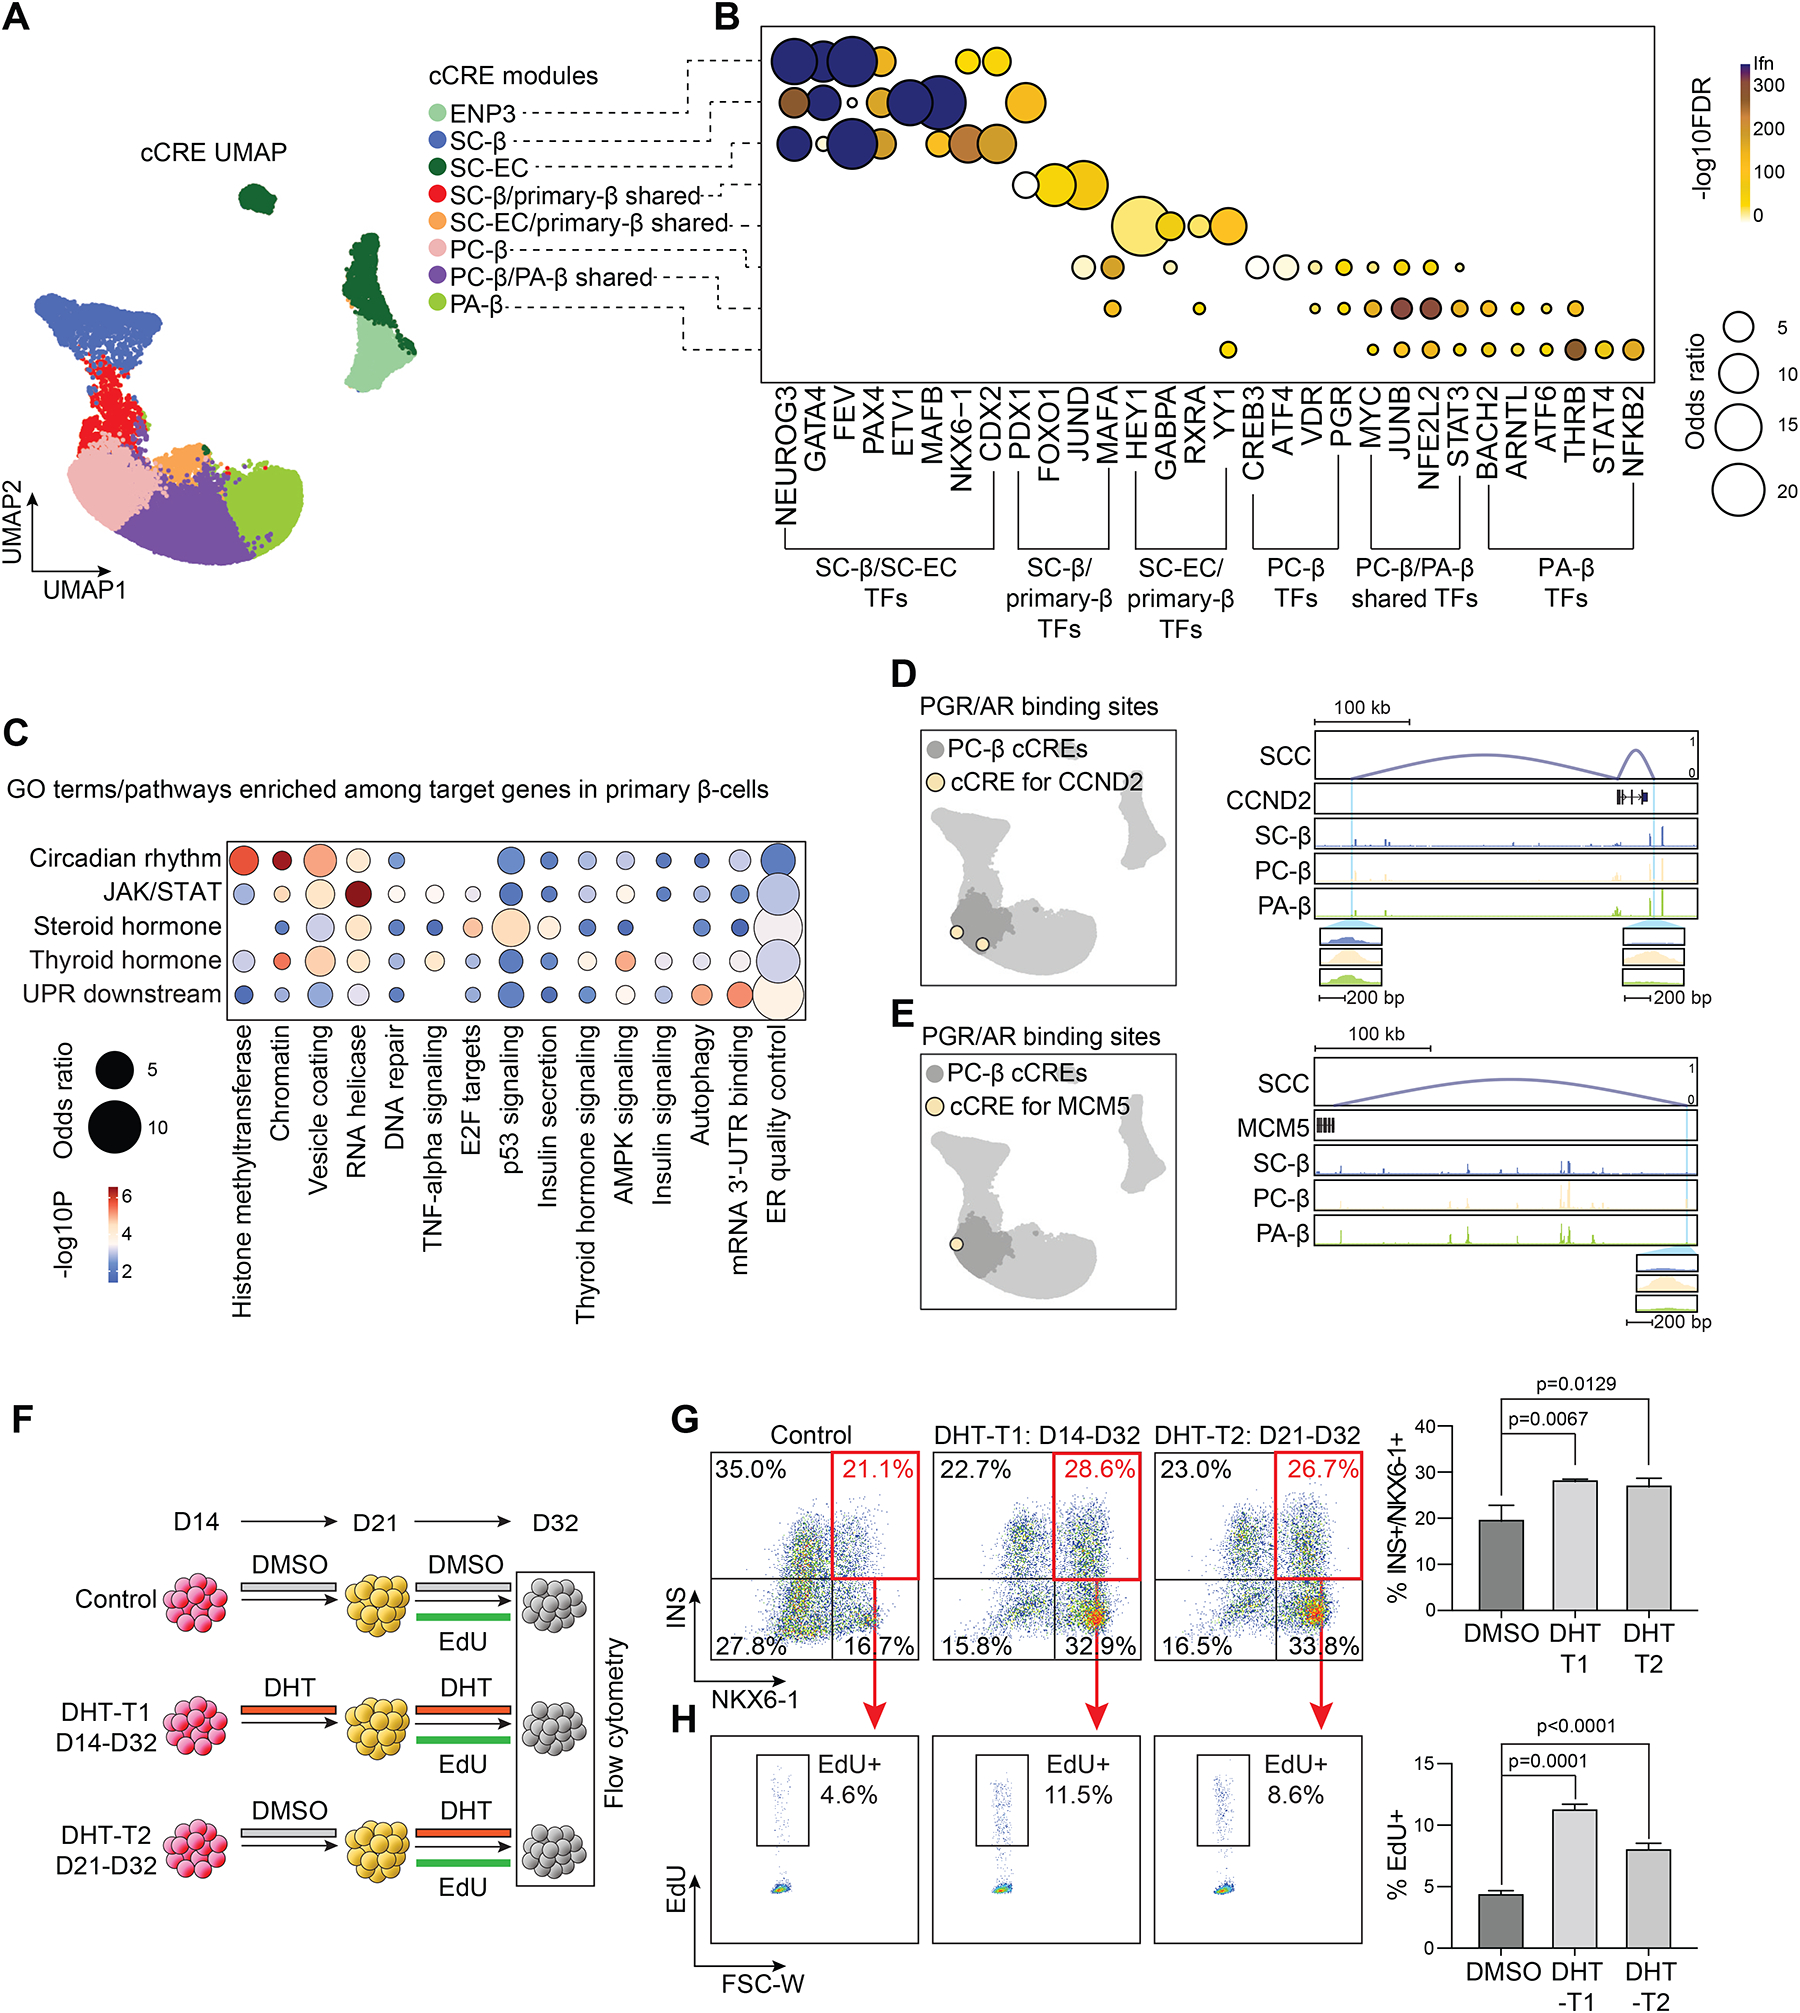
Pancreatic islet cells derived from human pluripotent stem cells hold great promise for modeling and treating diabetes. Differences between stem-cell-derived and primary islets remain, but molecular insights to inform improvements are limited. Here, we acquire single-cell transcriptomes and accessible chromatin profiles during in vitro islet differentiation and pancreas from childhood and adult donors for comparison. We delineate major cell types, define their regulomes, and describe spatiotemporal gene regulatory relationships between transcription factors. CDX2 emerged as a regulator of enterochromaffin-like cells, which we show resemble a transient, previously unrecognized, serotonin-producing pre-β cell population in fetal pancreas, arguing against a proposed non-pancreatic origin. Furthermore, we observe insufficient activation of signal-dependent transcriptional programs during in vitro β cell maturation and identify sex hormones as drivers of β cell proliferation in childhood. Altogether, our analysis provides a comprehensive understanding of cell fate acquisition in stem-cell-derived islets and a framework for manipulating cell identities and maturity.

Keywords: ATAC-seq; CDX2; RNA-seq; development; fetal pancreas; gene regulatory network; human pluripotent stem cells; islets; pancreas; serotonin; signals; single-cell genomics; transcription factors; β cell.


Conflict of interest statement

Declaration of interests K.J.G. does consulting for Genentech and holds stock in Vertex Pharmaceuticals.

Figures

Figure 1.
Figure 1.. Stem cell islet lineage trajectories based on integrated single-cell chromatin accessibility and transcriptome profiles.
(A) Experimental design. scRNA-seq and snATAC-seq data were generated during SC-islet differentiation at day (D) 11, D14, D21, D32 and D39 and computationally integrated to generate “pseudo-cells”. (B) UMAP embedding of chromatin accessibility (left) and transcriptome (right) data. Cluster identities were defined by promoter accessibility (snATAC-seq) or expression (scRNA-seq) of marker genes. PP, pancreatic progenitor; ENP, endocrine progenitor; SC-EC, stem cell-derived enterochromaffin cell-like cells. (C) Heatmap showing ratio of cells with identities in scRNA-seq (column) data matching identities in snATAC-seq (row) data. (D) Gene activity (top) and gene expression (bottom) for cell type marker genes. (E-G) Trajectory analysis based on chromatin accessibility, showing trajectories from D11 and D14 (E), D14 and D21 (F), and D21 and D32/39 (G) data with ENP1, ENP2 and ENP3 set as the root, respectively. Cells were color-coded by either cluster identities or pseudotime values (insets). PP1 and PP2 cells were excluded from the analysis. (H) Inferred endocrine lineage trajectory from e-g. Two branch points (in red) were used in analyses in (I) and (J). (I, J) Heatmaps of transcription factor motif enrichment (top) and gene expression (bottom) along pseudotime bins downstream of trajectory branch points in (H). Top bar shows proportion of cell types in each pseudotime bin, using matching colors to cell type annotations in (B). See also Figure S1 and Table S1.
Figure 2.
Figure 2.. Gene regulatory network analysis of stem cell islet development.
(A) Schematic of GRN inference framework and identification of cell type-specific transcriptional programs. cCRE, candidate cis regulatory element. (B) Clustering of GRN cCREs highly variable across cell types and UMAP embedding. Cell identities were assigned to each cCRE module based on cell type with highest chromatin accessibility of the cCREs. (C) Heatmaps showing scaled chromatin accessibility at cCREs (left) and expression levels (right) of target genes linked to the cCRE in each pseudo-cell. (D) Dot plot showing enrichment of TFs predicted to bind to cCREs in each module against a background of all highly variable cCREs. Significance (−log10 FDR) and odds ratio of the enrichments are represented by color and dot size, respectively. (E) UMAP projections of correlations between NKX6-1 expression and chromatin accessibility of predicted NKX6-1-bound cCREs. SC-β-cell- and SC-EC-specific cCRE modules are highlighted with dashed circles. Spearman cor., spearman correlation coefficient between NKX6-1 expression and cCRE accessibility. (F) Venn diagram showing overlap between NKX6-1 target genes in SC-ECs and SC-β-cells. Cell type specificity of target genes was determined based on specificity of upstream cCREs. 33 genes are regulated by both SC-β-cell- and SC-EC-specific cCREs. (G) Enriched gene ontology terms/pathways among SC-EC- or SC-β-cell-specific NKX6-1 target genes. Significance (−log10 p-value) and odds ratio of the enrichments are represented by color and dot size, respectively. (H) UMAP locations (left) and genome browser snapshots (right) of predicted NKX6-1-bound cCREs at IAPP and LMX1A gene loci. Genome browser tracks show aggregated ATAC reads in SC-β-cells and SC-ECs. All tracks are scaled to uniform 1×10⁶ read depth. SCC, spearman correlation coefficients for cCRE accessibility and target gene expression. (I) Schematic of prediction method for cell type-specific TF interactions. (J, K) UMAP projections of predicted TF-TF interactions. Green dots, cCREs bound by background TF; red dots, cCREs bound by test TF; yellow dots, cCREs co-bound by both TFs; dark grey dots, cCRE module(s) with predicted TF interaction(s). See also Figure S2 and Table S2.
Figure 3.
Figure 3.. Ordering of transcriptional programs along lineage trajectories.
(A, B) UMAP projections of cCRE pseudotime on SC-β-cell (A) and SC-EC (B) lineage trajectories. Insets show cell type annotations of cCRE modules. (C, D) Pseudotime ordering of transcriptional programs along SC-β-cell (C) and SC-EC (D) lineage trajectories from ENP3 progenitors. Gene expression and cCRE accessibility were assigned pseudotime values and plotted in two separate dotted lines (genes, top; cCREs, bottom). For each shown TF, the TF (green), TF-bound cCREs (colored based TF-cCRE correlations) and target genes (brown) are shown. See also Figure S3 and Table S3.
Figure 4.
Figure 4.. A transient fetal pancreatic pre-β-cell population resembles stem cell-derived enterochromaffin cells.
(A,B) UMAP co-embedding of single-cell transcriptomes from endocrine cells in fetal human pancreas (A) and during SC-islet differentiation (B). Cells are color-coded based on their annotated identities in Figure S4A and Figure 1B, respectively. (C) Embedding of single-cell transcriptomes from fetal β-cells (top) and SC-ECs (bottom) on the same UMAP. (D) UMAP embedding of fetal β-cells from the mSTRT-seq data. β-cell subclusters were defined by transcriptome similarities. (E) Gene expression for fetal-β3 cell marker genes. (F) Representative immunofluorescent images for 5HT, PDX1, and insulin (INS) on human pancreas at indicated development stages. Nuclei were labeled with DAPI. Scale bar, 20 μm. (G,H) Quantification of INS+ cells expressing 5HT (G) and 5HT+ cells expressing INS (H) in fetal (10–21 wpc, n > 7 from each donor), neonatal (1–4 days postnatally, n > 6 from each donor, gestational week at birth is shown in the brackets), infant (2–13 months postnatally, n > 6 from each donor) and childhood (20 months to 8 years, n > 6 from each donor) human pancreas. Data are shown as mean ± S.D. Replicates (n) were obtained from randomly selected imaging regions. P-values were calculated using Tukey’s multiple comparisons test after one-way ANOVA. (I-K) Representative flow cytometry plots (left, percentage of population of interest in red) and quantifications (right) of SC-β-cells (NKX6-1+/INS+, G), SC-ECs (NKX6-1+/SLC18A1+, H) and SC-α-cells (NKX6-1/CD26+, I) in early (day (D) 50) and late (D170) SC-islet cultures. Data are shown as mean ± S.D. (n = 3 independent differentiations). P-values were calculated by unpaired two-tailed t-test. (L) Representative immunofluorescent images for 5HT, CDX2, and insulin (INS) on human pancreas at indicated development stages. Nuclei were labeled with DAPI. Arrowheads in insets indicate CDX2 and INS co-positive cells. Scale bar, 20 μm. (M,N) Quantification of CDX2+ cells expressing 5HT and INS (M) and 5HT+/INS+ cells expressing CDX2 (N) in samples from (G,H). Data are shown as mean ± S.D. Replicates (n) were obtained from randomly selected imaging regions. P-values were calculated using Tukey’s multiple comparisons test after one-way ANOVA. (O) Illustration of CDX2 and 5HT expression in EC-like pre-β-cell. See also Figure S4.
Figure 5.
Figure 5.. CDX2 regulates serotonin synthesis genes.
(A) Expression of CDX2, TPH1, and SLC18A1 in fetal (top) or stem cell-derived (bottom) endocrine cells. UMAPs on left indicate location of relevant cell types. (B, C) Genome browser tracks showing CDX2 ChIP-seq reads in SC-islets and aggregated ATAC reads in SC-β-cells and SC-ECs at TPH1 (B) and SLC18A1 (C) gene loci. CDX2-bound cCREs are highlighted. All tracks are scaled to uniform 1×10⁶ read depth. SCC, spearman correlation coefficients for cCRE accessibility and target gene expression. (D) UMAP co-embedding of single cell transcriptomes from wild type (WT) and CDX2 knockout (KO) SC-islets. Cells are color-coded based by transferred identities from Figure 1b. The relative abundance of each cell type in WT and CDX2 KO SC-islets is shown on the right. (E) Dot plot showing differentially expressed genes in WT and CDX2 KO SC-islet cell types. The color of each dot represents the expression level and the size the percentage of cells expressing the gene. See also Figure S5 and Table S4.
Figure 6.
Figure 6.. Insufficient activation of signal-dependent gene regulatory programs in stem cell β-cells.
(A) Schematic showing cell types included into the integrative analysis of snATAC-seq and sc/snRNA-seq data. (B, C) UMAP embedding of chromatin accessibility (B) and transcriptome (C) data from cell types detailed in (A). Cluster identities were defined by promoter accessibility (snATAC-seq) or expression (sc/snRNA-seq) of marker genes. The dashed line outlines β-cell-related cell types. Bottom panels: split UMAPs showing localization of stem cell, childhood and adult pancreatic endocrine cells. Cells were color-coded based on their identities from (A). (D, E) Trajectory analysis based on chromatin accessibility, showing trajectories for α-cells/γ-cells (D) and β-cells/δ-cells (E) with ENP-α and ENP3 set as the root, respectively. Cells were color-coded by either original identities (A) or pseudotime values. (F) Dot plots showing scaled average motif enrichment (left) or gene expression (right) of TFs. The color of each dot represents the average motif enrichment or expression level and the size of each dot the percentage of positive cells for each TF. LDTF, lineage-determining TF; SDTF, signal-dependent TF. (G) K-means clustering of genes with variable expression across β-related cell types (ENP3, SC-ECs, SC-β-cells, PC-β-cells, and PA-β-cells). Clusters were annotated and color-coded based on gene expression patterns. (H) Enriched gene ontology terms/pathways in each cluster. Significance (−log10 p-value) and odds ratio of the enrichments are represented by color and dot size, respectively. See also Figure S6 and Table S5.
Figure 7.
Figure 7.. Gene regulatory network underlying β-cell maturation.
(A) Clustering of GRN cCREs highly variable across β-related cell types and UMAP embedding. Cell identities were assigned to each cCRE module based on cell type with highest chromatin accessibility of the cCREs. ENP, endocrine progenitor; SC, stem cell; EC, enterochromaffin-like cell; PC, primary childhood; PA, primary adult. (B) Dot plot showing enrichment of TFs predicted to bind to cCREs in each module. Significance (−log10 FDR) and odds ratio of the enrichments are represented by color and dot size, respectively. (C) Enriched gene ontology terms/pathways among target genes regulated by signals active in primary β-cells (PC-β and PA-β combined). Significance (−log10 p-value) and odds ratio of the enrichments are represented by color and dot size, respectively. (D, E) UMAP locations (left) and genome browser snapshots (right) of predicted PGR/AR-bound cCREs at CCND2 (D) and MCM5 (E) gene loci. Genome browser tracks show aggregated ATAC reads in SC-β-cells, PC-β-cells, and PA-β-cells. PGR/AR-bound PC-β-cell-specific cCREs at CCND2 (D) and MCM5 (E) are highlighted. All tracks are scaled to uniform 1×10⁶ read depth. SCC, spearman correlation coefficients for cCRE accessibility and target gene expression. (F) Experimental design for dihydrotestosterone (DHT) treatment of SC-islets. EdU, nucleoside analogue 5-Ethynyl-2′-deoxyuridine. (G) Representative flow cytometry plots (left, SC-β-cell percentage in red) and quantifications (right) of SC-β-cells (NKX6-1+/INS+) in D32 SC-islets with treatments shown in (F). Data are shown as mean ± S.D. (n = 3 independent differentiations). P-values were calculated by Dunnett’s multiple comparisons test after one-way ANOVA. (H) Representative flow cytometry plots (left) and quantifications (right) of EdU+ SC-β-cells (NKX6-1+/INS+) in D32 SC-islets with treatments shown in (F). Data are shown as mean ± S.D. (n = 3 independent differentiations). P-values were calculated by Dunnett’s multiple comparisons test after one-way ANOVA. See also Figure S7 and Table S6.

Comment in

Similar articles

Cited by

References

    1. Rezania A, Bruin JE, Arora P, Rubin A, Batushansky I, Asadi A, O’Dwyer S, Quiskamp N, Mojibian M, Albrecht T, et al. (2014). Reversal of diabetes with insulin-producing cells derived in vitro from human pluripotent stem cells. Nat Biotechnol 32, 1121–1133. 10.1038/nbt.3033. - DOI - PubMed
    1. Pagliuca FW, Millman JR, Gürtler M, Segel M, Van Dervort A, Ryu JH, Peterson QP, Greiner D, and Melton DA (2014). Generation of functional human pancreatic β cells in vitro. Cell 159, 428–439. 10.1016/j.cell.2014.09.040. - DOI - PMC - PubMed
    1. Nostro MC, Sarangi F, Yang C, Holland A, Elefanty AG, Stanley EG, Greiner DL, and Keller G (2015). Efficient generation of NKX6-1+ pancreatic progenitors from multiple human pluripotent stem cell lines. Stem Cell Reports 4, 591–604. 10.1016/j.stemcr.2015.02.017. - DOI - PMC - PubMed
    1. Velazco-Cruz L, Song J, Maxwell KG, Goedegebuure MM, Augsornworawat P, Hogrebe NJ, and Millman JR (2019). Acquisition of Dynamic Function in Human Stem Cell-Derived β Cells. Stem Cell Reports 12, 351–365. 10.1016/j.stemcr.2018.12.012. - DOI - PMC - PubMed
    1. Nair GG, Liu JS, Russ HA, Tran S, Saxton MS, Chen R, Juang C, Li ML, Nguyen VQ, Giacometti S, et al. (2019). Recapitulating endocrine cell clustering in culture promotes maturation of human stem-cell-derived β cells. Nat Cell Biol 21, 263–274. 10.1038/s41556-018-0271-4. - DOI - PMC - PubMed

Publication types