. 2023 Apr 11;14(1):2048.
doi: 10.1038/s41467-023-37541-6.

Comparative epidemic expansion of SARS-CoV-2 variants Delta and Omicron in the Brazilian State of Amazonas

Affiliations

Comparative epidemic expansion of SARS-CoV-2 variants Delta and Omicron in the Brazilian State of Amazonas

Ighor Arantes et al. Nat Commun. .

Abstract

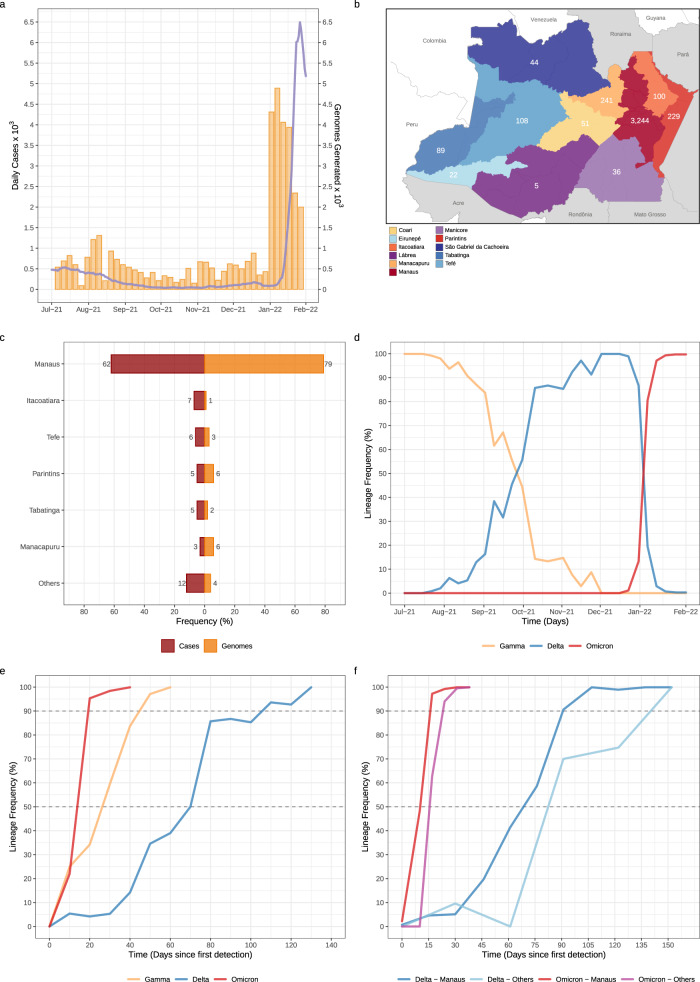
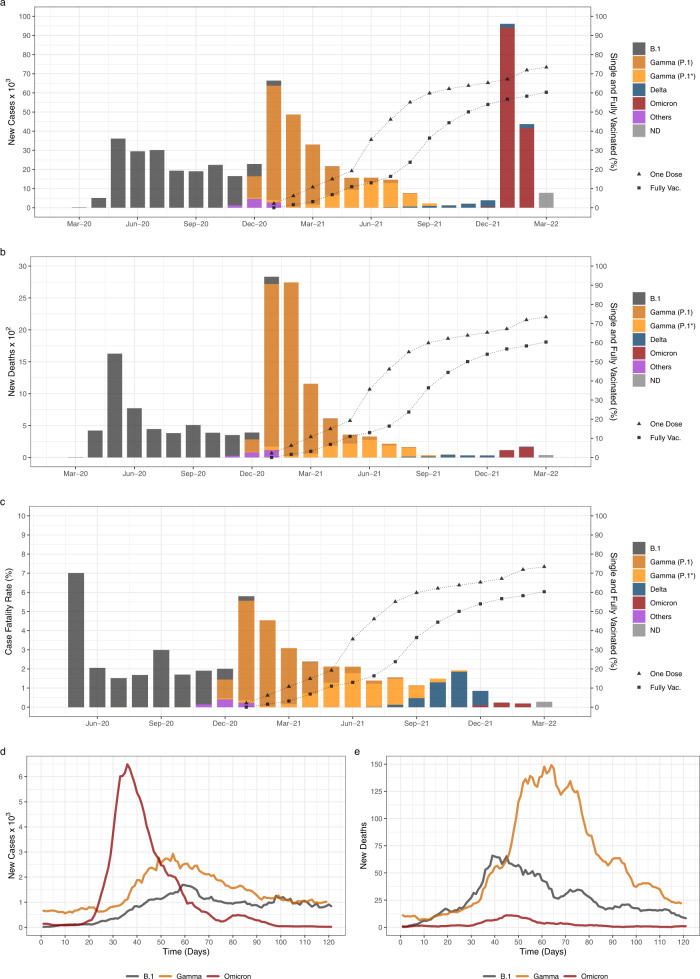
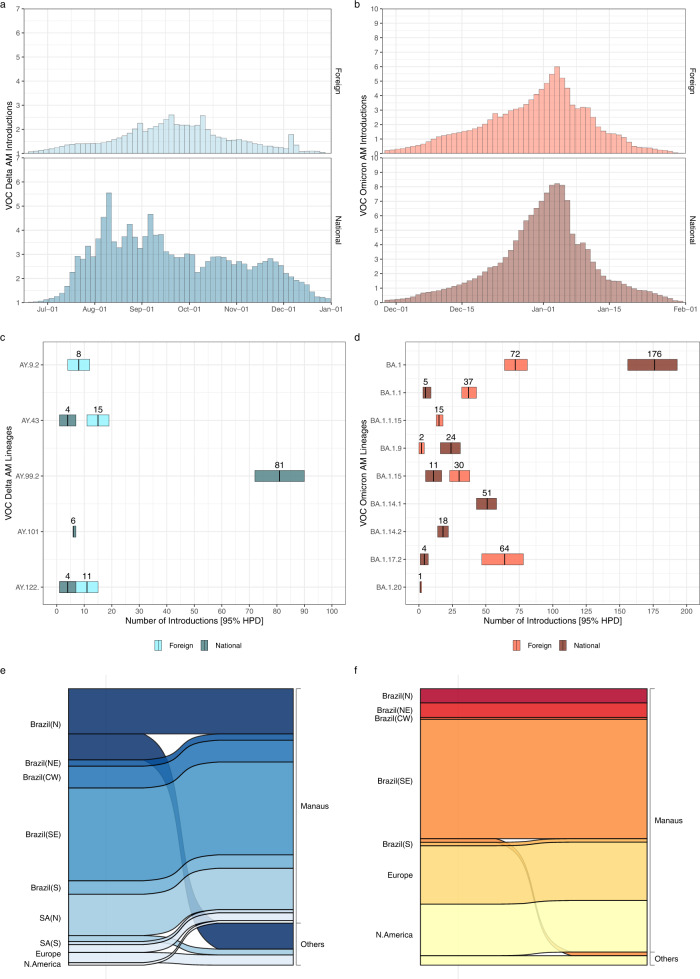
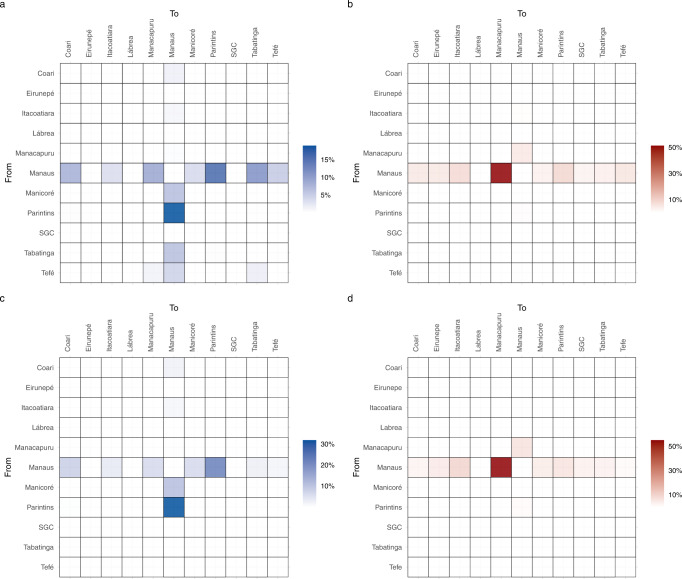
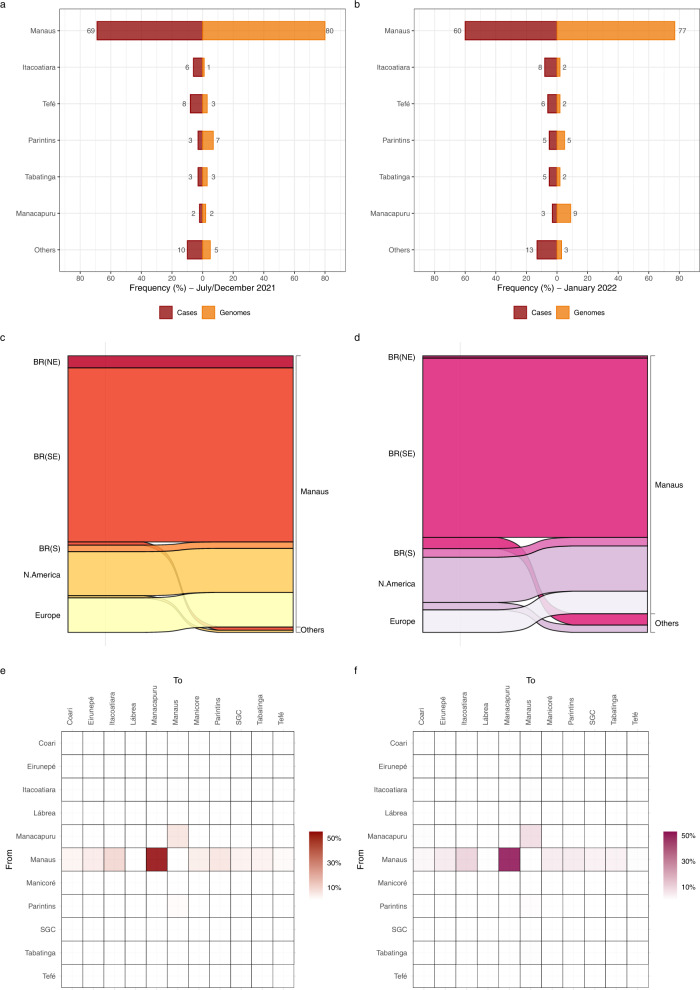
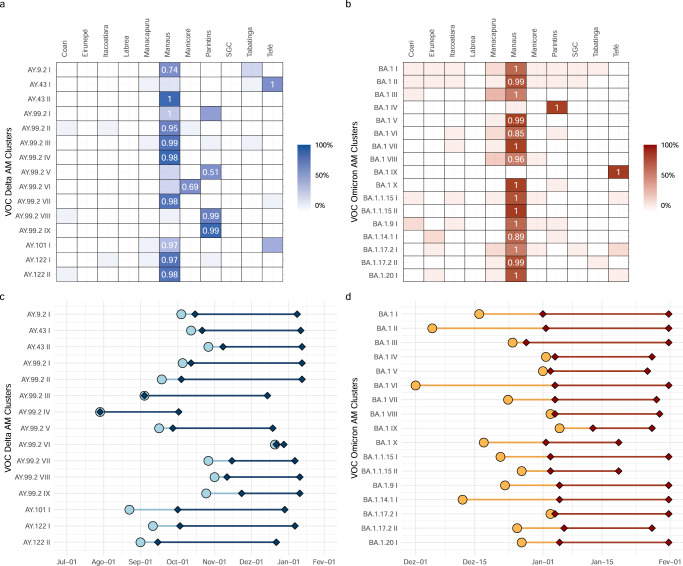
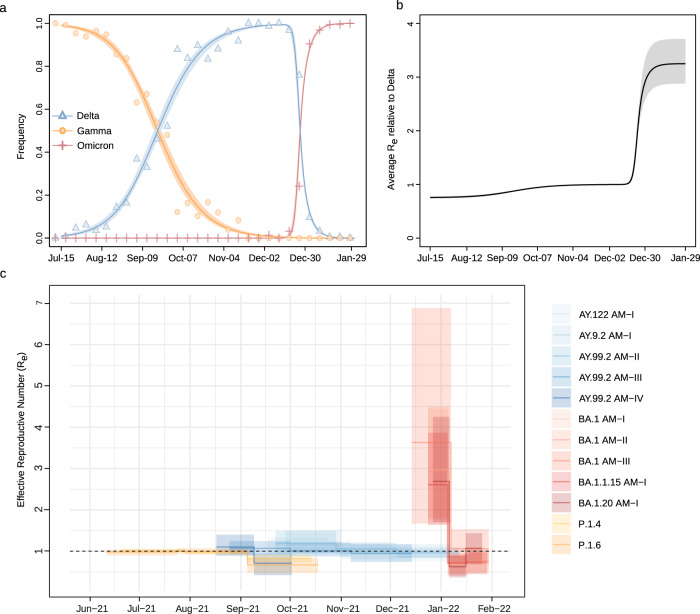
The SARS-CoV-2 variants of concern (VOCs) Delta and Omicron spread globally during mid and late 2021, respectively. In this study, we compare the dissemination dynamics of these VOCs in the Amazonas state, one of Brazil's most heavily affected regions. We sequenced the virus genome from 4128 patients collected in Amazonas between July 1st, 2021, and January 31st, 2022, and investigated the viral dynamics using a phylodynamic approach. The VOCs Delta and Omicron BA.1 displayed similar patterns of phylogeographic spread but different epidemic dynamics. The replacement of Gamma by Delta was gradual and occurred without an upsurge of COVID-19 cases, while the rise of Omicron BA.1 was extremely fast and fueled a sharp increase in cases. Thus, the dissemination dynamics and population-level impact of new SARS-CoV-2 variants introduced in the Amazonian population after mid-2021, a setting with high levels of acquired immunity, greatly vary according to their viral phenotype.


Conflict of interest statement

The authors declare no competing interests.

Figures

Fig. 1
Fig. 1. Temporal and geographic distribution of SARS-CoV-2 cases and genomes in Amazonas state.
a Rolling average (7-day) of daily new SARS-CoV-2 confirmed cases in Amazonas (solid line) and the number of SARS-CoV-2 genomes sequenced in this study (yellow bars) between 1st July 2021 and 31st January 2022. b Map of Amazonas state showing regions covered by the SARS-CoV-2 genomes generated in this study. Numbers represent genomes generated for each region. c Number of SARS-CoV-2 confirmed cases and SARS-CoV-2 genomes from different Amazonian regions between 1st July 2021 and 31st January 2022. de Frequency of VOCs Gamma, Delta, and Omicron BA.1 among SARS-CoV-2 positive samples sequenced in Amazonas since 1st July 2021 (d) or since the first detection of each viral variant (e). f Frequency of VOCs Delta and Omicron BA.1 among SARS-CoV-2 positive samples sequenced within and outside Manaus since the first detection of each viral variant. Amazonas’ map was generated with QGIS v.3.10.2 software (http://qgis.org) using public access data downloaded from the GADM v.3.6 database (https://gadm.org) and shapefiles obtained from the Brazilian Institute of Geography and Statistics (https://portaldemapas.ibge.gov.br/portal.php#homepage).
Fig. 2
Fig. 2. Epidemic trajectories of SARS-CoV-2 variants circulating in Amazonas.
ac Number of monthly confirmed SARS-CoV-2 cases (a), deaths (b), and case-fatality ratio (ratio between the number of confirmed deaths and confirmed cases) (c) are represented together with the percentage of people single and fully vaccinated in Amazonas between March-2020 and March-2022. The color indicates the inferred relative prevalence of viral variants responsible for the infections and deaths as calculated from genomic surveillance data from the EpiCoV database at GISAID. d, e Number of confirmed new SARS-CoV-2 cases (d) and associated deaths (e) during the expansion of B.1, Gamma, and Omicron BA.1 variants in Amazonas since their first detection.
Fig. 3
Fig. 3. Estimated imports of the most prevalent Delta and Omicron lineages into the Amazonas state.
a, b Estimated number of introductions of Delta and Omicron BA.1 into Amazonas state through time from other countries (foreign) or other Brazilian states (national), based on the Markov jump history in the Bayesian phylogeographic analysis of the most prevalent Delta and Omicron lineages combined. c, d Median (and 95% HPD intervals) estimated number of Delta and Omicron BA.1 introductions into Amazonas state (foreign or national) by lineage. e, f Alluvial plots reflect the total estimated number of Delta and Omicron BA.1 imports from each source location (left side) into Manaus or other municipalities (right side), inferred from the Bayesian phylogeographic analyses of all main lineages combined. CW: Central-West. N: North. NE: Northeast. S: South. N: North.
Fig. 4
Fig. 4. Dissemination of the most prevalent Delta and Omicron lineages within the Amazonas state.
ad Heatmap cells are colored according to the estimated number of migrations between Amazonian regions for all Delta (a) and Omicron (b) lineages or for most prevalent lineages AY.99.2 (c) and BA.1 (d). SGC: São Gabriel da Cachoeira.
Fig. 5
Fig. 5. Sampling bias and phylogeographic inferences.
a, b Geographic distribution of SARS-CoV-2 confirmed cases and SARS-CoV-2 genomes from different Amazonian regions during the period of Gamma/Delta (Jul–Dec 2021) (a) and Omicron BA.1 (Jan 2022) (b). c, d Alluvial plots reflect the total estimated number of BA.1 lineage imports from each source location (left side) into Manaus or other municipalities (right side), inferred from the Bayesian phylogeographic analyses with the full dataset (c) and a subset proportional to the confirmed number of cases per state region (d). e, f Heatmap cells are colored according to the estimated number of BA.1 lineage migrations between Amazonian regions inferred from the Bayesian phylogeographic analyses of the full dataset (e) and the subset (f). BR: Brazil, NE: Northeast, SE: Southeast, S: South, SGC: São Gabriel da Cachoeira.
Fig. 6
Fig. 6. Identification of major Delta and Omicron BA.1 transmission lineages in Amazonas state.
a, b Heatmap cells are colored according to the proportion of Delta and Omicron sequences from different state regions within each major Amazonian transmission lineage. Numbers indicate the posterior state probability (PSP) of the most probable source location. c, d Timeline of major Amazonian Delta and Omicron genomic clusters. Median TMRCA (circles) and dates of first and last sampling times (diamonds) are plotted on the X axis and genomic cluster on the Y axis. Light color lines correspond to detection lag (i.e., the difference between the TMRCA and the date at which a transmission lineage was detected) and dark color lines correspond to the full sampling range of each transmission cluster.
Fig. 7
Fig. 7. Relative Re of SARS-CoV-2 VOCs in Amazonas.
a Observed and estimated frequencies of SARS-CoV-2 variants in the Amazonas state. Circles, triangles, and plus signs represent weekly observed frequencies of Gamma, Delta, and Omicron BA-1, respectively. Red, blue, and orange solid lines are estimated average frequencies of Gamma, Delta, and Omicron, respectively, and paled-colored areas represent their 95% confidence intervals. b The estimated average relative Re of SARS-CoV-2 infections with respect to Delta. Solid lines represent the maximum likelihood estimates, and dotted lines represent their 95% confidence intervals (CI). c Temporal variation in the Re of major SARS-CoV-2 clades circulating in Manaus, estimated using the BDSKY approach. The estimates’ median (solid lines) and 95% HPD intervals (shaded areas) are represented.

References

    1. Chen Z, et al. Global landscape of SARS-CoV-2 genomic surveillance and data sharing. Nat. Genet. 2022;54:499–507. doi: 10.1038/s41588-022-01033-y. - DOI - PMC - PubMed
    1. Telenti A, Hodcroft EB, Robertson DL. The evolution and biology of SARS-CoV-2 variants. Cold Spring Harb. Perspect. Med. 2022;12:a041390. doi: 10.1101/cshperspect.a041390. - DOI - PMC - PubMed
    1. Viana R, et al. Rapid epidemic expansion of the SARS-CoV-2 Omicron variant in southern Africa. Nature. 2022;603:679–686. doi: 10.1038/s41586-022-04411-y. - DOI - PMC - PubMed
    1. Tegally, H. et al. Emergence of SARS-CoV-2 Omicron lineages BA.4 and BA.5 in South Africa. Nat. Med.28, 1785–1790 (2022). - PMC - PubMed
    1. Beesley, L. J. et al. SARS-CoV-2 variant transition dynamics are associated with vaccination rates, number of co-circulating variants, and convalescent immunity. EBioMedicine.91, 104534 (2023). - PMC - PubMed

Publication types

Supplementary concepts