

doi: 10.1038/s41421-023-00530-6.
Dioxygenase JID1 mediates the modification of OPDA to regulate jasmonate homeostasis
Affiliations
- PMID: 37041145
- PMCID: PMC10090039
- DOI: 10.1038/s41421-023-00530-6
Item in Clipboard
Dioxygenase JID1 mediates the modification of OPDA to regulate jasmonate homeostasis
Cell Discov.
.
No abstract available
Conflict of interest statement
The authors declare no competing interests.
Figures
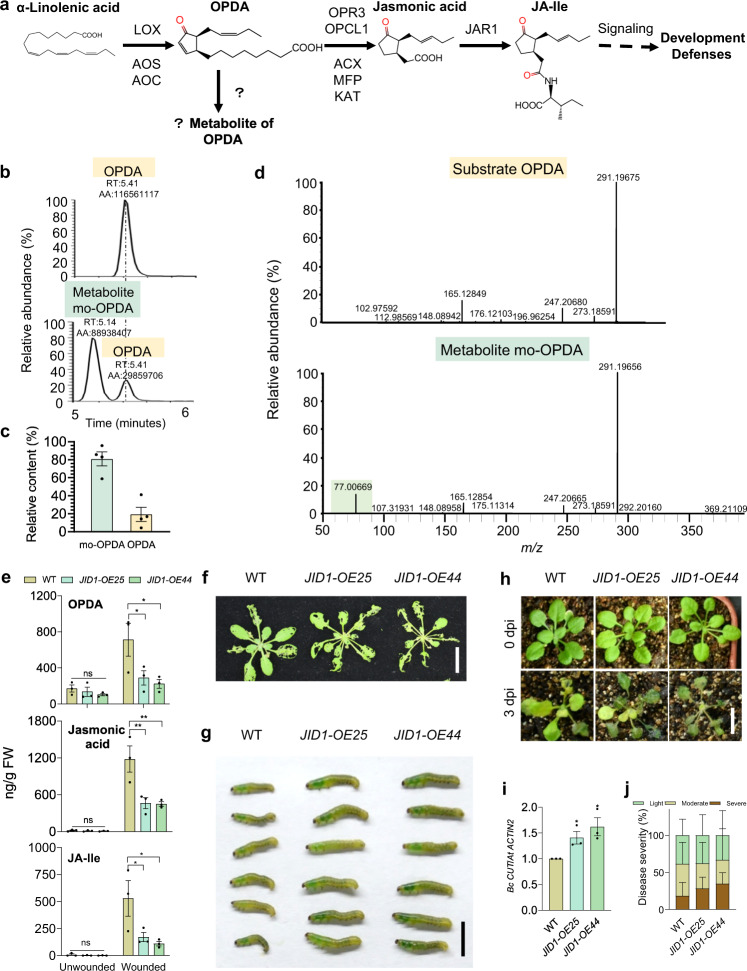
a Schematic of JA biosynthesis. Enzymes involved in JA biosynthesis are indicated. The enzyme(s) involved in the catalysis of OPDA is unclear. b LC-MS/MS analysis of residual OPDA and produced mo-OPDA after incubation with empty vector (top panel) or affinity-purified JID1 protein (bottom panel) respectively, monitored by UHPLC-QE/MS. RT, retention time; AA, peak area. c Relative contents of substrate OPDA and product mo-OPDA after incubation with JID1 protein. Relative content was calculated by the ratio of residual OPDA or produced mo-OPDA peak area relative to that of initial OPDA. The initial content of OPDA was set as 100%. Data are means ± SEM (n = 4). d MS/MS spectra of substrate OPDA (top panel) and product mo-OPDA (bottom panel) monitored by UHPLC-QE/MS. The m/z 77.00669 fragment of mo-OPDA is indicated in green. e JA profiles of plants without (Unwounded) or with mechanical wounding (Wounded) for 1 h. Data are means ± SEM (n = 3). Two-way ANOVA, Tukey’s post-hoc test, ns, P > 0.05, *P ≤ 0.05, **P ≤ 0.01. f, g Representative phenotypes of attacked plants (f) and S. exigua larvae (g) are shown. Scale bars, 2 cm (f), 5 mm (g). h–j Disease symptoms of plants (h), quantification of B. cinerea biomass (i), and disease severity of plants (j) are shown. Scale bar, 1 cm (h). Data are means ± SEM (n = 3). Student’s t-test, *P ≤ 0.05. dpi, days post-inoculation.
Similar articles
-
Ligand diversity contributes to the full activation of the jasmonate pathway in Marchantia polymorpha.Proc Natl Acad Sci U S A. 2022 Sep 6;119(36):e2202930119. doi: 10.1073/pnas.2202930119. Epub 2022 Aug 29. Proc Natl Acad Sci U S A. 2022. PMID: 36037336 Free PMC article.
-
An evolutionarily ancient fatty acid desaturase is required for the synthesis of hexadecatrienoic acid, which is the main source of the bioactive jasmonate in Marchantia polymorpha.New Phytol. 2022 Feb;233(3):1401-1413. doi: 10.1111/nph.17850. Epub 2021 Nov 30. New Phytol. 2022. PMID: 34846752
-
Insights into the Jasmonate Signaling in Basal Land Plant Revealed by the Multi-Omics Analysis of an Antarctic Moss Pohlia nutans Treated with OPDA.Int J Mol Sci. 2022 Nov 4;23(21):13507. doi: 10.3390/ijms232113507. Int J Mol Sci. 2022. PMID: 36362295 Free PMC article.
-
Jasmonate biochemical pathway.Sci Signal. 2010 Feb 16;3(109):cm3. doi: 10.1126/scisignal.3109cm3. Sci Signal. 2010. PMID: 20159849 Review.
-
12-oxo-Phytodienoic Acid: A Fuse and/or Switch of Plant Growth and Defense Responses?Front Plant Sci. 2021 Aug 17;12:724079. doi: 10.3389/fpls.2021.724079. eCollection 2021. Front Plant Sci. 2021. PMID: 34490022 Free PMC article. Review.
Cited by
-
Comprehensive transcriptional analysis of ethylene and softening regulation in plums with distinct climacteric ripening behaviors.BMC Plant Biol. 2025 Jul 12;25(1):908. doi: 10.1186/s12870-025-06932-w. BMC Plant Biol. 2025. PMID: 40652170 Free PMC article.
-
Amide conjugates of the jasmonate precursor cis-(+)-12-oxo-phytodienoic acid regulate its homeostasis during plant stress responses.Plant Physiol. 2024 Dec 23;197(1):kiae636. doi: 10.1093/plphys/kiae636. Plant Physiol. 2024. PMID: 39607728 Free PMC article.
-
Glutathione triggers leaf-to-leaf, calcium-based plant defense signaling.Nat Commun. 2025 Feb 24;16(1):1915. doi: 10.1038/s41467-025-57239-1. Nat Commun. 2025. PMID: 39994230 Free PMC article.
-
OPDA/dn-OPDA actions: biosynthesis, metabolism, and signaling.Plant Cell Rep. 2024 Aug 2;43(8):206. doi: 10.1007/s00299-024-03286-9. Plant Cell Rep. 2024. PMID: 39093416 Review.
-
Transcriptomics and trans-organellar complementation reveal limited signaling of 12-cis-oxo-phytodienoic acid during early wound response in Arabidopsis.Nat Commun. 2025 Jul 21;16(1):6684. doi: 10.1038/s41467-025-61832-9. Nat Commun. 2025. PMID: 40691436 Free PMC article.
References
-
- Caarls, L. et al. Proc. Natl. Acad. Sci. USA114, 6388–6393 (2017).
-
- Maynard D, et al. J. Exp. Bot. 2018;69:5341–5354. - PubMed
Publication types
Grants and funding
LinkOut - more resources
Full Text Sources
