. 2023 Apr 11;14(1):2041.
doi: 10.1038/s41467-023-37874-2.

Targeting advanced prostate cancer with STEAP1 chimeric antigen receptor T cell and tumor-localized IL-12 immunotherapy

Affiliations

Targeting advanced prostate cancer with STEAP1 chimeric antigen receptor T cell and tumor-localized IL-12 immunotherapy

Vipul Bhatia et al. Nat Commun. .

Abstract

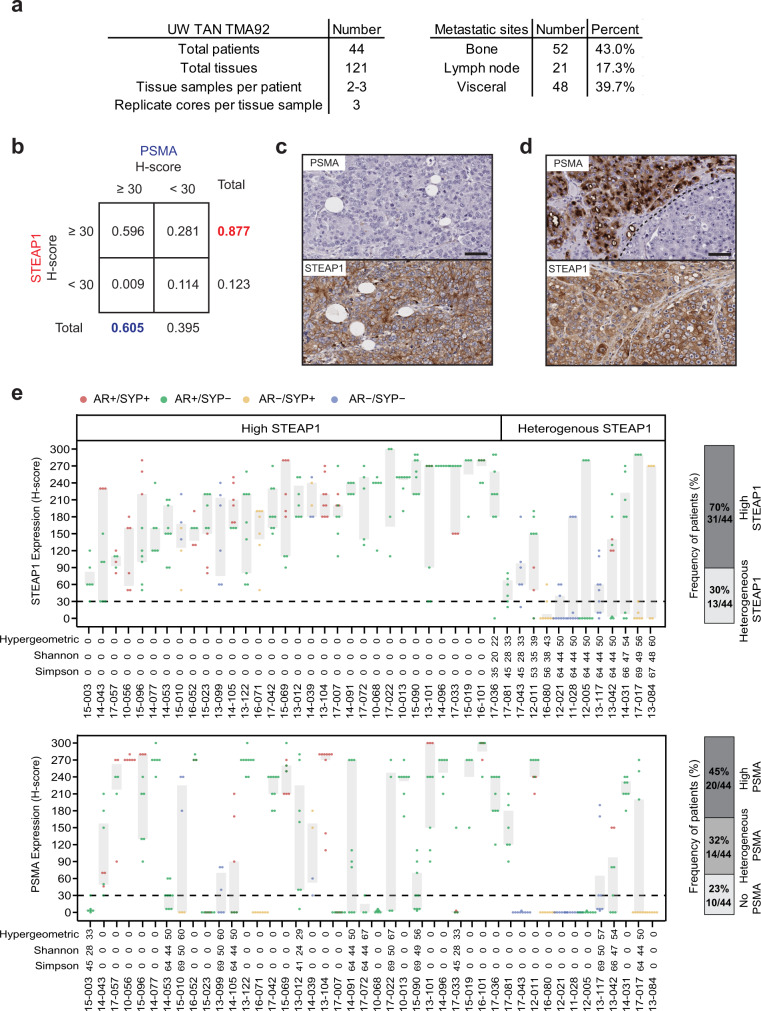
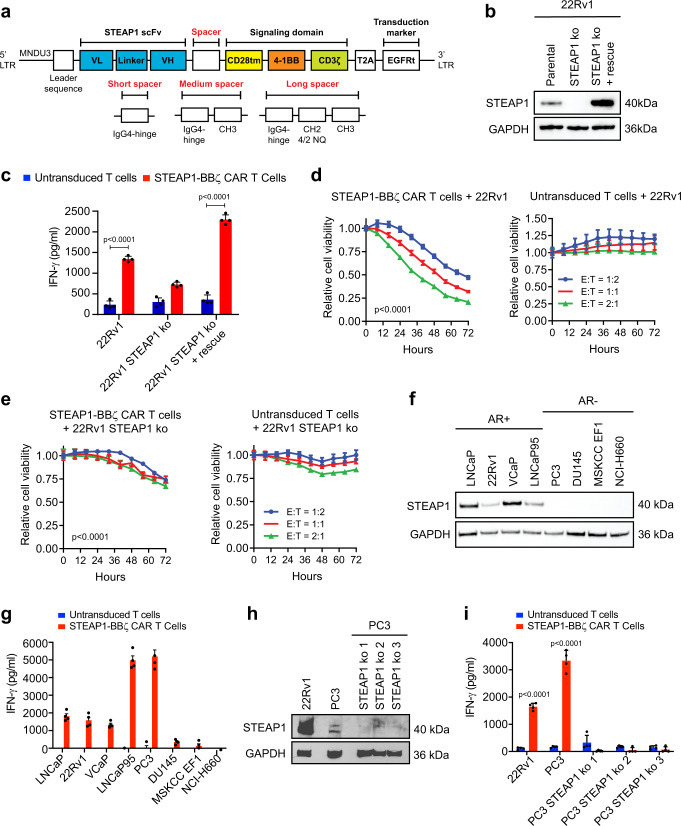
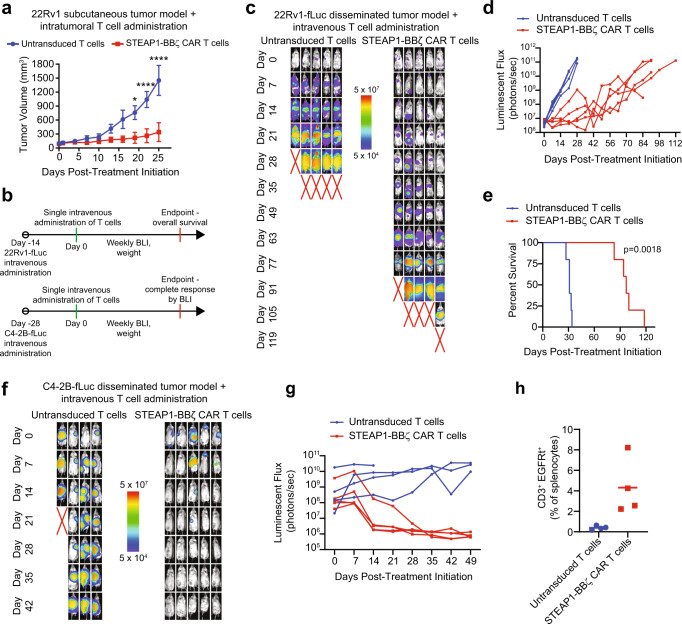
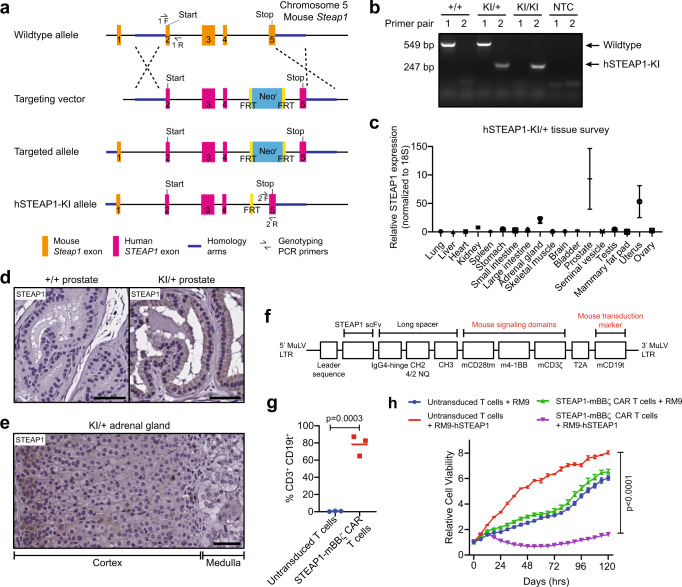
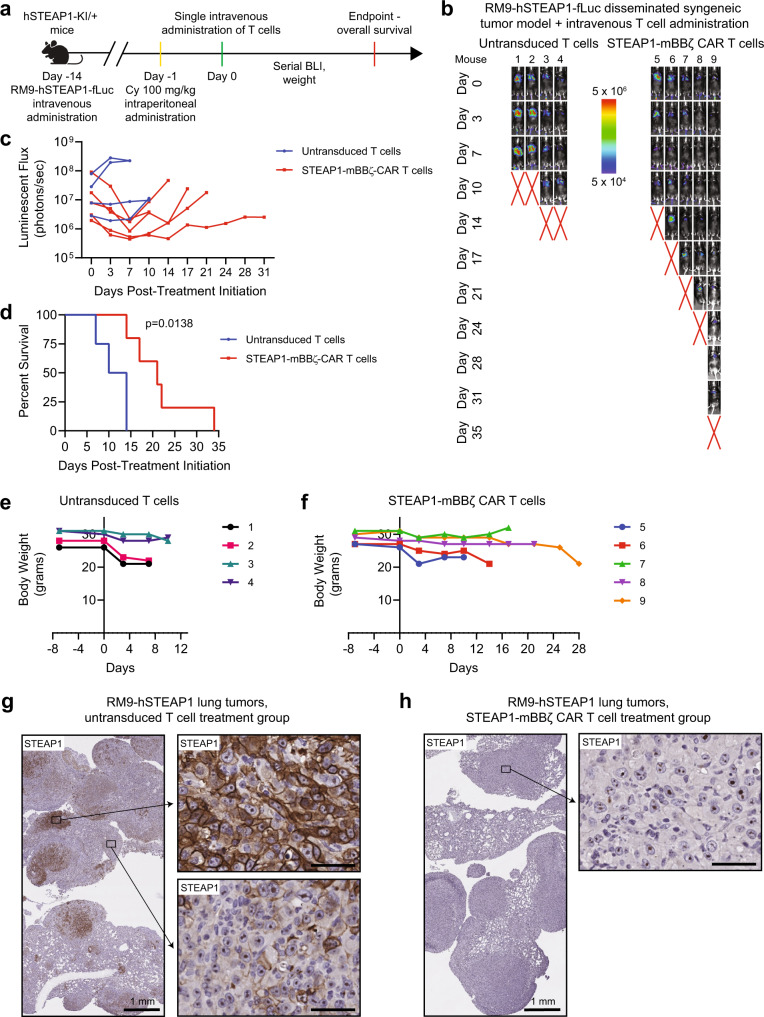
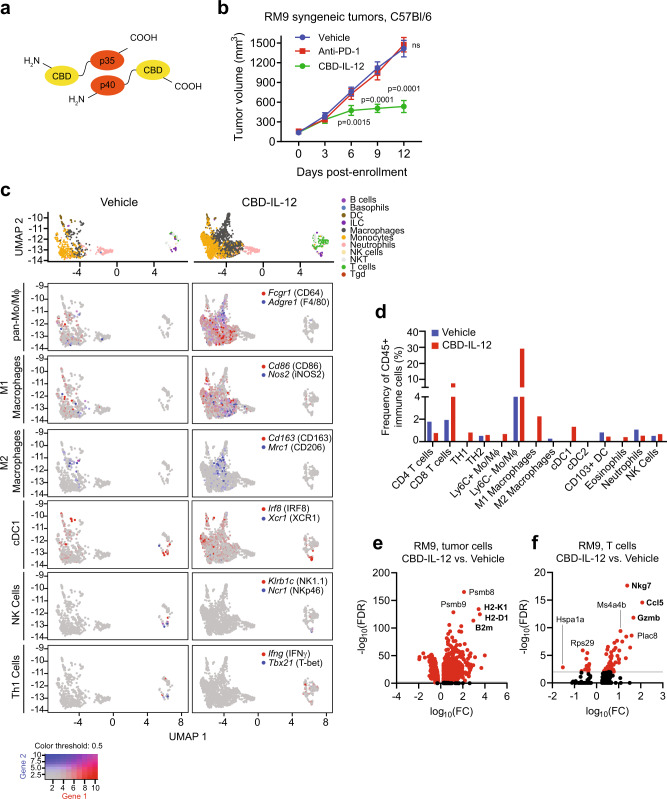
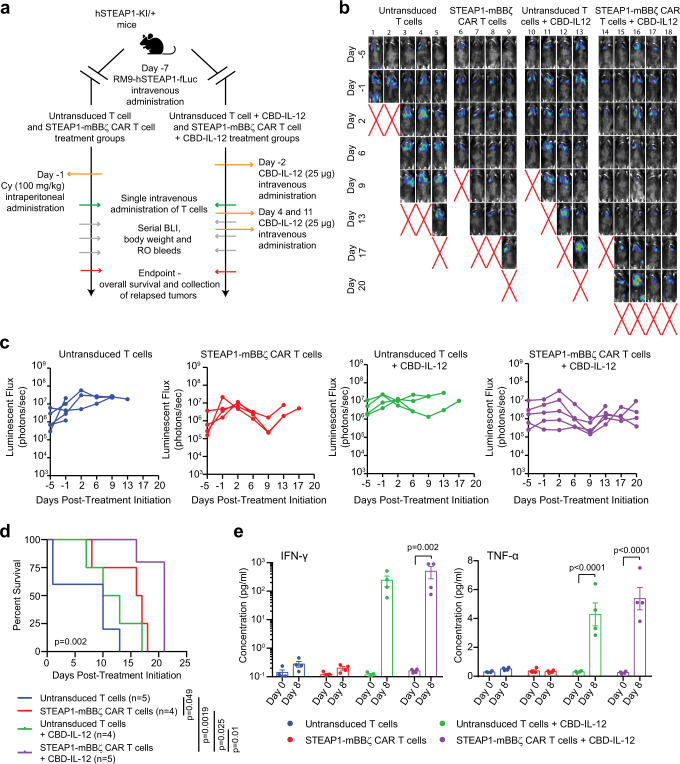
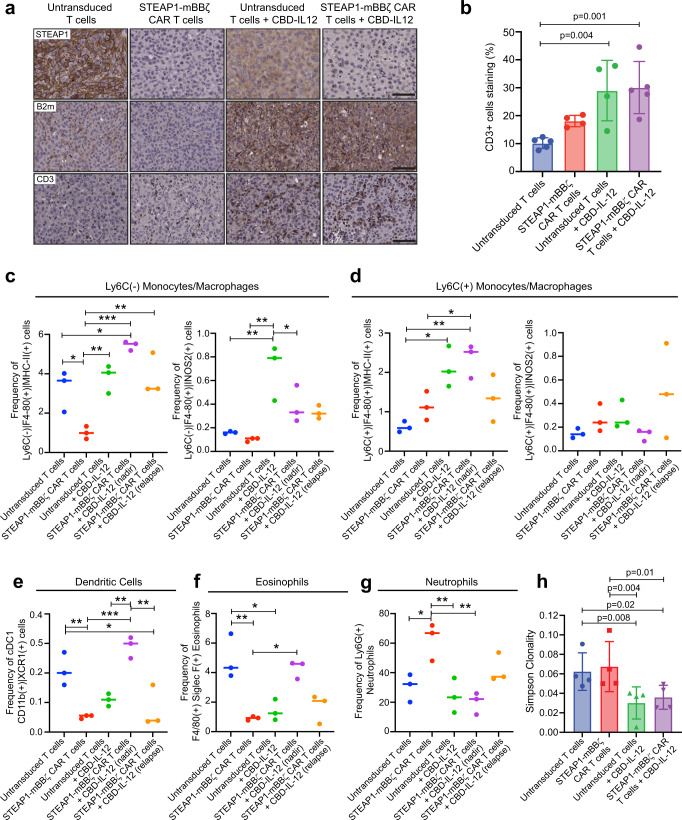
Six transmembrane epithelial antigen of the prostate 1 (STEAP1) is a cell surface antigen for therapeutic targeting in prostate cancer. Here, we report broad expression of STEAP1 relative to prostate-specific membrane antigen (PSMA) in lethal metastatic prostate cancers and the development of a STEAP1-directed chimeric antigen receptor (CAR) T cell therapy. STEAP1 CAR T cells demonstrate reactivity in low antigen density, antitumor activity across metastatic prostate cancer models, and safety in a human STEAP1 knock-in mouse model. STEAP1 antigen escape is a recurrent mechanism of treatment resistance and is associated with diminished tumor antigen processing and presentation. The application of tumor-localized interleukin-12 (IL-12) therapy in the form of a collagen binding domain (CBD)-IL-12 fusion protein combined with STEAP1 CAR T cell therapy enhances antitumor efficacy by remodeling the immunologically cold tumor microenvironment of prostate cancer and combating STEAP1 antigen escape through the engagement of host immunity and epitope spreading.


Conflict of interest statement

T.E.P. and J.K.L. are inventors on U.S. Provisional Patent Application No. 63/309389 entitled “Chimeric Antigen Receptors Binding STEAP1” related to this work. J.I. is a co-founder and shareholder of Arrowimmune, Inc. J.I. is a scientific advisor of Libo Pharma Corp. The remaining authors declare no competing interests.

Figures

Fig. 1
Fig. 1. Comparative analysis of STEAP1 and PSMA in lethal, metastatic castration-resistant prostate cancer (mCRPC).
a Characteristics of the mCRPC tissues represented on University of Washington Tissue Acquisition Necropsy Tissue Microarray 92 (UW TAN TMA92). b Contingency table showing the frequency of mCRPC tissues with STEAP1 or PSMA IHC staining above or below an H-score threshold of 30. Micrographs of select mCRPC tissues after STEAP1 and PSMA IHC staining to highlight the (c) absence of PSMA but presence of STEAP1 expression and (d) intratumoral heterogeneity of PSMA expression but not STEAP1. Scale bars = 50 µm. For panels (c, d) n = 332 mCRPC cores were immunostained for STEAP1 and PSMA. e Dot and box plot showing the distribution of STEAP1 (top) and PSMA (bottom) H-scores in 44 patients from the UW TAN TMA92 cohort. Each dot represents a tumor specimen/core (n = 319 cores for PSMA and 333 cores for STEAP1) and the color indicates the molecular subtype: AR+/SYP+ (red), AR+/SYP− (green), AR−/SYP+ (yellow) and AR−/SYP− (purple). Gray rectangles show interquartile ranges spanning the 25th to the 75th percentiles of PSMA H-scores from each patient. Bar plots (on the right) summarize the frequencies of patients classified based on STEAP1 and PSMA expression as no expression (all cores with H-score ≤30, light grey), heterogeneous expression (at least one core with H-score ≤30 and H-score >30, mid grey) and high expression (all cores with H-scores >30, dark grey). Source data are provided in the Source Data file.
Fig. 2
Fig. 2. Screening second-generation 4-1BB chimeric antigen receptors (CARs) to identify a lead for STEAP1 CAR T cell therapy.
a Schematic of the lentiviral STEAP1 CAR construct and variation based on short, medium, and long spacers. LTR long terminal repeat, MNDU3 Moloney murine leukemia virus U3 region, scFv single-chain variable fragment, VL variable light chain, VH variable heavy chain, tm transmembrane, EGFRt truncated epidermal growth factor receptor, 4/2 NQ = CH2 domain mutations to prevent binding to Fc-gamma receptors. b Immunoblots of STEAP1 in 22Rv1 parental cells, STEAP1 knockout (ko) cells, and STEAP1 ko cells with rescue of STEAP1. c IFN-γ enzyme-linked immunosorbent assay (ELISA) results from co-cultures of either untransduced T cells or STEAP1-BBζ CAR T cells with each of the 22Rv1 sublines at a 1:1 ratio at 24 h (p < 0.001). Relative cell viability of (d) 22Rv1 and (e) 22Rv1 STEAP1 ko target cells over time measured by fluorescence live cell imaging upon co-culture with (left) STEAP1-BBζ CAR T cells (p < 0.001) or (right) untransduced T cells at variable effector-to-target (E:T) cell ratios. f Immunoblots demonstrating expression of STEAP1 in androgen receptor (AR)-positive human prostate cancer cell lines but not AR-negative prostate cancer cell lines. g IFN-γ quantification by ELISA from co-cultures of either untransduced T cells or STEAP1-BBζ CAR T cells with each of the human prostate cancer cell lines in (f) at a 1:1 ratio at 24 h. h Immunoblots for STEAP1 in 22Rv1, PC3, and PC3 STEAP1 ko sublines. i IFN-γ quantification by ELISA from co-cultures of either untransduced T cells or STEAP1-BBζ CAR T cells with each cell line in (h) at a 1:1 ratio at 24 h (p < 0.001). For panels (ce, g and i) n = 4 biological replicates per conditions were used and error bars represent mean with SEM. Panel (b, f, h) displays results representative of n = 3 biological replicates. GAPDH was used as a protein loading control. For panel (c) and (i), two-way ANOVA with Sidaks multiple comparison test was used. For panels (d) and (e), two-way ANOVA with Tukeys multiple comparisons test was used. Source data are provided in the Source Data file.
Fig. 3
Fig. 3. In vivo antitumor activity of STEAP1-BBζ CAR T cell therapy in prostate cancer models with native STEAP1 expression.
a Volumes of 22Rv1 subcutaneous tumors in NSG mice (n = 4 for untransduced T cells group and n = 5 for STEAP1-BBζ CAR T cells group) over time after a single intratumoral injection of 5 × 106 untransduced T cells or STEAP1-BBζ CAR T cells at normal CD4/CD8 ratios. p < 0.0001 at day 20 and 25. Bars represent mean with SEM. b Schematic of tumor challenge experiments for 22Rv1 (top) and C4-2B (bottom) disseminated models. fLuc firefly luciferase, BLI bioluminescence imaging. c Serial live bioluminescence imaging (BLI) of NSG mice engrafted with 22Rv1-fLuc metastases and treated with a single intravenous injection of 5 × 106 untransduced T cells or STEAP1-BBζ CAR T cells at normal CD4/CD8 ratios on day 0. Red X denotes deceased mice. Radiance scale is shown. d Plot showing the quantification of total flux over time from live BLI of each mouse in (c). e Kaplan–Meier survival curves of mice in (c) with statistical significance determined by log-rank (Mantel-Cox) test. For panels (ce) n = 5 mice per condition were used. f Serial live BLI of NSG mice engrafted with C4-2B metastases and treated with a single intravenous injection of 5 × 106 untransduced T cells or STEAP1-BBζ CAR T cells at normal CD4/CD8 ratios on day 0. Red X denotes deceased mice. Radiance scale is shown. g Plot showing the quantification of total flux over time from live BLI of each mouse in (f). For panels (f, g) n = 4 mice were used in the untransduced T cells group and n = 5 mice in the STEAP1-BBζ CAR T cells group. h Quantification of CD3+EGFRt+ STEAP1-BBζ CAR T cells by flow cytometry from splenocytes of mice treated with STEAP1-BBζ CAR T cells (n = 4) at the end of experiment on day 49. Bars represent mean. For panel (a), two-way ANOVA with Sidak’s multiple comparison test was used. Source data are provided in the Source Data file.
Fig. 4
Fig. 4. Establishing a mouse-in-mouse system with a human STEAP1 knock-in (hSTEAP1-KI) mouse model and murinized STEAP1 CAR.
a Schematic showing the homologous recombination strategy using a targeting vector to knock-in human STEAP1 exons 2–5 into the mouse Steap1 locus on the C57Bl/6 background. FRT Flippase recognition target. b Visualization of PCR products from tail tip genotyping of wildtype (+/+), heterozygous (KI/+), or homozygous (KI/KI) mice using primer pairs intended to amplify portions of wildtype or hSTEAP1-KI alleles. NTC null template control. Representative gel image from n = 3 biologically independent experiments. c qPCR for human STEAP1 expression normalized to 18 S expression in a survey of tissues from hSTEAP1-KI/+ mice. n = 3 for sex-specific organs and n = 6 for common organs. Bars represent mean with SEM. Photomicrographs of STEAP1 IHC staining of (d) prostate tissues from (left) +/+ and (right) KI/+ mice and (e) an adrenal gland from a KI/+ mouse. Scale bars = 50 µm. For panel (d, e) STEAP1 immunostaining was performed on n = 3 biologically independent specimens. f Schematic of the retroviral murinized STEAP1 CAR construct. MuLV murine leukemia virus, mCD19t mouse truncated CD19. g Quantification of the efficiency of retroviral transduction of activated mouse T cells from three independent experiments based on the frequency of mouse CD3+CD19t+ cells by flow cytometry (p = 0.0003). h Relative cell viability of RM9 or RM9-hSTEAP1 target cells over time measured by fluorescence live cell imaging upon co-culture at a 1:1 ratio with mouse STEAP1-mBBζ CAR T cells or untransduced T cells (p < 0.0001). n = 4 biological replicates per condition. Error bars represent mean with SEM. For panel (g), unpaired two-tailed Student’s t test with Welch’s correction was used. In panel (h), two-way ANOVA with Sidak’s multiple comparison test was used. Source data are provided in the Source Data file.
Fig. 5
Fig. 5. Determination of the efficacy and safety of mouse STEAP1-mBBζ CAR T cells in hSTEAP1-KI mice bearing syngeneic, disseminated prostate cancer.
a Schematic of the tumor challenge experiment for the RM9-hSTEAP1 disseminated model in hSTEAP1-KI/ + mice. Cy cyclophosphamide (for preconditioning). Created with BioRender.com. b Serial live BLI of hSTEAP1-KI/ + mice engrafted with RM9-hSTEAP1-fLuc metastases and treated with a single intravenous injection of 5 × 106 mouse untransduced T cells or STEAP1-mBBζ CAR T cells on day 0. Red X denotes deceased mice. Radiance scale is shown. c Plot showing the quantification of total flux over time from live BLI of each mouse in (b). d Kaplan–Meier survival curves of mice in (b) with statistical significance determined by log-rank (Mantel–Cox) test. For panels (bd), n = 4 mice were used in the untransduced T cells group and n = 5 mice in the STEAP1-BBζ CAR T cells group. Plots of weights for each mouse (numbered in (b)) over time in the (e) mouse untransduced T cells treatment group and (f) STEAP1-mBBζ CAR T cell treatment group. g Photomicrographs at (left) low and (right) high magnification of STEAP1 IHC staining of RM9-hSTEAP1 lung tumors after treatment with mouse untransduced T cells showing regions of strong homogenous STEAP1 expression and heterogeneous STEAP1 expression. Scale bars = 50 µm, unless otherwise noted. h Photomicrographs at (left) low and (right) high magnification of STEAP1 IHC staining of RM9-hSTEAP1 tumors after treatment with STEAP1-mBBζ CAR T cells showing no STEAP1 expression. Scale bars = 50 µm, unless otherwise noted. For panels (g, h) STEAP1 immunostaining was performed on n = 4 biologically independent specimens. Source data are provided in the Source Data file.
Fig. 6
Fig. 6. Systemic collagen-binding domain IL-12 (CBD-IL-12) cytokine fusion therapy inhibits prostate cancer tumor growth and reprograms the tumor immune microenvironment.
a Schematic of CBD-IL-12, composed of the p35 and p40 subunits fused to the CBD from von Willebrand factor domain A3. b Volumes of RM9 subcutaneous tumors in sygeneic C57Bl/6 mice over time with treatment with vehicle, anti-PD-1 (clone 29 F.1A12) 200 Μg by intraperitoneal injection every 5 days, or CBD-IL-12 25 Μg by intravenous injection every 5 days starting on day 0. n = 7 mice in vehicle and CBD-IL-12 treated groups and n = 8 mice in anti-PD1 treated group. p < 0.0001 at day 9 and 12. Bars represent mean with SEM. P-values are derived from two-way ANOVA with Dunnett’s multiple comparisons test, ns not significant. c Uniform Manifold Approximation and Projection (UMAP) plots of different immune cell subsets (top) from single-cell RNA-seq (scRNA-seq) analysis of five RM9 tumors each aggregated from mice treated with vehicle or CBD-IL-12. UMAP plots colored with gene expression of immune cell subset-specific markers for pan-monocytes/macrophages, M1 and M2 polarized marcophages, conventional type 1 dendritic cells (cDC1), natural killer (NK) cells, and T helper type 1 (Th1) cells. d Plots showing the frequency of specific immune cell populations (relative to CD45 + immune cells) identified by scRNA-seq analysis including CD4+ and CD8+ T cells, Th1 (Infg+Tbx21+) and Th2 (cMAF+Gata3+) cells, Ly6C+/− monocytes/macrophages (Ly6C+/−Adgre1+), M1 macrophages (CD80+CD86+INOS2+), M2 macrophages (CD163+Mrc1+cMAF+), cDC1 (XCR1+IRF8+), conventional type 2 dendritic cells (cDC2, CD1+IRF4+), migratory CD103+ dendritic cells (Itgae+), eosinophils (SiglecF+), neutrophils (Ly6G+), and NK cells (Klrb1c+Ncr1+) in tumors treated with vehicle or CBD-IL-12. Volcano plots showing differential gene expression in (e) tumor cells and (f) T cells from RM9 tumors of mice treated CBD-IL-12 relative to those treated with vehicle. FC fold change, FDR false discovery rate. Source data are provided in the Source Data file.
Fig. 7
Fig. 7. Combining CBD-IL-12 with STEAP1-mBBζ CAR T cell therapy enhances overall survival and inflammatory cytokine levels.
a Schematic of the tumor challenge experiment for the RM9-hSTEAP1 disseminated model in hSTEAP1-KI/+ mice investigating the combination of CBD-IL-12 with STEAP1-mBBζ CAR T cell therapy. Cy cyclophosphamide (for preconditioning). Created with BioRender.com. b Serial live BLI of hSTEAP1-KI/ + mice engrafted with RM9-hSTEAP1-fLuc metastases and treated with a single intravenous injection of 5 × 106 mouse untransduced T cells or STEAP1-mBBζ CAR T cells on day 0 with or without CBD-IL-12 treatment weekly. Red X denotes deceased mice. The radiance scale is shown. (c) Plot showing the quantification of total flux over time from live BLI of each mouse in (b). d Kaplan–Meier survival curves of mice in (b) with statistical significance determined by log-rank (Mantel-Cox) test (p = 0.002). e Plots showing serum cytokine levels of IFN-γ (left, p = 0.002) and TNF-α (right, p < 0.0001) based on ProcartaPlex immunoassays from retroorbital bleeds of hSTEAP1-KI/+ mice (n = 4 mice per group) bearing RM9-hSTEAP1-fLuc metastases prior to (day 0) and after treatment (day 8) with untransduced mouse T cells or mouse STEAP1-mBBζ CAR T cells with or without CBD-IL-12 therapy. Error bar represents mean with SEM. For panel (e), p-values were derived from two-way ANOVA with Sidak’s multiple comparisons test. Source data are provided in the Source Data file.
Fig. 8
Fig. 8. Combining CBD-IL-12 with STEAP1-mBBζ CAR T cell therapy reprograms the tumor immune microenvironment and promotes antigen presentation and epitope spreading.
a Photomicrographs of STEAP1 (top), B2m (middle), and CD3 (bottom) IHC staining of RM9-hSTEAP1 lung tumors after treatment with mouse untransduced T cells or STEAP1-mBBζ CAR T cells with or without CBD-IL-12 treatment. Scale bars = 50 µm. b Bar plot showing IHC quantification of CD3 positive cells infiltrating the metastatic lung tumors (n = 4 tumors per group). One-way ANOVA p = 0.0021. Error bar represents mean with SD. Plots showing the frequencies of (c) Ly6CF4/80+MHC-II+ (left, one-way ANOVA p = 0.0005) and Ly6CF4/80+iNOS2+ (right, one-way ANOVA p = 0.0017) macrophages, (d) Ly6C+F4/80+MHC-II+ (left, one-way ANOVA p = 0.0038) and Ly6C+F4/80+iNOS2+ (right, one-way ANOVA p = ns) macrophages, (e) CD11b+XCR1+ cDC1 (one-way ANOVA p = 0.0003), (f) F4/80+SiglecF+ eosinophils (one-way ANOVA p = 0.0008), and (g) Ly6G+ neutrophils (one-way ANOVA p = 0.0035) normalized to total CD45+ cells as determined by multiparametric flow cytometry after treatment with untransduced T cells, STEAP1-mBBζ CAR T cells, untransduced T cells and CBD-IL-12, and STEAP1-mBBζ CAR T cells and CBD-IL-12 at maximal treatment response (nadir) and tumor relapse (relapse). h Bar plots representing Simpson clonality as a measure of ‘evenness’ of the TCR repertoire analyzed by TCRB sequencing on tumor infiltrating cells collected from mice in (a). n = 4 tumors per group. P-values for untransduced T cels + CBD-IL-12 compared to untransduced T cells and STEAP1-mBBζ CAR T cells are 0.008 and 0.02, respectively; and STEAP1-mBBζ CAR T cells + CBD-IL-12 compared to untransduced and STEAP1-mBBζ CAR T cells are 0.004 and 0.01, respectively. Error bar represents mean with SD. For panels (cg) n = 3 tumors per group, *p < 0.05; **p < 0.01, ***p < 0.001, p-values in panels (bh) are from one-way ANOVA with Dunn’s multiple comparisons test. Source data are provided in the Source Data file.

References

    1. Siegel RL, Miller KD, Fuchs HE, Jemal A. Cancer statistics, 2022. CA: Cancer J. Cinicians. 2022;72:7–33. - PubMed
    1. Armstrong AJ, et al. Five-year survival prediction and safety outcomes with enzalutamide in men with chemotherapy-naïve metastatic castration-resistant prostate cancer from the PREVAIL Trial. Eur. Urol. 2020;78:347–357. doi: 10.1016/j.eururo.2020.04.061. - DOI - PubMed
    1. Fizazi K, et al. Abiraterone plus prednisone in metastatic, castration-sensitive prostate cancer. N. Engl. J. Med. 2017;377:352–360. doi: 10.1056/NEJMoa1704174. - DOI - PubMed
    1. Scher HI, et al. Increased survival with enzalutamide in prostate cancer after chemotherapy. N. Engl. J. Med. 2012;367:1187–1197. doi: 10.1056/NEJMoa1207506. - DOI - PubMed
    1. Parker C, et al. Alpha emitter radium-223 and survival in metastatic prostate cancer. N. Engl. J. Med. 2013;369:213–223. doi: 10.1056/NEJMoa1213755. - DOI - PubMed

Publication types