. 2023 Apr 11;14(1):2042.
doi: 10.1038/s41467-023-37590-x.

FADS1-arachidonic acid axis enhances arachidonic acid metabolism by altering intestinal microecology in colorectal cancer

Affiliations

FADS1-arachidonic acid axis enhances arachidonic acid metabolism by altering intestinal microecology in colorectal cancer

Chunjie Xu et al. Nat Commun. .

Abstract

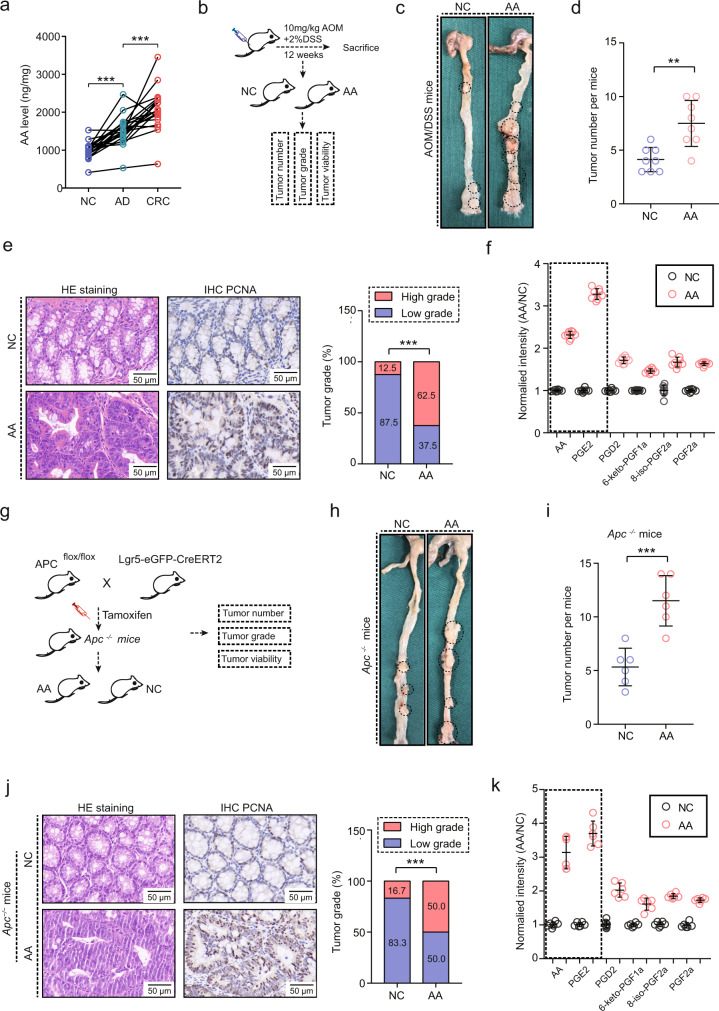
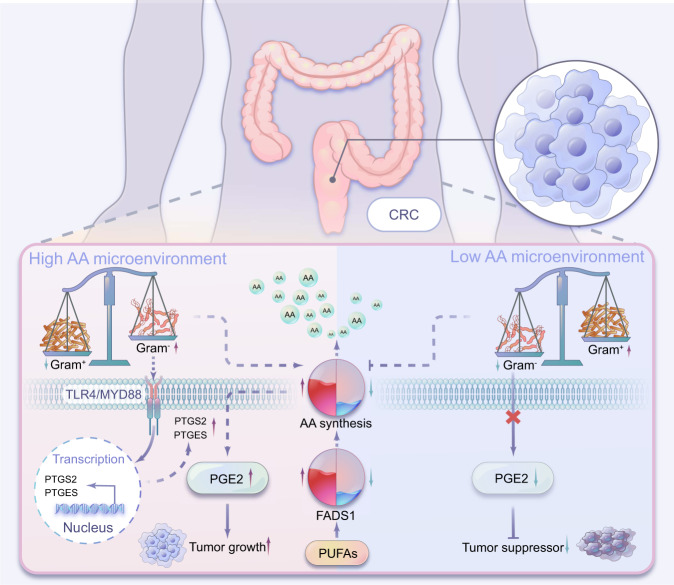
Colonocyte metabolism shapes the microbiome. Metabolites are the main mediators of information exchange between intestine and microbial communities. Arachidonic acid (AA) is an essential polyunsaturated fatty acid and its role in colorectal cancer (CRC) remains unexplored. In this study, we show that AA feeding promotes tumor growth in AOM/DSS and intestinal specific Apc-/- mice via modulating the intestinal microecology of increased gram-negative bacteria. Delta-5 desaturase (FADS1), a rate-limiting enzyme, is upregulated in CRC and effectively mediates AA synthesis. Functionally, FADS1 regulates CRC tumor growth via high AA microenvironment-induced enriched gram-negative microbes. Elimination of gram-negative microbe abolishes FADS1 effect. Mechanistically, gram-negative microbes activate TLR4/MYD88 pathway in CRC cells that contributes FADS1-AA axis to metabolize to prostaglandin E2 (PGE2). Cumulatively, we report a potential cancer-promoting mechanism of FADS1-AA axis in CRC that converts raising synthesized AA to PGE2 via modulating the intestinal microecology of gram-negative.


Conflict of interest statement

The authors declare no potential conflicts of interest.

Figures

Fig. 1
Fig. 1. The tumor-promoting effect of AA on CRC tumorigenesis.
a AA levels in paired NC, Ad and CRC samples, NC: normal intestinal epithelial tissues, Ad: colon adenoma, CRC: colorectal cancer. ***p < 0.001. (n = 15 per group, means ± s.d.; two-tailed paired t test, n = 3 technical replicates). b CRC model established by 10 mg/kg of AOM induction (i.p injection) and 2% of DSS in drinking water using C57BL/6 J mice, NC: normal feeding, AA: arachidonic acid feeding (n = 8 mice per group). c Representative images of AOM/DSS-induced tumor in full-length colons (n = 8 mice per group). Black circles showed the tumor region. d Tumor number of AOM/DSS mice for NC and AA groups (n = 8 mice per group, means ± s.d.; two-tailed unpaired t test, n = 2 biological replicates), **p = 0.003. e HE staining and PCNA expression in AOM/DSS tumors (n = 8 samples per group, 3 fields assessed per sample, Chi-square test). Scale bars, 50 μm. Tumor grade was independently assessed by two staff members of the pathology department, low grade and high grade represents low and high-grade intraepithelial neoplasia. ***p < 0.001. f AA and prostaglandins levels in tumor tissues in NC and AA groups in AOM/DSS-induced mice (n = 8 samples per group, means ± s.d., n = 3 technical replicates). Liquid chromatography-mass spectrometry (LCMS) was used to detect the index levels. g Intestine-specific Apc−/− mice generated by crossing Apcflox/flox with Lgr5-EGFP-IRES-CreERT2 mice, NC: normal feeding, AA: arachidonic acid feeding (n = 6 mice per group). h Representative images of CRC tumors in intestine-specific Apc−/− mice (n = 6 mice per group). Black circles showed the tumor region. i. Tumor number of intestine-specific Apc−/− mice for NC and AA groups (n = 6 mice per group; means ± s.d., two-tailed unpaired t test, n = 2 biological replicates). ***p < 0.001. j HE staining and PCNA expression in tumor tissues of intestine-specific Apc−/− mice (n = 6 samples per group, 3 fields assessed per sample, Chi-square test). Tumor grade was independently assessed. ***p < 0.001. Scale bars, 50 μm. k AA and prostaglandins levels in tumor tissues of intestine-specific Apc−/− mice. LCMS was used to detect the index levels. (n = 6 samples per group, means ± s.d.). Source data are provided in the Source Data file.
Fig. 2
Fig. 2. Gut microbes mediate tumor promotion via AA.
a The viability of SW480 and HCT-116 cells treated with different concentration (NC, 0.5 mg/L, 1 mg/L, 2 mg/L) of AA, and analyzed by CCK-8. ns indicates no statistical significance (n = 5 samples per group; means ± s.d., one-way repeated-measures ANOVA, n = 3 biological replicates). b EdU assay for SW480 and HCT-116 cells treated with different concentrations (NC, 0.5 mg/L, 1 mg/L, 2 mg/L) of AA (n = 5 samples per group, 3 fields assessed per sample, means ± s.d., two-tailed unpaired t test). ns indicates no statistical significance. Scale bars, 50 μm. c. 16 s rRNA sequencing in stool of C57BL6J mice divided into NC and AA groups, NC: normal feeding, AA: arachidonic acid feeding (n = 8 mice per group). d Total OTU of gut microbes in the stool of C57BL6J mice, NC: normal feeding, AA: arachidonic acid feeding (n = 8 mice per group, means ± s.d., two-tailed unpaired t test, n = 3 technical replicates). ns indicates no statistical significance. e Ratio of gram-negative bacteria to gram-positive bacteria in the stool of C57BL6J mice in NC and AA groups (n = 8 mice per group, Chi square test). *p = 0.034. f Relative abundance of bacterial OTUs in the stool of C57BL6J mice in NC and AA groups (n = 8 mice per group). g Relative abundance of Es. coli, En. faecalis and Lactobacillus in the stool and tumor tissue of AOM/DSS mice in NC and AA groups (n = 8 mice per group, means ± s.d., two-tailed unpaired t test, n = 3 technical replicates). *p = 0.016, 0.039, 0.018, 0.041, 0.012, 0.045. h Representative images of AOM/DSS tumors with NC or AA feeding under different antibiotics treatment (Quadruple-antibiotics, 0.2 g/L of aztreonam, 0.1 g/L of vancomycin) (n = 6 mice per group). Black circles showed tumor region. i Tumor number of AOM/DSS-induced mice with NC or AA feeding under different antibiotics treatment (n = 6 mice per group; means ± s.d., two-tailed unpaired t test). ***p < 0.001(compared with NC group). j HE staining and PCNA expression in AOM-induced tumors with NC or AA feeding under different antibiotics treatment (n = 6 samples per group, 3 fields assessed per sample). Scale bars, 50 μm. Source data are provided in the Source Data file.
Fig. 3
Fig. 3. FADS1 is upregulated in CRC and controls AA synthesis.
a The mRNA expression of FADS1, FADS2, FADS3, ELOVL2, and ELOVL5 in 17 cases of paired NC and CRC samples from GDS4382, NC: normal colon epithelial tissue, CRC: colorectal cancer. ***p < 0.001. ns indicates no statistical significance. b EPA levels in 15 cases of paired NC, Ad and CRC samples. ns indicates no statistical significance. (n = 15 samples per group, means ± s.d.; two-tailed paired t test, n = 3 technical replicates). c. Correlation between FADS1 expression and AA or EPA levels in 15 cases of paired NC, Ad and CRC samples. The mRNA expression of FADS1 was detected by q-PCR. r indicates correlation coefficient. p value indicates statistical difference (n = 15 per group, means ± s.d.; Pearson correlation test, n = 3 technical replicates). d Total AA and EPA levels in SW480 and HCT116 cells transfected with shNC or shFADS1. ***p < 0.001. ns indicates no statistical significance (n = 3 samples per group, means ± s.d.; two-tailed unpaired t test, n = 3 biological replicates). e AA/EPA ratio in SW480 and HCT116 cells transfected with shNC or shFADS1 (n = 3 biological replicates). f. AA levels in culture medium from SW480 and HCT116 cells transfected with shNC or shFADS1, under activation with 0.5 μg/ml and 1 μg/ml of LPS, respectively (n = 3 samples per group, means ± s.d.; two-tailed unpaired t test, n = 3 biological replicates). CRC cells were cultured with FBS-free medium before LPS activation. ***p < 0.001. g EPA levels in culture medium of SW480 and HCT116 cells transfected with shNC or shFADS1, under activation with 0.5 μg/ml and 1 μg/ml of LPS, respectively (n = 3 samples per group, means ± s.d.; two-tailed unpaired t test, n = 3 biological replicates). CRC cells were cultured with FBS-free medium before LPS activation. ***p < 0.001. h AA/EPA ratio in culture medium of SW480 and HCT116 cells transfected with shNC or shFADS1, under activation with 0.5 μg/ml and 1 μg/ml of LPS, respectively (n = 3 biological replicates). CRC cells were cultured with FBS-free medium before LPS activation. Source data are provided in the Source Data file.
Fig. 4
Fig. 4. Gut microbes mediate tumor promotion of FADS1 in CRC.
a An orthotopic tumor model of CRC was established by injecting SW480Luc cells or HCT116Luc cells into the wall of the cecum of BALB/C null mice. b Computed tomography (CT) with 3D organ reconstruction bioluminescence imaging of the orthotopic tumor of BALB/C null mice injected with shNC and shFADS1 SW480Luc cells (n = 6 mice per group, means ± s.d.; two-tailed unpaired t test). Gut microbes were deleted by quadruple antibiotics for two weeks. The yellow signal represents intestine, the green signal represents colon and the red signal represents tumor. Scale colour bar: 1×10⁶−1.00×10⁷. **p = 0.007. c CT with 3D organ reconstruction bioluminescence imaging of orthotopic tumors in BALB/C null mice injected with shNC and shFADS1 HCT116Luc cells (n = 6 mice per group, means ± s.d.; two-tailed unpaired t test). Gut microbes were deleted by quadruple antibiotics for two weeks. The yellow signal represents intestine, the green signal represents colon and the red signal represents tumor. Scale colour bar: 1×10⁶−1.00×10⁷. **p = 0.004. d Ratio of gram-negative and gram-positive bacteria in the orthotopic tumors of BALB/C null mice injected with shNC and shFADS1 cells (n = 6 mice per group, Chi square test, n = 3 technical replicates). *p = 0.037, 0.031. e Relative abundance of Es. coli, En. faecalis and Lactobacillus in the orthotopic tumor injected with shNC and shFADS1 cells (n = 6 mice per group, Box plots: Min to Max; two-tailed unpaired t test). **p = 0.008, 0.009, 0.005, 0.002, 0.004, 0.005. f IVIS imaging of the orthotopic tumor in the cecum of BALB/C null mice injected with shNC and shFADS1 SW480Luc cells (n = 6 mice per group, means ± s.d.; two-tailed unpaired t test), gut microbes were selectively deleted by 0.2 g/L aztreonam or 0.1 g/L vancomycin treatment for two weeks. Scale colour bar: 3.96×10⁷−1.55×10⁸. ***p < 0.001, ns indicates no statistical significance. Source data are provided in the Source Data file.
Fig. 5
Fig. 5. Gram-negative gut microbes contribute to PGE2 production.
a GSEA analysis of FADS1 expression in CRC, as evaluated from the TCGA dataset (440 CRC samples) and divided into high and low FADS1 expression (220 samples each) groups. NES, normalized enrichment score, p, statistical significance. b PGE2 level in the tumor tissues of AOM/DSS or intestine-specific Apc−/− mice with fecal transplants of NC or AA feeding (n = 6 mice per group, means ± s.d.; two-tailed unpaired t test, n = 3 technical replicates). ***p < 0.001. c PGE2 levels in the tumor tissues of the orthotopic tumors induced by SW480 and HCT116 cells transfected with shFADS1 or shNC (n = 6 mice per group, means ± s.d.; two-tailed unpaired t test, n = 3 technical replicates). ***p < 0.001. d PGE2 level in the orthotopic tumors induced by SW480 and HCT116 cells transfected with shFADS1 or shNC, gut microbes eliminated with quadruple antibiotics (n = 6 mice per group, means ± s.d.; two-tailed unpaired t test, n = 3 technical replicates). ns indicates no statistical significance. e PGE2 levels in SW480 and HCT116 cells transfected with shFADS1 or shNC. ns indicates no statistical significance. (n = 3 independent experiments). f PGE2 levels in SW480 and HCT116 cells transfected with shFADS1 or shNC, activated by 1 μg/ml of LPS (n = 3 per group, means ± s.d.; two-tailed unpaired t test, n = 3 technical replicates). ***p < 0.001. g Representative IHC images of Ptges and Ptgs2 expression in tumor tissues of AOM/DSS or intestine-specific Apc −/− mice, with a fecal transplant from AA or NC feeding (n = 6 samples per group, 3 fields assessed per sample). Scale bars, 50 μm. h PTGES and PTGS2 expression in the tumor tissues of the orthotopic tumors transfected with shFADS1 or shNC, gut microbes eliminated with quadruple antibiotics (n = 6 mice per group). PTGES and PTGS2 expression were detected by western blot. The grayscale values of the WB bands are quantitatively represented (n = 3 technical replicates). i PTGES and PTGS2 expression in SW480 and HCT116 cells transfected with shFADS1 or shNC activated by 1 μg/ml of LPS. PTGES and PTGS2 expression were detected by western blot (n = 3 technical replicates). Source data are provided in the Source Data file.
Fig. 6
Fig. 6. The TLR4/MYD88 pathway is involved in the gut microbe-mediated PGE2 production.
a PGE2 levels in SW480 and HCT116 cells transfected with siTLR4, activated by 1 μg/ml of LPS (n = 3 per group, means ± s.d.; two-tailed unpaired t test, n = 3 biological replicates). ***p < 0.001. b PGE2 level in SW480 and HCT116 cells transfected with siMYD88, activated by 1 μg/ml of LPS (n = 3 per group, means ± s.d.; two-tailed unpaired t test, n = 3 biological replicates). ***p < 0.001. c TLR4 and MYD88 expression in SW480 and HCT116 cells transfected with shFADS1 or shNC. TLR4 and MYD88 expression were detected by q-PCR and western blot. The grayscale values of the WB bands are quantitatively represented (n = 3 biological replicates). d The mRNA expression of PTGES and PTGS2 in SW480 and HCT116 cells transfected with siTLR4 and siMYD88, activated by 1 μg/ml of LPS (n = 3 per group, means ± s.d.; two-tailed unpaired t test, n = 3 biological replicates). ***p < 0.001. e The protein expression of PTGES and PTGS2 in SW480 and HCT116 cells transfected with siTLR4 and siMYD88, activated by 1 μg/ml of LPS. The grayscale values of the WB bands are quantitatively represented (n = 3 biological replicates). f Viability of SW480 and HCT116 cells transfected with siTLR4, siMYD88, siPTGES, siPTGS2 and siNC, activated by 1 μg/ml of LPS, rescued by adding 1 mg/L of PGE2 (n = 5 samples per group; means ± s.d., one-way repeated-measures ANOVA, n = 3 biological replicates). ***p < 0.001, ns indicates no statistical significance. Source data are provided in the Source Data file.
Fig. 7
Fig. 7. FADS1 predicts a poor prognosis in CRC.
a The mRNA expression of FADS1 in NC (n = 13 samples), Ad (n = 50 samples), and CRC (n = 25 samples) samples from GSE41657 (means ± s.d.; two-tailed unpaired t test), NC: normal colon epithelial tissue, Ad: colon adenoma, CRC: colorectal cancer. **p = 0.008, 0.007. b Kaplan–Meier analysis of the relationship between the FADS1 mRNA expression and prognosis of CRC patients from the TCGA dataset, FADS1-low: CRC patients with a low mRNA expression of FADS1 (n = 220), FADS1-high: CRC patients with a high mRNA expression of FADS1 (n = 220). p value showed the statistical difference. c. Representative images of IHC staining of the FADS1 expression in matched NC, Ad, and CRC tissues (n = 6 samples per group, one-way repeated-measures ANOVA), NC: normal colon epithelial tissue, Ad: colon adenoma, CRC: colorectal cancer. IHC score was divided into Low and High groups, Low, score 1 or 2, High, score 3 or 4. *p = 0.029. d Representative images of IHC staining of the FADS1 expression in CRC and adjacent non-cancerous tissues of the tissue microarray (392 cases). Scale bars, 100 μm. e Representative images of IHC staining of the FADS1 expression in CRC tissues with different pathological stages. Scale bars, 100 μm. f Correlation between the pathological stage and FADS1 expression in CRC and adjacent non-cancerous tissues of the tissue microarray (392 cases). Both variables are hierarchical data and rank sum test was used to statistical analysis. p = 0.034. g Kaplan–Meier analysis of the relationship between the FADS1 protein expression and prognosis of CRC patients from the tissue microarray, FADS1-low: CRC patients with a low protein expression of FADS1 (n = 196), FADS1-high: CRC patients with a high protein expression of FADS1 (n = 196). p = 0.027. h Multivariate Cox regression analysis of clinicopathologic factors for the FADS1 expression applied in the Renji cohort (n = 392). HR, hazard ratio, 95% CI, 95% confidence interval. p = 0.001, 0.533, 0.919, 0.004, <0.001. i IVIS imaging of the orthotopic tumor treated with FADS1 inhibitor, D5D-IN-326 (2 mg/kg, p.o. for 2 weeks) (n = 6 mice per group, means ± s.d.; two-tailed unpaired t test). ***p < 0.001. Scale colour bar (SW480): 1×10⁷−1×10⁸, Scale colour bar (HCT-116): 1×10⁷−5×10⁸, Scale colour bar (organoid): 2.52×10⁷−4.26×10⁸. j Survival analysis of the mice burden with the orthotopic tumors treated with D5D-IN-326 (n = 6 mice per group, Kaplan–Meier analysis). p = 0.003, 0.008, 0.006. Source data are provided in the Source Data file.
Fig. 8
Fig. 8. The mechanism diagram of this study.
FADS1-AA axis in CRC cells that modulate the intestinal microecology of enriched gram-negative bacteria via creating a high AA microenvironment. Enriched gram-negative microecology accelerated AA converting to PGE2 and eventually promotes CRC tumorigenesis.

References

    1. Wang B, Timilsena YP, Blanch E, Adhikari B. Lactoferrin: Structure, function, denaturation and digestion. Crit. Rev. food Sci. Nutr. 2019;59:580–596. doi: 10.1080/10408398.2017.1381583. - DOI - PubMed
    1. Judkins TC, Archer DL, Kramer DC, Solch RJ. Probiotics, Nutrition, and the Small Intestine. Curr. Gastroenterol. Rep. 2020;22:2. doi: 10.1007/s11894-019-0740-3. - DOI - PubMed
    1. Rohrhofer J, Zwirzitz B, Selberherr E, Untersmayr E. The Impact of Dietary Sphingolipids on Intestinal Microbiota and Gastrointestinal Immune Homeostasis. Front. Immunol. 2021;12:635704. doi: 10.3389/fimmu.2021.635704. - DOI - PMC - PubMed
    1. Tuganbaev T, et al. Diet Diurnally Regulates Small Intestinal Microbiome-Epithelial-Immune Homeostasis and Enteritis. Cell. 2020;182:1441–1459. e21. doi: 10.1016/j.cell.2020.08.027. - DOI - PubMed
    1. Loke YL, Chew MT, Ngeow YF, Lim WWD, Peh SC. Colon Carcinogenesis: The Interplay Between Diet and Gut Microbiota. Front. Cell. Infect. Microbiol. 2020;10:603086. doi: 10.3389/fcimb.2020.603086. - DOI - PMC - PubMed

Publication types

MeSH terms