. 2023 Apr 11;13(1):5891.
doi: 10.1038/s41598-023-32720-3.

Characterisation of NPFF-expressing neurons in the superficial dorsal horn of the mouse spinal cord

Affiliations

Characterisation of NPFF-expressing neurons in the superficial dorsal horn of the mouse spinal cord

Raphaëlle Quillet et al. Sci Rep. .

Abstract

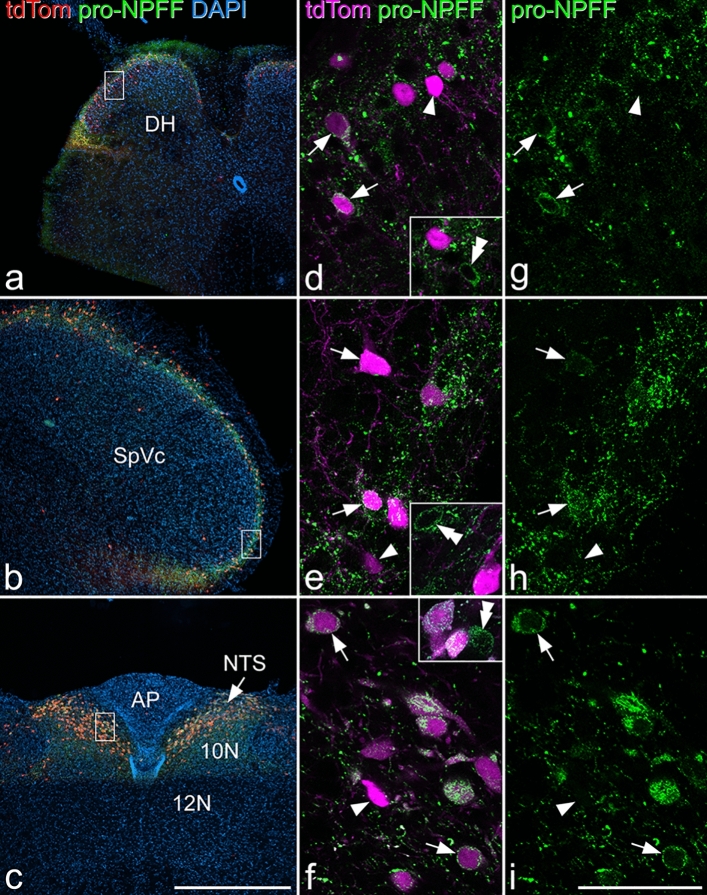
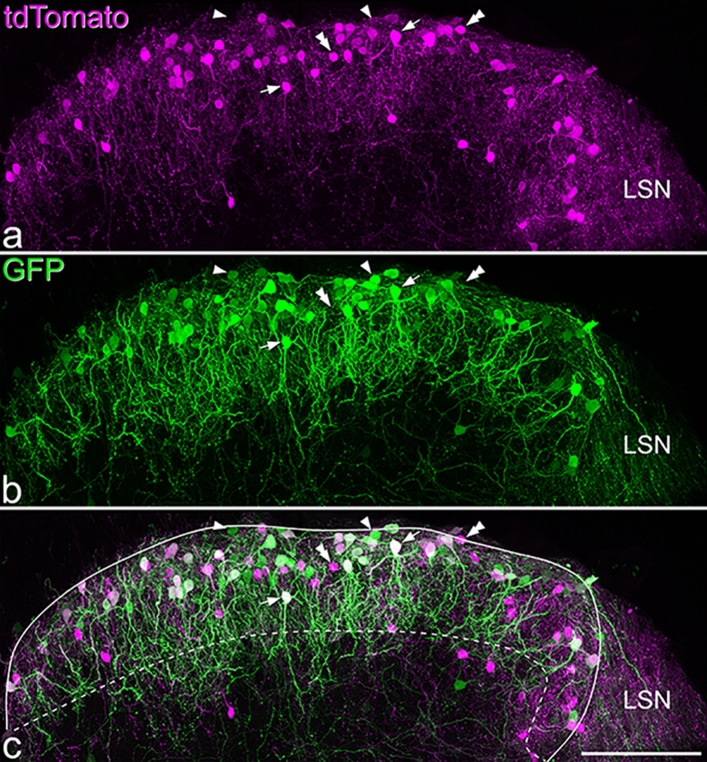
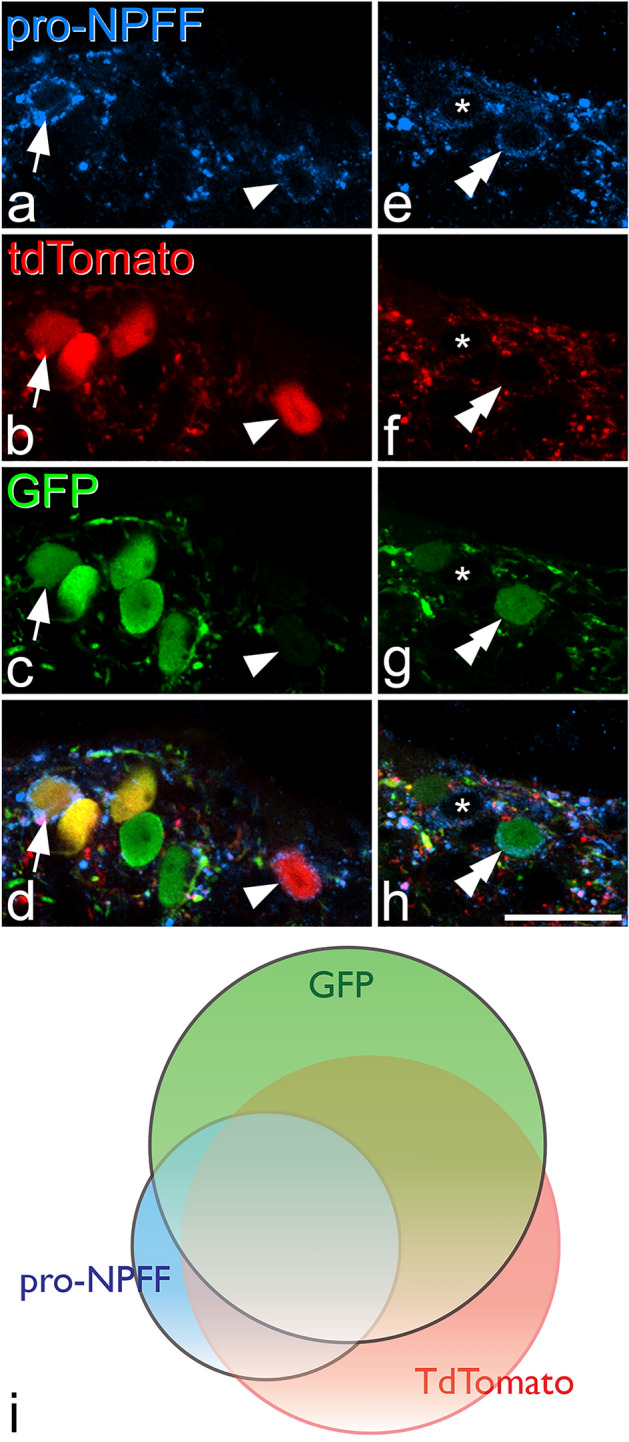
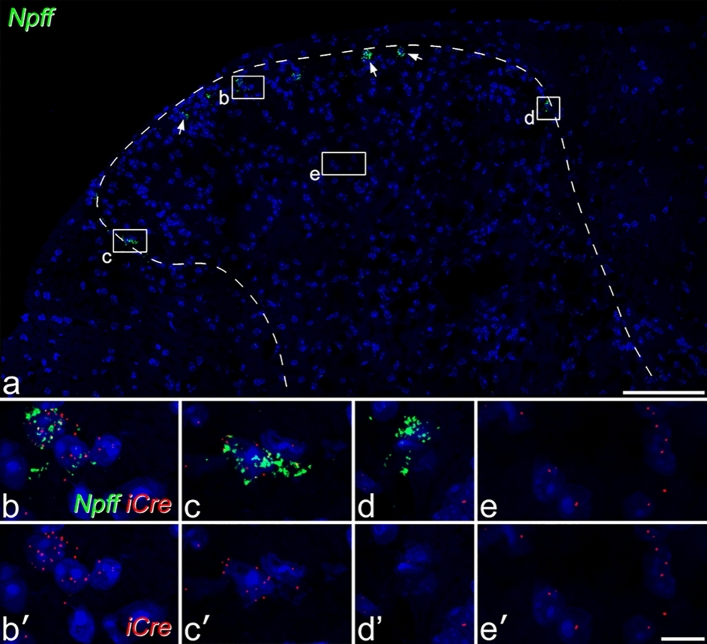
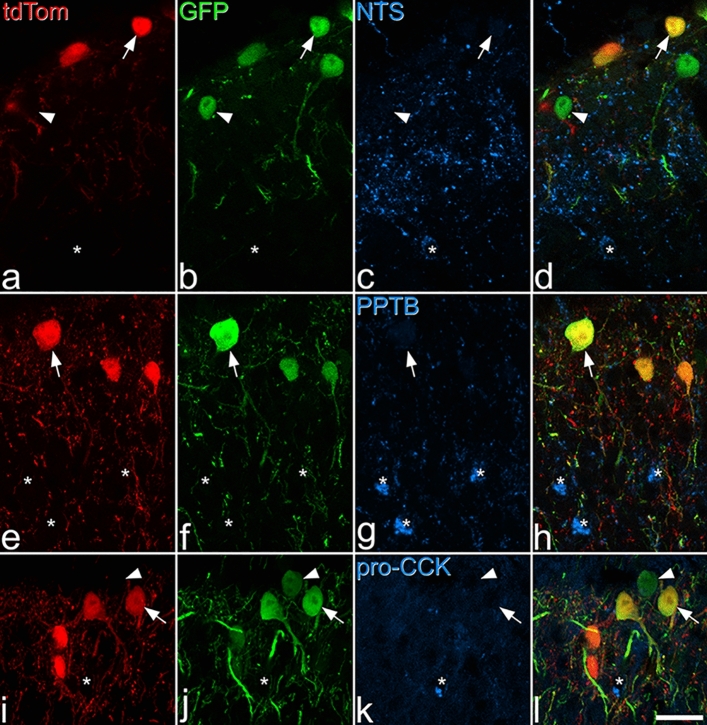
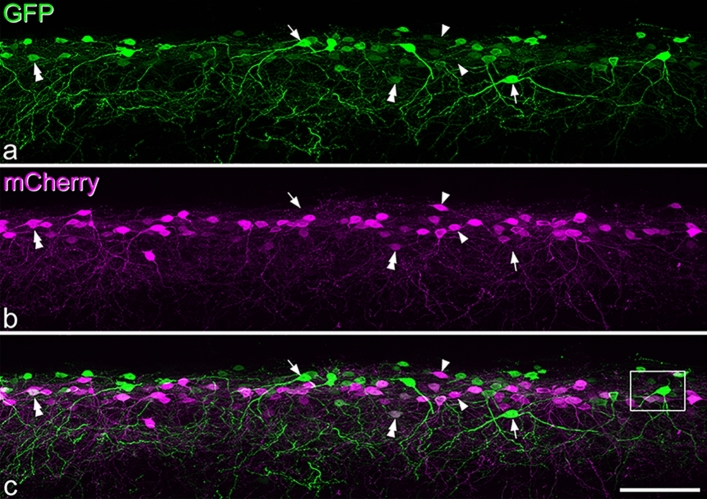
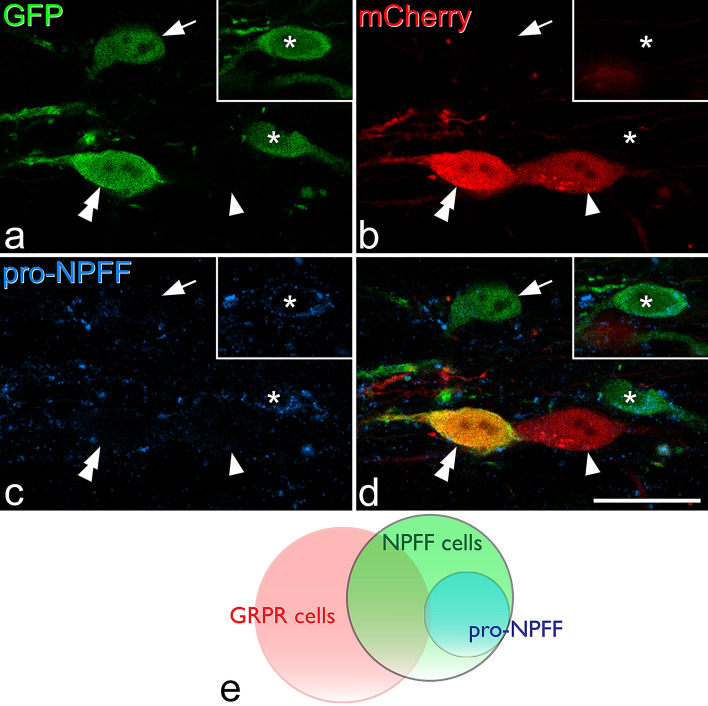
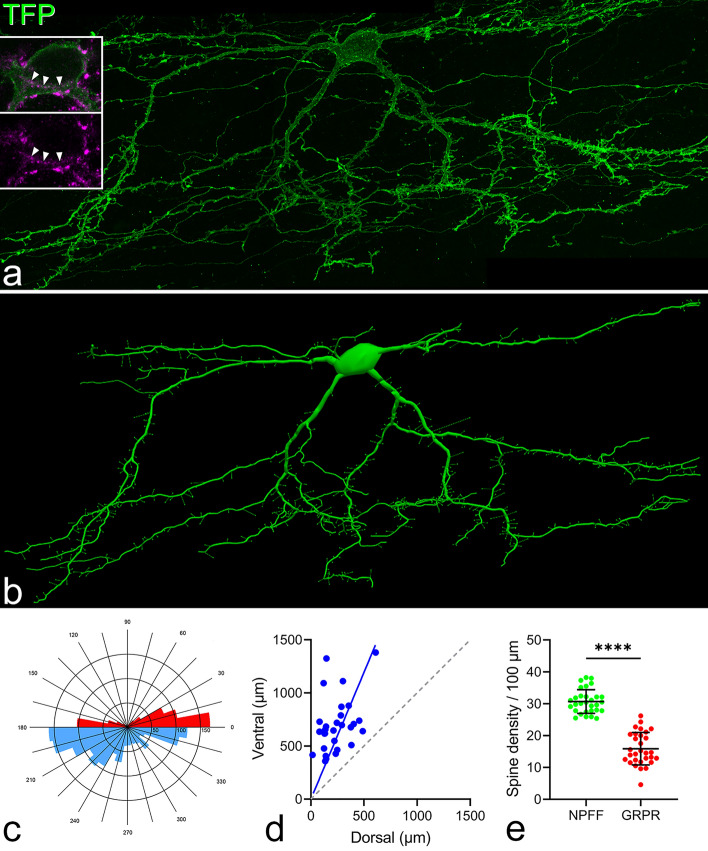
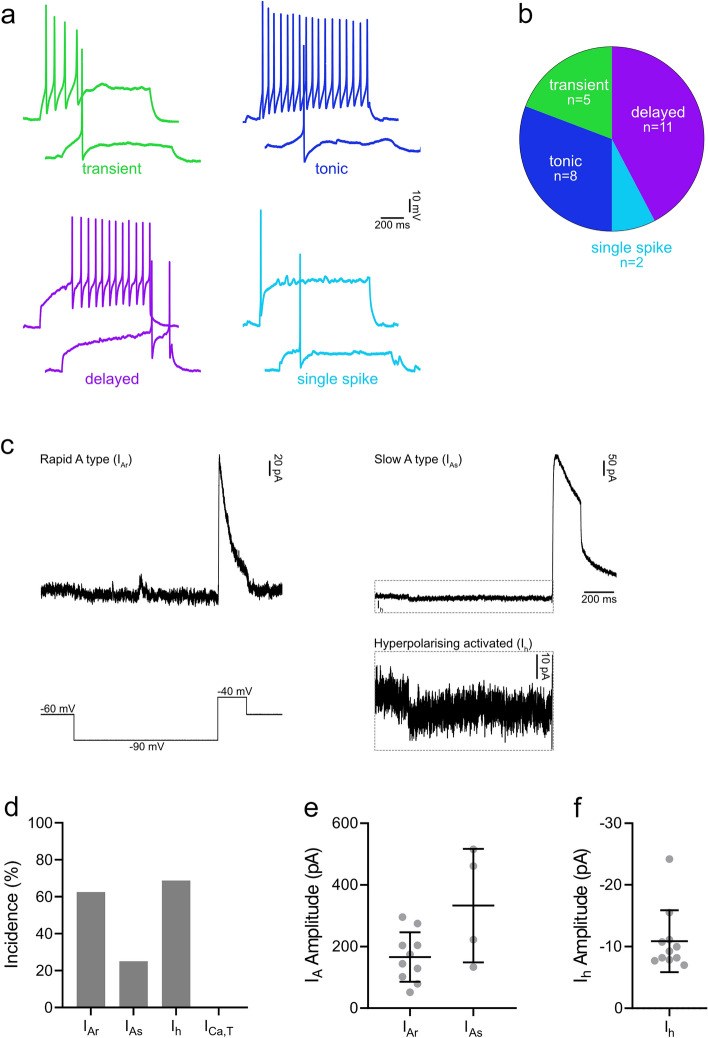
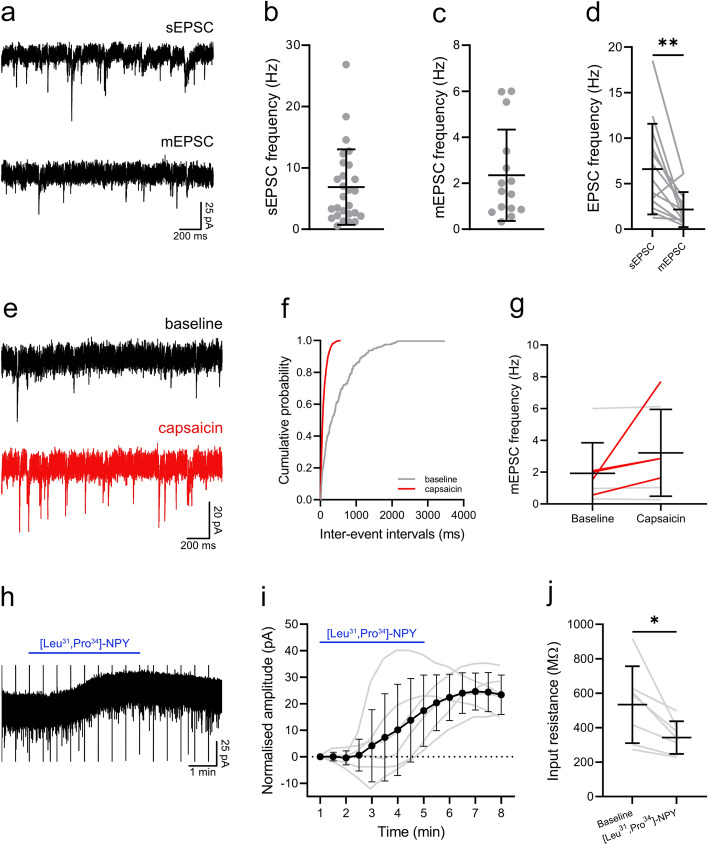
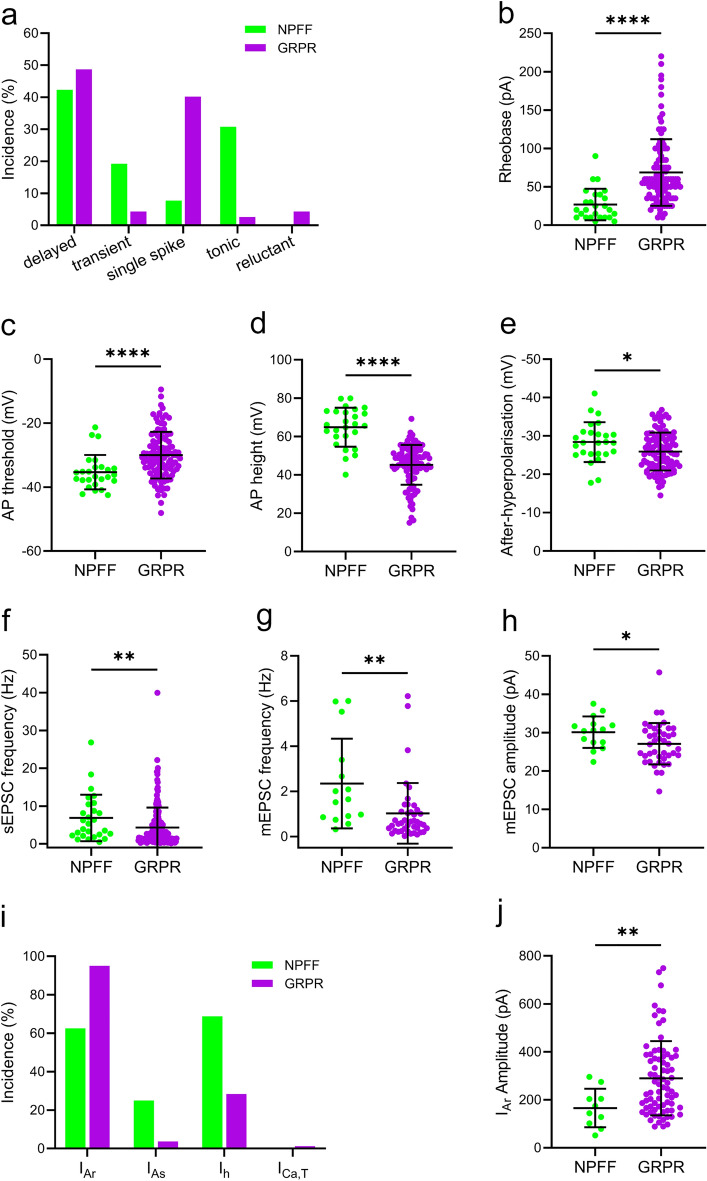
Excitatory interneurons in the superficial dorsal horn (SDH) are heterogeneous, and include a class known as vertical cells, which convey information to lamina I projection neurons. We recently used pro-NPFF antibody to reveal a discrete population of excitatory interneurons that express neuropeptide FF (NPFF). Here, we generated a new mouse line (NPFFCre) in which Cre is knocked into the Npff locus, and used Cre-dependent viruses and reporter mice to characterise NPFF cell properties. Both viral and reporter strategies labelled many cells in the SDH, and captured most pro-NPFF-immunoreactive neurons (75-80%). However, the majority of labelled cells lacked pro-NPFF, and we found considerable overlap with a population of neurons that express the gastrin-releasing peptide receptor (GRPR). Morphological reconstruction revealed that most pro-NPFF-containing neurons were vertical cells, but these differed from GRPR neurons (which are also vertical cells) in having a far higher dendritic spine density. Electrophysiological recording showed that NPFF cells also differed from GRPR cells in having a higher frequency of miniature EPSCs, being more electrically excitable and responding to a NPY Y1 receptor agonist. Together, these findings indicate that there are at least two distinct classes of vertical cells, which may have differing roles in somatosensory processing.


Conflict of interest statement

The authors declare no competing interests.

Figures

Figure 1
Figure 1
tdTomato-positive cells in the NPFFCre;Ai9 mouse. (a), (b) and (c) show low-magnification views through the spinal cord, spinal trigeminal nucleus and nucleus tractus solitarius (NTS), respectively. Cells labelled with tdTomato (tdTom; red) are present at a high density in the superficial parts of the spinal and trigeminal dorsal horns and in the NTS. (d-i) higher magnification images from regions shown in the boxes in (ac). TdTomato is shown in magenta, and pro-NPFF immunostaining in green. Several td-Tomato-containing cells are pro-NPFF-immunoreactive, and some of these are marked with arrows. Arrowheads in these images indicate tdTomato-containing cells that do not contain detectable pro-NPFF. Insets in (df) include cells that are pro-NPFF-immunoreactive, but do not contain tdTomato (double arrowheads). Quantitative analysis of the superficial dorsal horn of the spinal cord revealed that 38% of tdTomato-labelled cells were pro-NPFF-immunoreactive, while 83% of pro-NPFF-immunoreactive cells were tdTomato-positive. Images in (a), (b) and (c) are maximum intensity projections of 4, 7 and 14 optical sections, respectively, each at 4 μm z-separation. Main images and insets in (d), (g), (e) and (h) are projections of 2 images at 1 μm z-separation. Main images in (f) and (i) are single optical sections, while insets are projections of 3 optical sections at 1 μm z-separation. Scale bars: a-c = 500 μm, d-i = 50 μm. Abbreviations: AP, area postrema; DH, dorsal horn; NTS, nucleus tractus solitarius; SpVc, spinal trigeminal nucleus caudal part; 10N, motor nucleus of vagus; 12N, hypoglossal nucleus.
Figure 2
Figure 2
The distribution of tdTomato- and GFP-labelled cells in the L3 segment of the spinal cord of a NPFFCre;Ai9 mouse that had received intraspinal injections of AAV.flex.GFP. a and b show that both tdTomato- and GFP-positive cells are largely restricted to the superficial dorsal horn. c: the merged image reveals that many cells contain both fluorescent proteins (some indicated with arrows), while some cells are positive for only GFP or tdTomato (some of these are marked with single or double arrowheads, respectively). Dendritic labelling is more prominent in the GFP image, and dendrites of these cells commonly project ventrally into the deeper regions of the dorsal horn. Some labelling with each fluorescent protein is seen in the lateral spinal nucleus (LSN), but labelled cell bodies are seldom seen here. We found that 48% of labelled cells contained both fluorescent proteins, 30% only contained GFP and 22% contained only tdTomato. The solid and dashed lines in c indicate the edge of the grey matter and the approximate border between laminae II and III, respectively. Images are projections of 58 optical sections at 1 μm z-separation. Scale bar = 100 μm.
Figure 3
Figure 3
The relation of pro-NPFF immunoreactivity to expression of tdTomato and GFP in a NPFFCre mouse following intraspinal injection of AAV.flex.GFP. (a)–(d): show part of the section illustrated in Fig. 2 scanned to reveal immunostaining for pro-NPFF (blue) as well as expression of tdTomato (red) and GFP (green). Two pro-NPFF-positive cells can be identified by the presence of immunoreactivity in the perikaryal cytoplasm, which surrounds the unstained nucleus. One of these cells (arrow) contains both fluorescent proteins, while the other (arrowhead) contains tdTomato but lacks GFP. (e)–(h): a nearby field from the same section. Again, this contains two pro-NPFF-positive cells, but in this case one is GFP + /tdTomato-negative (double arrowhead), and the other (asterisk) lacks both fluorescent proteins. Among pro-NPFF-immunoreactive cells, 67% were labelled with both GFP and tdTomato, 7.7% only with GFP, 13.5% only with tdTomato, while 11.9% did not contain either fluorescent protein. All images are projections of 2 optical sections at 1 μm z-separation. (i): Venn diagram showing the extent of overlap of cells labelled with GFP (green), tdTomato (pink) or pro-NPFF-immunoreactivity (blue). Scale bar for (a)–(h) = 10 μm.
Figure 4
Figure 4
Fluorescence in situ hybridisation labelling for iCre and Npff in the lumbar spinal cord. (a) shows labelling for Npff mRNA (green) in a section counterstained with NucBlue (blue). Several Npff-positive cells are present in the superficial dorsal horn, and some of these are indicated with arrows. Boxes indicate the locations of the regions shown in (b)–(e). Note that labelling for iCre mRNA is not visible at this magnification. (b)–(e): higher magnification views showing the relationship between mRNAs for Npff (green) and iCre (red). Most of the cells with Npff also contain several particles representing iCre, and examples are shown in (b) and (c). However, some Npff-positive cells are negative for iCre, and an example is shown in (d). Throughout the dorsal horn, many cells that lack Npff contain a small number of particles corresponding to iCre as shown in (e). All images are maximum intensity projections of 30 confocal optical sections at 0.5 μm z-spacing. Scale bars: (a) = 100 μm, (b)–(e) = 10 μm.
Figure 5
Figure 5
Lack of expression of neuropeptides associated with certain excitatory interneuron populations by NPFF-Cre neurons. Sections from NPFFCre;Ai9 mice that had been injected with AAV.flex.GFP were reacted with antibodies against neurotensin (NTS) (a)–(d), preprotachykinin B (PPTB) (e)–(h), or pro-CCK (i)–(l). Some cells that express both tdTomato and GFP are indicated with arrows, and some that only contain GFP with arrowheads. Cells that are immunoreactive for each of the peptide antibodies are indicated with asterisks. Note that staining for these peptides is located within the perikaryal cytoplasm of labelled neurons, and that there is no overlap with cells containing the fluorescent proteins. A few tdTomato-positive/GFP-negative cells were immunoreactive for neurotensin (1.3%) or pro-CCK (2.3%), whereas none contained PPTB. None of the GFP cells were immunroeactive for any of these (pro)peptides. Images are projections of 3 (ah) or 5 (il) optical sections at 1 μm z-spacing. Scale bar = 20 μm.
Figure 6
Figure 6
Expression of fluorescent proteins in NPFFCre;GRPRFlp mice that had been injected with AAVs coding for Cre-dependent GFP and Flp-dependent mCherry. (a) and (b) show immunostaining for GFP and mCherry, respectively, in a sagittal section, and (c) is a merged image. There are numerous cells with GFP and/or mCherry expression in the superficial dorsal horn. Arrows, arrowheads and double arrowheads show examples of cells that are labelled only with GFP, only with mCherry or with both GFP and mCherry, respectively. Quantitative analysis showed that 39% of GFP-positive cells also contained mCherry, while 36% of mCherry cells were also GFP-positive. The box shows the approximate position of the field illustrated at higher magnification in Fig. 7. Scale bar = 100 μm.
Figure 7
Figure 7
Immunostaining for pro-NPFF in a section obtained from a NPFFCre;GRPRFlp mouse that had been injected with AAVs coding for Cre-dependent GFP and Flp-dependent mCherry. (ac) show staining for GFP (green), mCherry (red) and pro-NPFF (blue) in a single confocal optical section, while (d) shows a merged image. The arrow and asterisk mark cells that are positive for GFP and negative for mCherry. The cell indicated with the asterisk contains pro-NPFF, and this is seen more clearly in a different optical section (inset). The cell marked with the arrow lacks pro-NPFF. The cells indicated with single and double arrowheads are both positive for mCherry. One of them (double arrowheads) is also labelled with GFP, while the other (single arrowhead) is not. Both of these cells lack pro-NPFF-immunoreactivity. (e) Venn diagram showing the relationship between cells labelled with each fluorescent protein and pro-NPFF immunoreactivity. pro-NPFF was present in 0.4% of GRPR cells (labelled with mCherry), 25% of NPFF cells (labelled with GFP) and 42% of the cells that were GFP-positive/mCherry-negative. Scale bar = 20 μm.
Figure 8
Figure 8
Dendritic morphology of NPFF cells revealed with the viral Brainbow technique. (a): a maximum intensity projection (99 optical sections at 0.5 μm z-separation) showing part of a sagittal section from a NPFFCre mouse that had received intraspinal injections of Brainbow AAVs. The section has been scanned to reveal TFP (green), and examination of confocal images showed that this was the only labelled cell within this field. Insets show labelling for TFP (green) and immunostaining for pro-NPFF (magenta) in a more restricted projection (4 optical sections). The cell body contains pro-NPFF immunoreactivity, which occupies part of the perikaryal cytoplasm, and this is marked by arrowheads. There are also pro-NPFF-immunoreactive profiles outside the cell body, and these are likely to be pro-NPFF-containing axons that may be forming synapses on the Brainbow-labelled cell. (b): a Neurolucida reconstruction of the cell shown in (a). Positions of dendritic spines are shown, although the sizes of the spine heads and shapes of spine necks in this drawing do not represent the actual sizes and shapes of these structures. Note the high density of dendritic spines on this cell. (c): a polar histogram for this cell. Dorsally directed dendrites are shown in red and ventrally directed dendrites in blue. (d): A plot of the ratio of the lengths of ventrally-directed (ventral) to the lengths of dorsally-directed (dorsal) dendrites obtained from polar histograms for the 30 NPFF cells analysed in this study. The blue line shows the mean ratio for these cells, while the black dashed line corresponds to a ratio of 1. (e): Comparison of the dendritic spine density between the 30 NPFF cells labelled with the Brainbow technique and 30 GRPR cells labelled with the same method from Polgár et al. Scale bar (a, b) = 50 μm.
Figure 9
Figure 9
Action potential firing patterns and subthreshold voltage-activated currents in NPFF cells. (a) Examples of action potential firing patterns observed in NPFF cells in response to 1 s suprathreshold current injections. (b) The most prominent type of firing pattern seen in NPFF cells was delayed firing (11/26; 42.3%), with smaller proportions exhibiting tonic (8/26; 30.8%), transient (5/26: 19.2%) or single spike firing (2/26: 7.7%). (c) Representative traces demonstrating the subthreshold voltage-activated currents in NPFF cells that were revealed using a voltage step protocol that hyperpolarised cells from -60 to -90 mV for 1 s and then depolarised cells to -40 mV for 200 ms (bottom left trace). The currents that are revealed by this protocol were classified as rapid (IAr) or slow (IAs) A-type potassium currents, or hyperpolarising-activated currents (Ih). The example traces of IAr (top left) and IAs with Ih (top right) show an average of 5 traces. The example of Ih (dashed outline) is shown at a different y-axis scale (bottom right). (d) Almost all NPFF cells displayed IA, which was mostly classified as IAr (10/16; 62.5%), but with some exhibiting IAs (4/16; 25.0%). Many cells exhibited Ih (11/16; 68.8%), which was typically seen in addition to IAr (5/16; 31.3%) or IAs (4/16; 25.0%). The peak amplitude of IA was 165.7 ± 80.3 and 333.0 ± 184.1 pA for IAr and IAs, respectively (e) and the amplitude of Ih, measured during the final 200 ms of the hyperpolarising step, was -10.9 ± 5.0 pA (f).
Figure 10
Figure 10
Excitatory synaptic input to NPFF cells and responses to capsaicin and the neuropeptide Y1 receptor agonist, [Leu,Pro]-NPY. (a) Example traces of spontaneous (top) and miniature (bottom) EPSCs recorded in the same NPFF cell. The frequency of the sEPSCs was 6.9 ± 6.1 Hz, n = 27 (b) and the frequency of the mEPSCs was 2.3 ± 2.0 Hz, n = 15 (c). (d) In those cells where both sEPSCs and mEPSCs were recorded, the sEPSC frequency was significantly greater 6.6 ± 5.0 vs. 2.2 ± 1.9 Hz; P = 0.003, paired t test, n = 13. The functional expression of TRPV1 channels on primary afferent input to NPFF cells was assessed by recording mEPSCs in response to the application of the TRPV1 agonist, capsaicin. (e) Representative traces of mEPSCs recorded before (baseline: top) and during application of capsaicin (bottom). (f) Example cumulative probability plot demonstrates a significant leftward shift in the distribution of interevent intervals in response to capsaicin (P < 0.00001, Kolmogorov–Smirnov 2-sample test). A significant leftward shift in mEPSC interevent intervals, signifying an increase in mEPSC frequency, was seen in 4 of 7 cells treated with capsaicin (g). In those cells that responded to capsaicin, the mEPSC frequency was increased from 1.5 ± 0.7 to 3.8 ± 2.7 Hz, n = 4 (red lines), while in the remaining 3 cells (grey lines) mEPSC frequency was 2.4 ± 3.1 and 2.5 ± 3.2 Hz prior to and during capsaicin application, respectively. Responses of NPFF neurons to the neuropeptide Y1 receptor agonist, [Leu,Pro]-NPY, were assessed and an example trace is shown in (h). (i) All six NPFF cells tested displayed a clear outwards current in response to [Leu,Pro]-NPY, which also resulted in a significant reduction in input resistance from 533.5 ± 223.5 to 342.3 ± 95.0 MΩ, P = 0.016, Wilcoxon matched-pairs signed rank test (j).
Figure 11
Figure 11
Comparison of the electrophysiological properties of NPFF cells with those of GRPR cells. Data for the GRPR cells was obtained from Polgár et al. (a) The incidence of action potential firing patterns differed between NPFF and GRPR cells. NPFF cells exhibited a greater proportion of tonic (30.8 vs. 2.6%) and initial burst firing (19.2 vs. 4.3%) cells and fewer single spike firing cells (7.7 vs. 40.2%). The incidence of delayed firing was similar between both cell types (42.3 vs. 48.7%). NPFF cells were found to have a lower rheobase (26.9 ± 20.5 v.s 68.7 ± 43.4 pA, P < 0.0001, b), action potential voltage threshold (-35.3 ± 5.4 vs. -30.0 ± 7.3 mV, P < 0.0001, c) and a greater action potential height (64.8 ± 10.2 vs. 45.2 ± 10.4 mV, P < 0.0001, d) and after-hyperpolarisation (-28.4 ± 5.2 vs. − 25.9 ± 4.9 mV, P = 0.024, e). In terms of excitatory synaptic input, sEPSC (6.86 ± 6.15 vs. 4.34 ± 5.26 Hz, P = 0.005, f) and mEPSC (2.35 ± 1.99 vs. 1.02 ± 1.34 Hz, P = 0.002, g) frequency in NPFF cells was greater than that in GRPR cells, as was the mEPSC amplitude (30.1 ± 4.1 vs. 27.1 ± 5.4 pA, P = 0.023, h). (i) The incidence of subthreshold voltage-activated currents differed between NPFF and GRPR cells. NPFF cells demonstrated a higher incidence of IAs (25.0 vs. 3.7%) and Ih (68.8 vs. 28.4%), but a lower incidence of IAr (62.5 vs. 95.1%). (j) The peak amplitude of the IAr recorded in NPFF cells was significantly lower than for GRPR cells (165.7 ± 80.3 vs. 289.7 ± 154.7, P = 0.007). All statistical comparisons made using a Mann Whitney test, except for afterhyperpolarisation, which was compared using an unpaired t test.

References

    1. Braz J, Solorzano C, Wang X, Basbaum AI. Transmitting pain and itch messages: A contemporary view of the spinal cord circuits that generate gate control. Neuron. 2014;82:522–536. doi: 10.1016/j.neuron.2014.01.018. - DOI - PMC - PubMed
    1. Todd AJ. Neuronal circuitry for pain processing in the dorsal horn. Nat. Rev. Neurosci. 2010;11:823–836. doi: 10.1038/nrn2947. - DOI - PMC - PubMed
    1. Abraira VE, Ginty DD. The sensory neurons of touch. Neuron. 2013;79:618–639. doi: 10.1016/j.neuron.2013.07.051. - DOI - PMC - PubMed
    1. Chung K, Kevetter GA, Willis WD, Coggeshall RE. An estimate of the ratio of propriospinal to long tract neurons in the sacral spinal cord of the rat. Neurosci. Lett. 1984;44:173–177. doi: 10.1016/0304-3940(84)90077-6. - DOI - PubMed
    1. Bice TN, Beal JA. Quantitative and neurogenic analysis of neurons with supraspinal projections in the superficial dorsal horn of the rat lumbar spinal cord. J. Comp. Neurol. 1997;388:565–574. doi: 10.1002/(SICI)1096-9861(19971201)388:4<565::AID-CNE5>3.0.CO;2-0. - DOI - PubMed

Publication types

Substances