. 2023 Apr 11;14(1):2035.
doi: 10.1038/s41467-023-37812-2.

A bacterial autotransporter impairs innate immune responses by targeting the transcription factor TFE3

Affiliations

A bacterial autotransporter impairs innate immune responses by targeting the transcription factor TFE3

Atri Ta et al. Nat Commun. .

Abstract

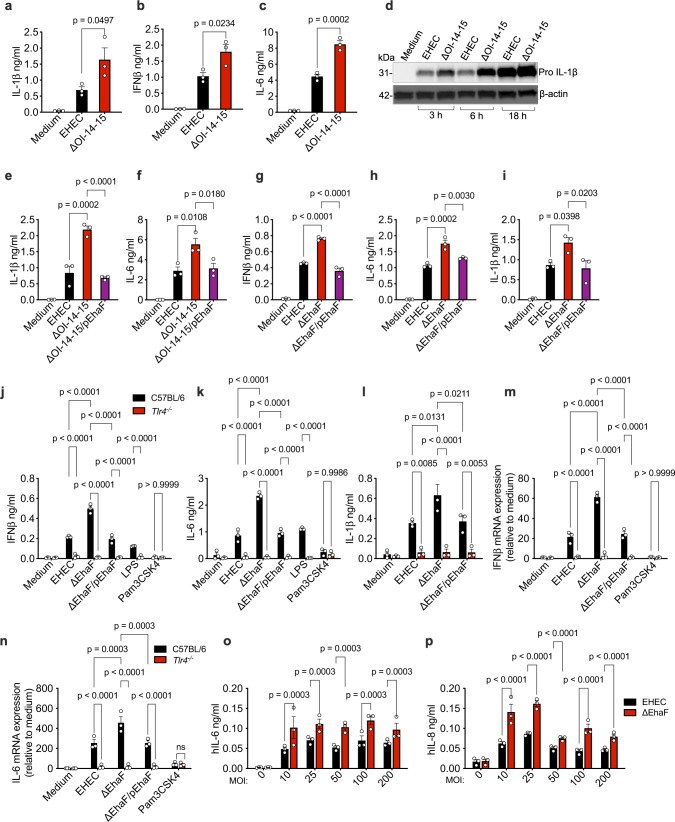
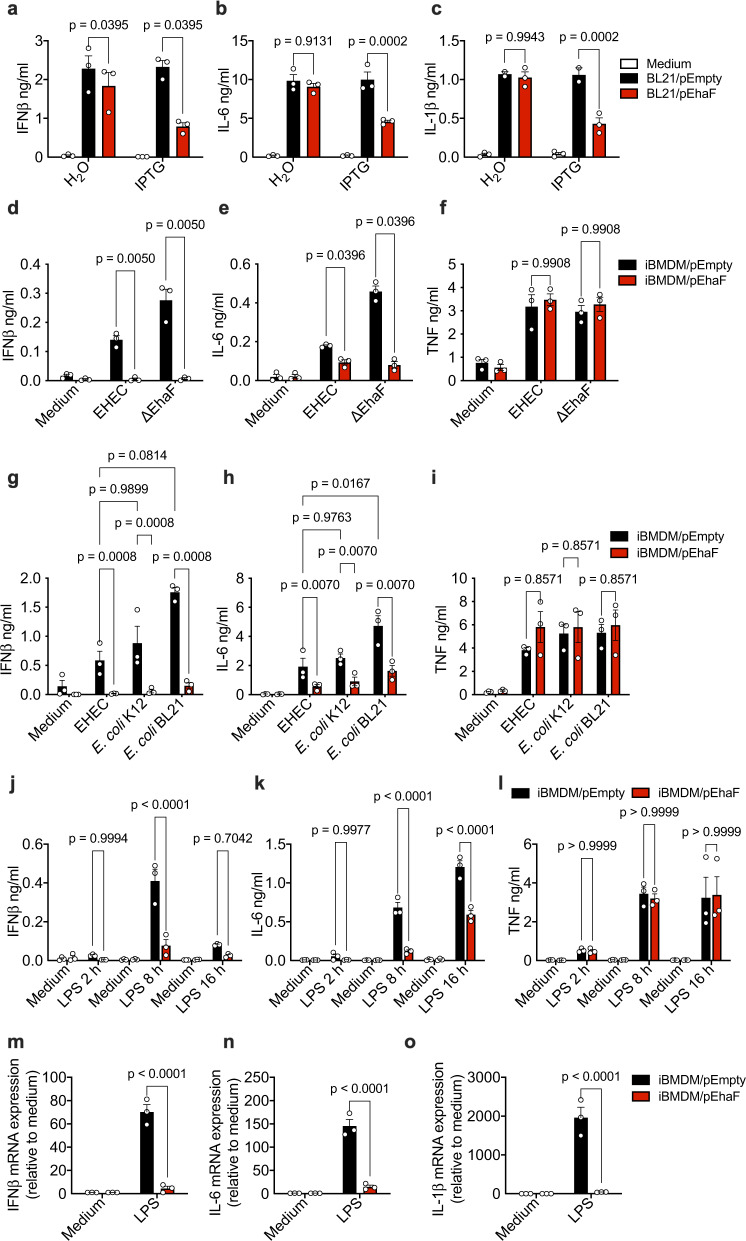
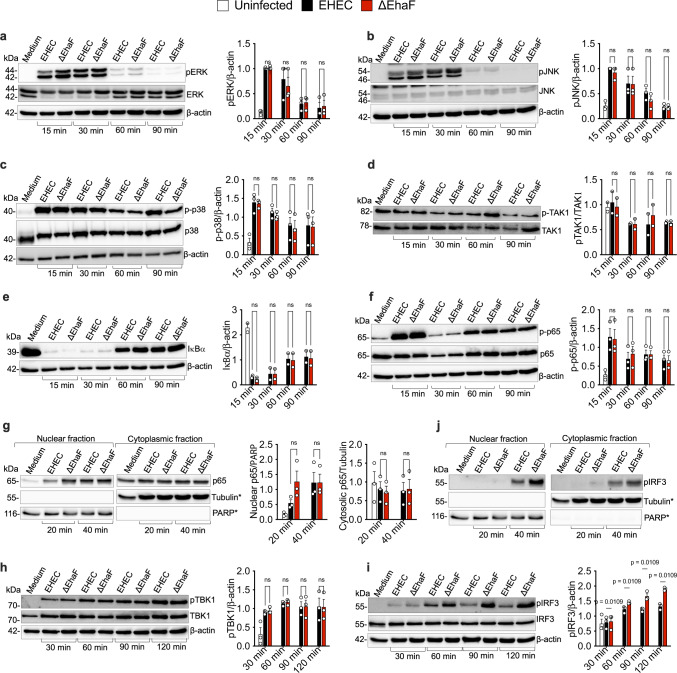
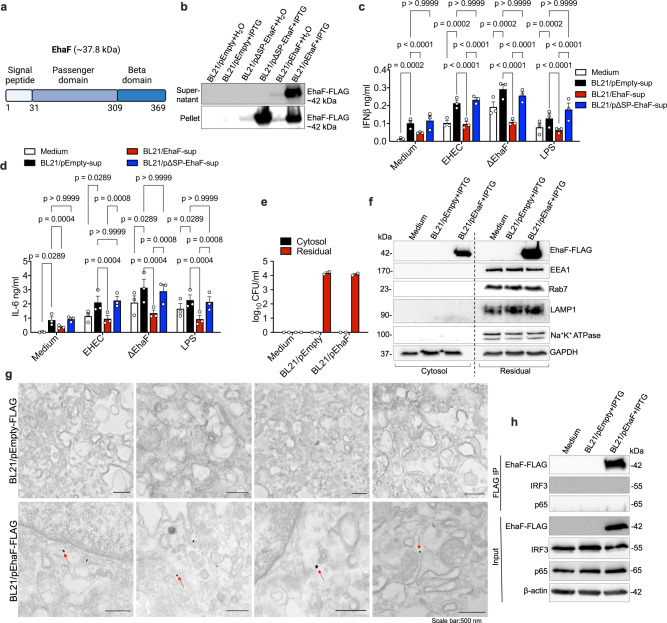
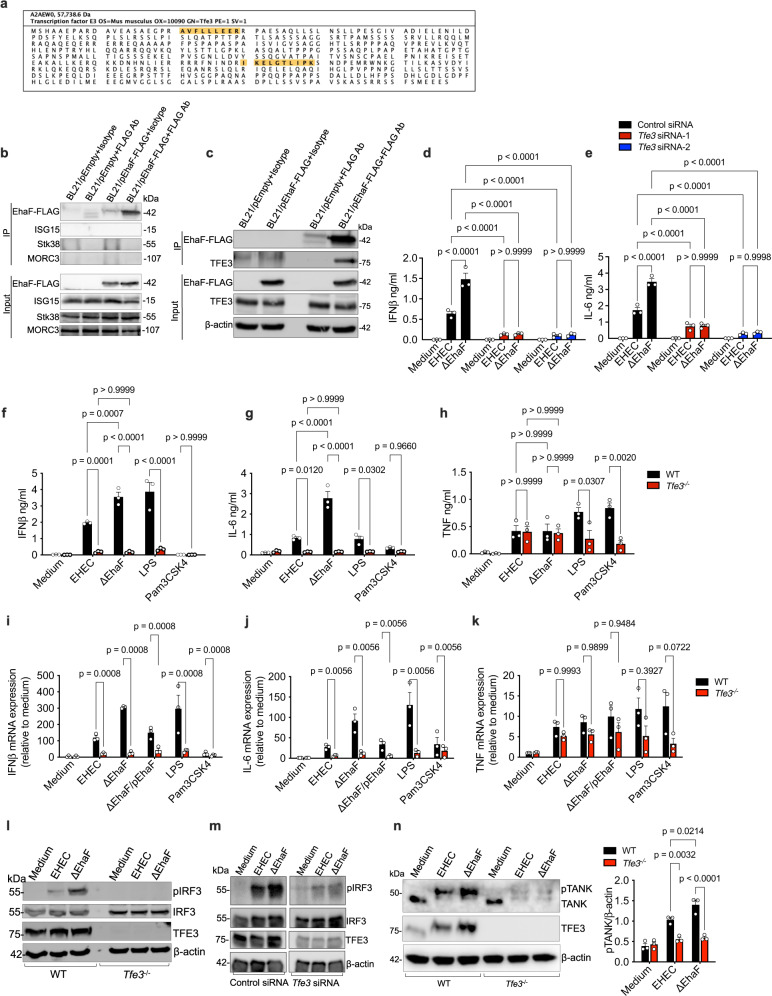
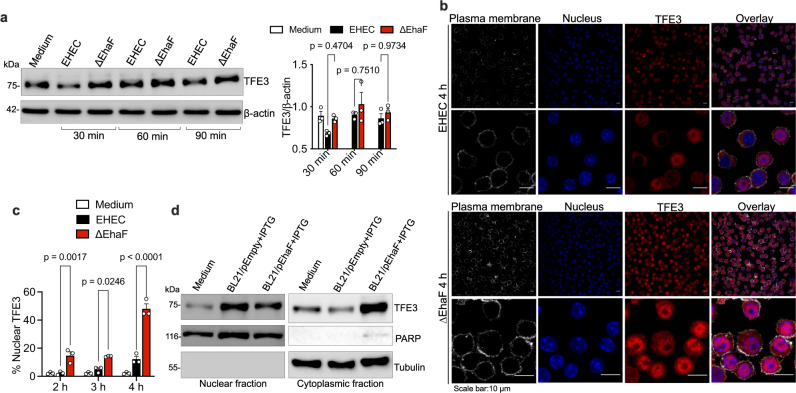
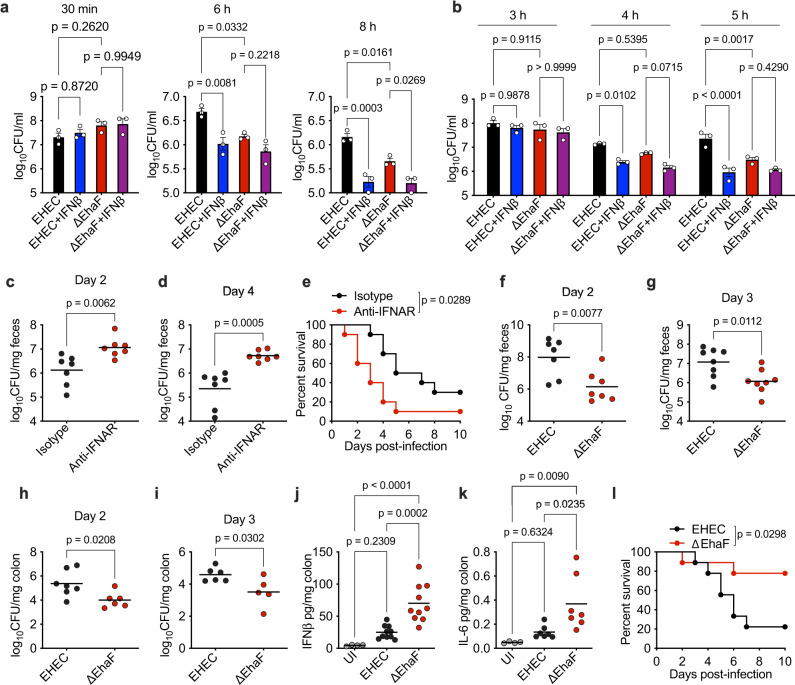
Type I interferons (IFNs) are consequential cytokines in antibacterial defense. Whether and how bacterial pathogens inhibit innate immune receptor-driven type I IFN expression remains mostly unknown. By screening a library of enterohemorrhagic Escherichia coli (EHEC) mutants, we uncovered EhaF, an uncharacterized protein, as an inhibitor of innate immune responses including IFNs. Further analyses identified EhaF as a secreted autotransporter-a type of bacterial secretion system with no known innate immune-modulatory function-that translocates into host cell cytosol and inhibit IFN response to EHEC. Mechanistically, EhaF interacts with and inhibits the MiT/TFE family transcription factor TFE3 resulting in impaired TANK phosphorylation and consequently, reduced IRF3 activation and type I IFN expression. Notably, EhaF-mediated innate immune suppression promotes EHEC colonization and pathogenesis in vivo. Overall, this study has uncovered a previously unknown autotransporter-based bacterial strategy that targets a specific transcription factor to subvert innate host defense.


Conflict of interest statement

The authors declare no competing interests.

Figures

Fig. 1
Fig. 1. EhaF inhibits innate immune responses to EHEC infection.
ac, el Secretion of indicated cytokines by C57BL/6 or Tlr4−/− BMDMs infected with EHEC, the indicated isogenic mutant, or complement strains at an MOI of 50 (MOI of 50 for all infections hereafter unless otherwise indicated) or treated with 0.5 μg/ml LPS or 0.5 μg/ml Pam3CSK4 for 6 h (b, c, f, g, h, j, k) or 18 h (a, e, i, l). d Immunoblot for pro IL-1β and β-actin in the lysates of BMDMs infected with EHEC or ΔOI-14-15 for the indicated times. m, n Fold increase in the expression of indicated genes in C57BL/6 or Tlr4−/− BMDMs infected with the indicated E. coli strains or treated with 0.5 μg/ml Pam3CSK4 relative to uninfected BMDMs (medium) as determined by real time quantitative PCR at 2 h post-stimulation. o, p Secretion of indicated cytokines by Caco2 cells infected with the indicated (on x-axis) MOI of EHEC or ΔEhaF for 24 h. ac, ep, Data (mean ± SEM) were from three independent experiments and each dot is a mean of each experiment’s technical replicates. d Immunoblot from one experiment representative of three independent experiments is shown. Statistical significance was assessed using one-way ANOVA (ac, ei) or two-way ANOVA (jp) followed by Tukey’s post-test. p < 0.05 indicated statistical significance. Multiplicity adjusted p values are presented. Source data are provided as a Source Data file.
Fig. 2
Fig. 2. EhaF expression is sufficient to inhibit innate immune responses.
ac Secretion of indicated cytokines by BMDMs infected with H2O- or IPTG-treated BL21/pEmpty or BL21/pEhaF at MOI 50 for 6 h (a, b) or 18 h (c). di Secretion of indicated cytokines by iBMDMs carrying empty vector (iBMDM/pEmpty) or iBMDMs expressing EhaF (iBMDM/pEhaF) infected with indicated strains of E. coli at MOI of 50 for 6 h. jl Secretion of indicated cytokines by iBMDM/pEmpty or iBMDM/pEhaF treated with 0.5 μg/ml LPS for the indicated duration. mo Fold increase in the expression of indicated genes in by iBMDM/pEmpty or iBMDM/pEhaF treated with 0.5 μg/ml LPS relative to untreated cells (medium) at 2 h after treatment. ao Data (mean ± SEM) were from three independent experiments and each dot is a mean of each experiment’s technical replicates. Statistical significance was assessed using two-way ANOVA followed by Tukey’s post-test. p < 0.05 indicated statistical significance. Multiplicity adjusted p values are presented. Source data are provided as a Source Data file.
Fig. 3
Fig. 3. EhaF inhibits IRF3 phosphorylation during EHEC infection.
af, h, i Immunoblots for the indicated proteins in the lysates of BMDMs infected with wild-type EHEC or ΔEhaF for the indicated time. g, j Immunoblots for the indicated proteins in the nuclear and cytoplasmic fractions of BMDMs infected with wild-type EHEC or ΔEhaF for the indicated time. ai, Combined data (mean ± SEM) from the densitometric analysis of indicated proteins relative to indicated control proteins from three independent experiments is provided next to each blot. *g, j images are from the same immunoblot membrane probed for p65, pIRF3, PARP and tubulin, hence same PARP and tubulin images in both. Statistical significance was assessed using two-way ANOVA followed by Tukey’s post-test. p < 0.05 indicated statistical significance. ns=not significant. Multiplicity adjusted p values are presented. Source data are provided as a Source Data file.
Fig. 4
Fig. 4. EhaF is a secreted autotransporter translocating into the host cell cytosol during infection.
a The domain organization of EhaF with an N-terminal signal peptide (residues: 1–31), a passenger domain (residues: 32–309), and a C-terminal beta domain (residues: 310–369). b Immunoblot for EhaF-FLAG in the bacterial supernatant and pellet of H2O- or IPTG-treated BL21/pEmpty-FLAG, BL21/pΔSP-EhaF-FLAG (lacking signal peptide), and BL21/pEhaF-FLAG (full-length EhaF). c, d IFNβ and IL-6 secretion by BMDMs treated with supernatants (25 μl) from H2O or IPTG-treated BL21/pEmpty, BL21/pEhaF, or BL21/pΔSP-EhaF 30 min prior to treatment with 1 μg/ml LPS or wild-type EHEC or ΔEhaF (MOI = 50) at 6 h post-treatment. e, f Agar plating for bacterial counts (e) and immunoblots for EhaF-FLAG, EEA1, Rab7, LAMP1, Na + /K + ATPase, and GAPDH (f) in the cytosolic and residual fractions of uninfected BMDM or BMDM infected with the indicated strains for 1.5 h at an MOI of 50 obtained by 0.005% digitonin fractionation. g Transmission electron microscopy of BMDMs infected with IPTG-treated BL21/pEmpty-FLAG or BL21/pEhaF-FLAG at an MOI of 50 for 1.5 h and stained with gold-conjugated anti-FLAG antibody (red arrows show FLAG labeling). Scale bar=500 nm. h Immunoblot for EhaF-FLAG, IRF3, and p65 in the elute from FLAG immunoprecipitation (FLAG IP) or in the lysates (Input) from BMDMs at 1.5 h following infection with IPTG-treated BL21/pEmpty-FLAG or BL21/pEhaF-FLAG. c, d Data (mean ± SEM) were from three independent experiments and each dot is a mean of each experiment’s technical replicates. Statistical significance was assessed using two-way ANOVA followed by Tukey’s post-test. p < 0.05 indicated statistical significance. Multiplicity adjusted p values are presented. b, e, f, g, h Data from one experiment representative of three independent experiments is shown. Source data are provided as a Source Data file.
Fig. 5
Fig. 5. EhaF inhibition of innate immune responses is dependent on TFE3.
a Amino acid sequence of TFE3 with peptides identified by mass spectrometry indicated in yellow. b, c Immunoblot for indicated proteins in the elute from immunoprecipitation (IP) with isotype control antibody (Isotype)- or FLAG antibody (FLAG Ab) or in the lysates (Input) from BMDMs infected with IPTG-treated BL21/pEmpty or BL21/pEhaF at 1.5 h of infection. d, e IFNβ and IL-6 secretion at 6 h of infection by RAW264.7 macrophages infected with EHEC or ΔEhaF at MOI of 50 following siRNA-mediated knock down of TFE3. fh Secretion of indicated cytokines from wild-type or Tfe3−/− RAW264.7 macrophages infected with EHEC or ΔEhaF or treated with 0.5 µg/ml LPS or 0.5 µg/ml Pam3CSK4 for 6 h. ik Fold increase in the expression of indicated genes by wild-type or Tfe3−/− RAW264.7 macrophages infected with EHEC, ΔEhaF, or ΔEhaF/pEhaF or treated with 0.5 µg/ml LPS or 0.5 µg/ml Pam3CSK4 for 2 h. l Immunoblot for indicated proteins in the lysates of wild-type or Tfe3−/− RAW264.7 macrophages infected with EHEC or ΔEhaF for 90 min. m Immunoblot for the indicated proteins in the lysates of RAW264.7 macrophages infected with EHEC or ΔEhaF for 2 h following siRNA-mediated knock down (72 h) of TFE3. n Immunoblot for the indicated proteins in the lysates of wild-type or Tfe3−/− RAW264.7 macrophages infected with EHEC or ΔEhaF for 30 min and combined densitometric data from three independent experiments. dk, n Data (mean ± SEM) were from three independent experiments and each dot is a mean of each experiment’s technical replicates. Statistical significance was assessed using two-way ANOVA followed by Tukey’s post-test. p < 0.05 indicated statistical significance. Multiplicity adjusted p values are presented. b, c, l, m, n, Immunoblots from one experiment representative of three independent experiments is shown. Source data are provided as a Source Data file.
Fig. 6
Fig. 6. EhaF suppresses nuclear translocation of TFE3.
a Immunoblot for the indicated proteins in BMDMs infected with EHEC or ΔEhaF for the indicated times and combined densitometric data from three independent experiments. b Confocal microscopy of RAW264.7 macrophages infected with EHEC or ΔEhaF for 4 h. TFE3 is visualized with an anti-TFE3 antibody (red), nucleus with DAPI (blue), and plasma membrane with phalloidin (white), scale bar=10μm. c Quantification of cells with TFE3 localized in the nucleus measured by counting 50 fields containing ~10 cells each. d Immunoblots for the indicated proteins in the nuclear and cytoplasmic fractions of BMDMs infected with IPTG-treated BL21/pEmpty or BL21/pEhaF for 3 h. a, c Data (mean ± SEM) were from three independent experiments. Statistical significance was assessed using two-way ANOVA followed by Tukey’s post-test. p < 0.05 indicated statistical significance. Multiplicity adjusted p values are presented. a, b, d Immunoblots or microscopy images from one experiment representative of three independent experiments is shown. Source data are provided as a Source Data file.
Fig. 7
Fig. 7. EhaF-mediated innate immune suppression promotes EHEC pathogenesis.
a Intracellular bacterial load in BMDMs treated with 10 ng/ml of IFNβ 30 min prior to infection with EHEC or ΔEhaF for the indicated times. b Bacterial adherence in Caco2 cells treated with 10 ng/ml of human IFNβ 60 min prior to infection with EHEC or ΔEhaF for the indicated times. ce Bacterial colonization at the indicated days post-infection determined by viable fecal counts (c, d) and survival (e) of streptomycin-treated mice intraperitoneally (i. p.) injected with 250 µg of an isotype control antibody or anti-IFNAR antibody one day prior to and on day 1 and 3 after oral gavaging with 1 × 1010 of EHEC [n = 7 for isotype and anti-IFNAR (c, d) and n = 10 for isotype and anti-IFNAR (e)]. fi Bacterial colonization on days 2 and 3 of infection determined by serial dilution and plating of feces (f, g) or of colon homogenates (h, i) of streptomycin-treated mice orally gavaged with 1 × 1010 of EHEC or ΔEhaF (f, g, n = 7 for EHEC and ΔEhaF each for day 2 and n = 8 for EHEC and ΔEhaF each for day 3; h, i n = 7 for EHEC and n = 6 for ΔEhaF for day 2 and n = 6 for EHEC and n = 5 for ΔEhaF for day 3). j, k Levels of IFNβ or IL-6 in the colon homogenates of streptomycin-treated mice orally gavaged with 1 × 1010 of EHEC or ΔEhaF on day 2 post-infection [n = 4 for UI, n = 10 for EHEC and ΔEhaF (j) and n = 4 for UI, n = 7 for EHEC and ΔEhaF (k)]. l Survival of streptomycin-treated mice orally gavaged with 1 × 1010 of EHEC (n = 9) or ΔEhaF (n = 9). a, b Data (mean ± SEM) were from three independent experiments and each dot is a mean of each experiment’s technical replicates. Statistical significance was assessed using two-way ANOVA followed by Tukey’s post-test. cl Combined data from two independent experiments are shown. Statistical significance was assessed using two-sided unpaired t-test (c, d, fi) or one-way ANOVA followed by Tukey’s post-test (j, k) or Mantel-Cox test (e, l). p < 0.05 indicated statistical significance. Source data are provided as a Source Data file.

Similar articles

Cited by

References

    1. Akira S, Takeda K. Toll-like receptor signalling. Nat. Rev. Immunol. 2004;4:499–511. doi: 10.1038/nri1391. - DOI - PubMed
    1. Fitzgerald KA, Kagan JC. Toll-like receptors and the control of immunity. Cell. 2020;180:1044–1066. doi: 10.1016/j.cell.2020.02.041. - DOI - PMC - PubMed
    1. Shin S, Brodsky IE. The inflammasome: learning from bacterial evasion strategies. Semin Immunol. 2015;27:102–110. doi: 10.1016/j.smim.2015.03.006. - DOI - PubMed
    1. Ta A, Vanaja SK. Inflammasome activation and evasion by bacterial pathogens. Curr. Opin. Immunol. 2021;68:125–133. doi: 10.1016/j.coi.2020.11.006. - DOI - PMC - PubMed
    1. Tarr PI, Gordon CA, Chandler WL. Shiga-toxin-producing Escherichia coli and haemolytic uraemic syndrome. Lancet. 2005;365:1073–1086. - PubMed

Publication types

MeSH terms

Substances