. 2023 Sep;44(9):1801-1814.
doi: 10.1038/s41401-023-01065-y. Epub 2023 Apr 11.

Single-cell RNA sequencing deciphers the mechanism of sepsis-induced liver injury and the therapeutic effects of artesunate

Affiliations

Single-cell RNA sequencing deciphers the mechanism of sepsis-induced liver injury and the therapeutic effects of artesunate

Xue-Ling He et al. Acta Pharmacol Sin. 2023 Sep.

Abstract

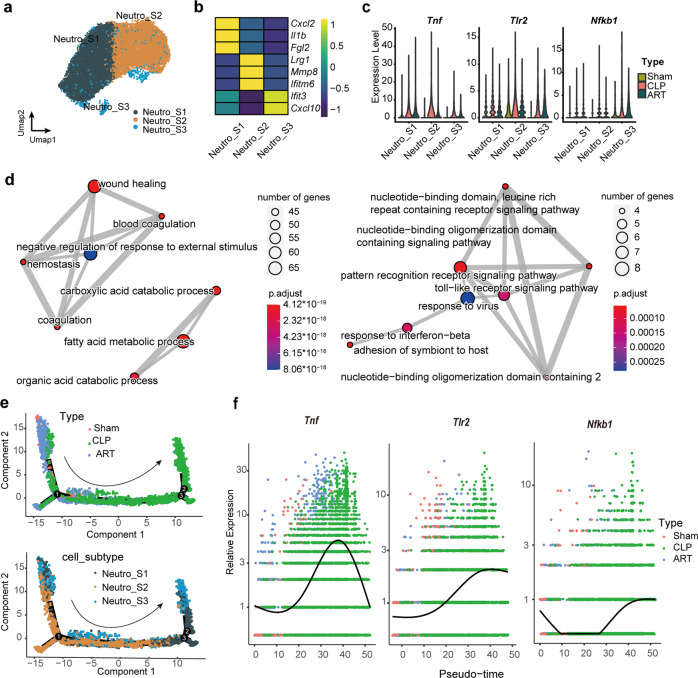
Liver, as an immune and detoxification organ, represents an important line of defense against bacteria and infection and a vulnerable organ that is easily injured during sepsis. Artesunate (ART) is an anti-malaria agent, that also exhibits broad pharmacological activities including anti-inflammatory, immune-regulation and liver protection. In this study, we investigated the cellular responses in liver to sepsis infection and ART hepatic-protective mechanisms against sepsis. Cecal ligation and puncture (CLP)-induced sepsis model was established in mice. The mice were administered ART (10 mg/kg, i.p.) at 4 h, and sacrificed at 12 h after the surgery. Liver samples were collected for preparing single-cell RNA transcriptome sequencing (scRNA-seq). The scRNA-seq analysis revealed that sepsis-induced a dramatic reduction of hepatic endothelial cells, especially the subtypes characterized with proliferation and differentiation. Macrophages were recruited during sepsis and released inflammatory cytokines (Tnf, Il1b, Il6), chemokines (Ccl6, Cd14), and transcription factor (Nfkb1), resulting in liver inflammatory responses. Massive apoptosis of lymphocytes and abnormal recruitment of neutrophils caused immune dysfunction. ART treatment significantly improved the survival of CLP mice within 96 h, and partially relieved or reversed the above-mentioned pathological features, mitigating the impact of sepsis on liver injury, inflammation, and dysfunction. This study provides comprehensive fundamental proof for the liver protective efficacy of ART against sepsis infection, which would potentially contribute to its clinical translation for sepsis therapy. Single cell transcriptome reveals the changes of various hepatocyte subtypes of CLP-induced liver injury and the potential pharmacological effects of artesunate on sepsis.

Keywords: sepsis; scRNA-seq; artesunate; liver; hepatic endothelial cells; macrophages; lymphocytes; neutrophils.


Conflict of interest statement

The authors declare no competing interests.

Figures

None
Single cell transcriptome reveals the changes of various hepatocyte subtypes of CLP-induced liver injury and the potential pharmacological effects of artesunate on sepsis.
Fig. 1
Fig. 1
CLP-induced liver injury in septic mice and ART therapy. a Schematic working depicts the experimental design of this study. b The survival rate of septic mice in each group is recorded over 96 h. c Biochemical analysis in serum: AST and ALT, n = 8. d H&E staining diagram of liver in each group (20 ×, scale bar: 50 μm).
Fig. 2
Fig. 2
Single-cell transcription profiling of mouse livers after sepsis induction and ART treatment. a The UMAP visualization shows unsupervised scRNA-seq clustering, revealing 11 distinct cellular identities. Hep, Cho, HSC, Endo, Kupffer, LCM, pDCs, Neutro, B lymph, T lymph, and NK. b The violin plot shows the expression levels of the respective selected markers across 11 clusters. The Y-axis shows the log-scale normalized reads count. c The pie chat (left) shows the sample type formation of cellular identities, accompanied by of sample type percentage in each cellular identity, colored according to cell types (right).
Fig. 3
Fig. 3
ART inhibits the expression of pro-inflammatory factors in CLP-induced sepsis model. a The expression of pro-inflammatory factors TNF-α, IL-1β, and IL-6 in serum. b The expression of pro-inflammatory factors TNF-α, IL-1β, and IL-6 proteins by Western blot and quantitative statistics of corresponding groups (n = 3). c The violin plot shows the relative expression levels of pro-inflammatory factor genes among liver subtypes in scRNA-seq datasets, colored according to group types.
Fig. 4
Fig. 4
ART ameliorates hepatic endothelial cells injury in CLP-induced sepsis mice. a The UMAP visualization shows unsupervised scRNA-seq clustering revealing 3 distinct subtypes of EC_S1, EC_S2, and EC_S3. b The heatmap plot depicts the cell markers expression of each cell subtype in segment endothelial cell. c The bar plot shows up-regulated DEGs in each Endo subtype, colored according to subtypes, respectively. d The bar plot shows sample origin of cells among three subtypes, colored according to group types, respectively. e The violin plot shows the relative expression levels of adherence factor genes of three endothelial subtypes in scRNA-seq datasets, colored according to group types. f Immunohistochemical staining of ICAM-1 and VCAM-1 (20×, scale bar: 50 μm). g The heatmap plot depicts overlaping down-regulated DEGs of CLP vs. Sham and CLP vs. ART, as well as overlaping up-regulated DEGs of CLP vs. Sham and CLP vs. ART. h Pathway enrichment analysis of differential genes overlapping up-regulated (left) and down-regulated (right) in CLP group compared with Sham group, as well as in CLP group compared with ART group in endothelial cells.
Fig. 5
Fig. 5
ART inhibits the recruitment of macrophages in CLP-induced sepsis mice effectively. a The UMAP visualization shows unsupervised scRNA-seq clustering, revealing 5 distinct subtypes of macrophages. Kupffer_M1, Kupffer_M2, Kupffer_Pro, LCM_M1, and LCM_pro. b The heatmap plot depicts the cell markers expression of each cell subtype in macrophages. c The bar plot shows sample origin of cells among five macrophages subtypes in each group, colored according to subtypes, respectively. d The violin plot shows the relative expression levels of key genes of five subtypes in scRNA-seq datasets, colored according to group types. e The visualization shows the scatter plot of log2FC value in both up-regulated and down-regulated DEGs of CLP vs. Sham and CLP vs. ART, among three cellular subtypes (Kupffer_M1, Kupffer_M2, and LCM_M1). f Pathway enrichment analysis of differential genes overlapping up-regulated (left) and down-regulated (right) in CLP group compared with Sham group, as well as in CLP group compared with ART group among three macrophages subtypes (Kupffer_M1, Kupffer_M2, and LCM_M1).
Fig. 6
Fig. 6
ART relieves the immune dysfunction of lymphocyte in CLP-induced sepsis mice. a The UMAP visualization shows unsupervised scRNA-seq clustering, revealing 8 distinct subtypes of lymph cells. CD4+ Tn, CD4+ Te, CD4+ Treg, CD8+ Tn, CD8+ Te, B naive, B plasma, and NK. b The heatmap plot depicts the cell markers expression of each cell subtype in lymphocytes. c The bar plot shows sample origin of cells among five subtypes, colored according to group types, respectively. d The violin plot shows the relative expression levels of key genes of eight subtypes in scRNA-seq datasets, colored according to group types. e ELISA kit result: interferon-γ (IFN-γ) concentration in serum, n = 6. f The expression of PD-1 and PD-L1 proteins by Western blotting and quantitative statistics correspond to groups, n = 3. g Fluorescent representative picture of TUNEL assay (20×, scale bar: 50 μm). h Pathway enrichment analysis of differential genes overlapping up-regulated (left) in CLP group compared with Sham group, as well as in CLP group compared with ART group in NK cells. i Pesudotime trajectory inference traces a path of pseudotime (top) and group types (bottom) in NK cells, respectively.
Fig. 7
Fig. 7
ART activates the immune function of neutrophils in CLP-induced sepsis mice. a The UMAP visualization shows unsupervised scRNA-seq clustering, revealing 3 distinct subtypes of neutrophils: Neutro_S1, Neutro_S2, Neutro_S3. b The heatmap plot depicts the cell markers expression of each cell subtype in neutrophils. c The violin plot shows the relative expression levels of key genes of three subtypes in scRNA-seq datasets, colored according to group types. d Pathway enrichment analysis of differential genes overlapping up-regulated (left) and down-regulated (right) in CLP group compared with Sham group, as well as in CLP group compared with ART group in neutrophils. e Pesudotime trajectory inference traces a path of pesudotime (top) and group types (bottom). f The scatter plot shows the relative gene expression level of 3 key genes in pseudotime, colored according to group types.
Fig. 8
Fig. 8
ART rewired intercellular crosstalk in CLP-induced sepsis mouse liver. a The bar plot shows number of intercellular crosstalk inferred interactions (left) and interaction strength (right) in each group. b The chordal graph of total cell to cell interaction number of cell types between Sham, CLP and ART groups, colored according to each cell type and the thickness degree. c The heatmap plot shows the differential interaction numbers between the sender and receiver subtypes cell in the ART group compared to CLP group. The top bar plot represents the sum of incoming signaling and the right represents the sum of outgoing signaling. d The bobble plot shows significant up-regulated ligand-receptor pairs between sender and receiver cell, colored according to group types. e The violin plot shows the relative expression levels of key genes (Ccl2, Ccl5 and Ackr1) of 11 hepatic subtypes in scRNA-seq datasets, colored according to group types.

References

    1. Singer M, Deutschman CS, Seymour CW, Shankar-Hari M, Annane D, Bauer M, et al. The third international consensus definitions for sepsis and septic shock (sepsis-3) JAMA. 2016;315:801–10. doi: 10.1001/jama.2016.0287. - DOI - PMC - PubMed
    1. Evans L, Rhodes A, Alhazzani W, Antonelli M, Coopersmith CM, French C, et al. Executive summary: surviving sepsis campaign: international guidelines for the management of sepsis and septic shock 2021. Crit Care Med. 2021;49:1974–82.. doi: 10.1097/CCM.0000000000005357. - DOI - PubMed
    1. Van der Poll T, van de Veerdonk FL, Scicluna BP, Netea MG. The immunopathology of sepsis and potential therapeutic targets. Nat Rev Immunol. 2017;17:407–20.. doi: 10.1038/nri.2017.36. - DOI - PubMed
    1. Pierrakos C, Velissaris D, Bisdorff M, Marshall JC, Vincent JL. Biomarkers of sepsis: time for a reappraisal. Crit Care. 2020;24:287. doi: 10.1186/s13054-020-02993-5. - DOI - PMC - PubMed
    1. Schnabl B, Brenner DA. Interactions between the intestinal microbiome and liver diseases. Gastroenterology. 2014;146:1513–24. doi: 10.1053/j.gastro.2014.01.020. - DOI - PMC - PubMed