

Discovery and systematic assessment of early biomarkers that predict progression to severe COVID-19 disease
- PMID: 37041310
- PMCID: PMC10089829
- DOI: 10.1038/s43856-023-00283-z
Discovery and systematic assessment of early biomarkers that predict progression to severe COVID-19 disease
Abstract
Background: The clinical course of COVID-19 patients ranges from asymptomatic infection, via mild and moderate illness, to severe disease and even fatal outcome. Biomarkers which enable an early prediction of the severity of COVID-19 progression, would be enormously beneficial to guide patient care and early intervention prior to hospitalization.
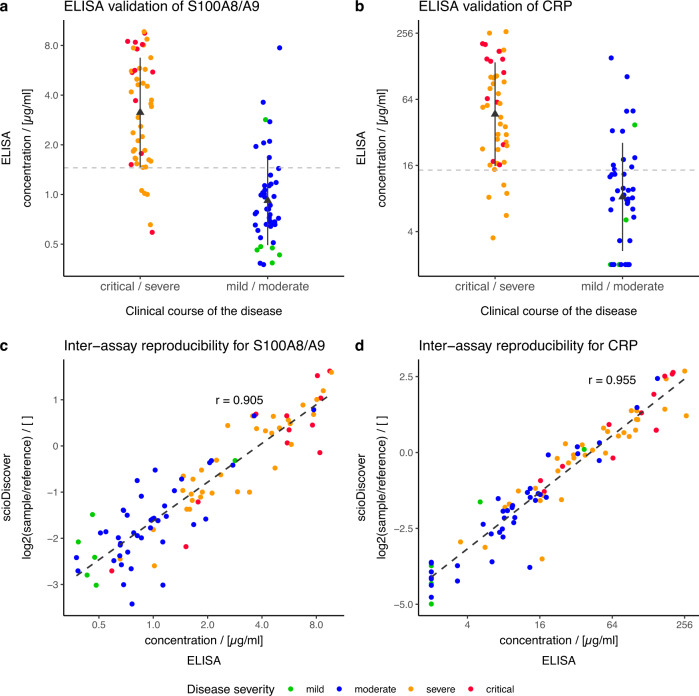
Methods: Here we describe the identification of plasma protein biomarkers using an antibody microarray-based approach in order to predict a severe cause of a COVID-19 disease already in an early phase of SARS-CoV-2 infection. To this end, plasma samples from two independent cohorts were analyzed by antibody microarrays targeting up to 998 different proteins.
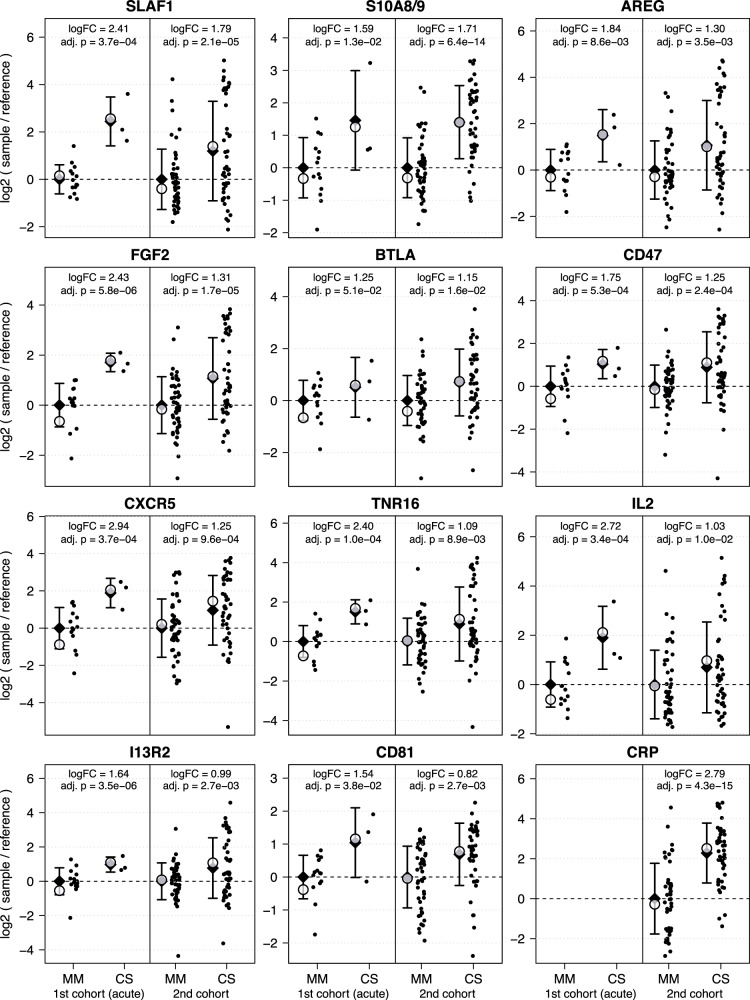
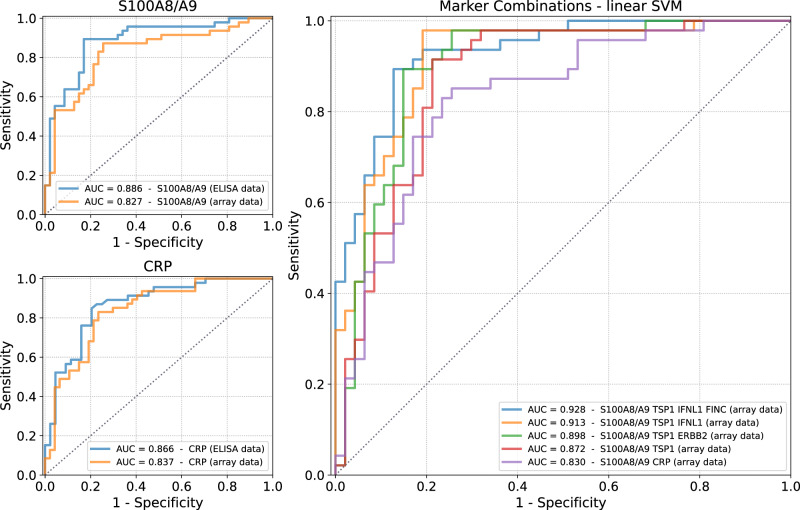
Results: In total, we identified 11 promising protein biomarker candidates to predict disease severity during an early phase of COVID-19 infection coherently in both analyzed cohorts. A set of four (S100A8/A9, TSP1, FINC, IFNL1), and two sets of three proteins (S100A8/A9, TSP1, ERBB2 and S100A8/A9, TSP1, IFNL1) were selected using machine learning as multimarker panels with sufficient accuracy for the implementation in a prognostic test.
Conclusions: Using these biomarkers, patients at high risk of developing a severe or critical disease may be selected for treatment with specialized therapeutic options such as neutralizing antibodies or antivirals. Early therapy through early stratification may not only have a positive impact on the outcome of individual COVID-19 patients but could additionally prevent hospitals from being overwhelmed in potential future pandemic situations.
Plain language summary
We aimed to identify components of the blood present during the early phase of SARS-CoV-2 infection that distinguish people who are likely to develop severe symptoms of COVID-19. Blood from people who later developed a mild or moderate course of disease were compared to blood from people who later had a severe or critical course of disease. Here, we identified a combination of three proteins that were present in the blood of patients with COVID-19 who later developed a severe or critical disease. Identifying the presence of these proteins in patients at an early stage of infection could enable physicians to treat these patients early on to avoid progression of the disease.
© 2023. The Author(s).
Conflict of interest statement
The authors declare the following competing interests: C.S. and J.D.H are founders and shareholders of Sciomics GmbH. C.S., K.H., N.S., M.K., A.G. and F.S. are patent inventors who contributed to a patent claiming Covid-19 disease severity biomarkers (WO2022028917). All other authors have no competing interests to declare.
Figures
Similar articles
-
Virtualized clinical studies to assess the natural history and impact of gut microbiome modulation in non-hospitalized patients with mild to moderate COVID-19 a randomized, open-label, prospective study with a parallel group study evaluating the physiologic effects of KB109 on gut microbiota structure and function: a structured summary of a study protocol for a randomized controlled study.Trials. 2021 Apr 2;22(1):245. doi: 10.1186/s13063-021-05157-0. Trials. 2021. PMID: 33810796 Free PMC article.
-
Elevated Levels of Neutrophil Activated Proteins, Alpha-Defensins (DEFA1), Calprotectin (S100A8/A9) and Myeloperoxidase (MPO) Are Associated With Disease Severity in COVID-19 Patients.Front Cell Infect Microbiol. 2021 Oct 21;11:751232. doi: 10.3389/fcimb.2021.751232. eCollection 2021. Front Cell Infect Microbiol. 2021. PMID: 34746027 Free PMC article.
-
Safety and Efficacy of Imatinib for Hospitalized Adults with COVID-19: A structured summary of a study protocol for a randomised controlled trial.Trials. 2020 Oct 28;21(1):897. doi: 10.1186/s13063-020-04819-9. Trials. 2020. PMID: 33115543 Free PMC article.
-
Prognostic biomarkers to identify patients likely to develop severe Crohn's disease: a systematic review.Health Technol Assess. 2021 Jul;25(45):1-66. doi: 10.3310/hta25450. Health Technol Assess. 2021. PMID: 34225839 Free PMC article.
-
Convalescent plasma or hyperimmune immunoglobulin for people with COVID-19: a rapid review.Cochrane Database Syst Rev. 2020 May 14;5(5):CD013600. doi: 10.1002/14651858.CD013600. Cochrane Database Syst Rev. 2020. Update in: Cochrane Database Syst Rev. 2020 Jul 10;7:CD013600. doi: 10.1002/14651858.CD013600.pub2. PMID: 32406927 Free PMC article. Updated.
Cited by
-
Predictive efficacy of combined tumor markers and gastrin for recurrence after endoscopic submucosal dissection in early gastric cancer patients.Am J Transl Res. 2024 May 15;16(5):2059-2069. doi: 10.62347/VOTO5604. eCollection 2024. Am J Transl Res. 2024. PMID: 38883344 Free PMC article.
-
Exploration of Novel Biomarkers for Neurodegenerative Diseases Using Proteomic Analysis and Ligand-Binding Assays.Biomedicines. 2024 Dec 9;12(12):2794. doi: 10.3390/biomedicines12122794. Biomedicines. 2024. PMID: 39767701 Free PMC article.
-
Proteomic signatures of vaccine-induced and breakthrough infection-induced host responses to SARS-CoV-2.Vaccine. 2025 Jan 1;43(Pt 1):126484. doi: 10.1016/j.vaccine.2024.126484. Epub 2024 Nov 8. Vaccine. 2025. PMID: 39520894
-
Cytokine signature in convalescent SARS-CoV-2 patients with inflammatory bowel disease receiving vedolizumab.Sci Rep. 2024 Jan 2;14(1):186. doi: 10.1038/s41598-023-50035-1. Sci Rep. 2024. PMID: 38168138 Free PMC article.
-
Genetic signatures of AKT1 variants associated with worse COVID-19 outcomes - a multicentric observational study.Front Immunol. 2024 Oct 8;15:1422349. doi: 10.3389/fimmu.2024.1422349. eCollection 2024. Front Immunol. 2024. PMID: 39439795 Free PMC article.
References
-
- Coronavirus disease (COVID-19) – World Health Organization. https://www.who.int/emergencies/diseases/novel-coronavirus-2019.
-
- Schilling, J. et al. Krankheitsschwere der ersten COVID-19-Welle in Deutschland basierend auf den Meldungen gemäß Infektionsschutzgesetz. (2020) 10.25646/7169.
-
- Ständige Impfkommission: Empfehlungen der Ständigen Impfkommission (STIKO) beim Robert Koch-Institut. Epid Bull4, 3–67 10.25646/9285.3 (2022).
LinkOut - more resources
Full Text Sources
Research Materials
Miscellaneous
