. 2023 Jun;20(6):666-679.
doi: 10.1038/s41423-023-01011-2. Epub 2023 Apr 12.

Fatty acid desaturation by stearoyl-CoA desaturase-1 controls regulatory T cell differentiation and autoimmunity

Affiliations

Fatty acid desaturation by stearoyl-CoA desaturase-1 controls regulatory T cell differentiation and autoimmunity

Elien Grajchen et al. Cell Mol Immunol. 2023 Jun.

Abstract

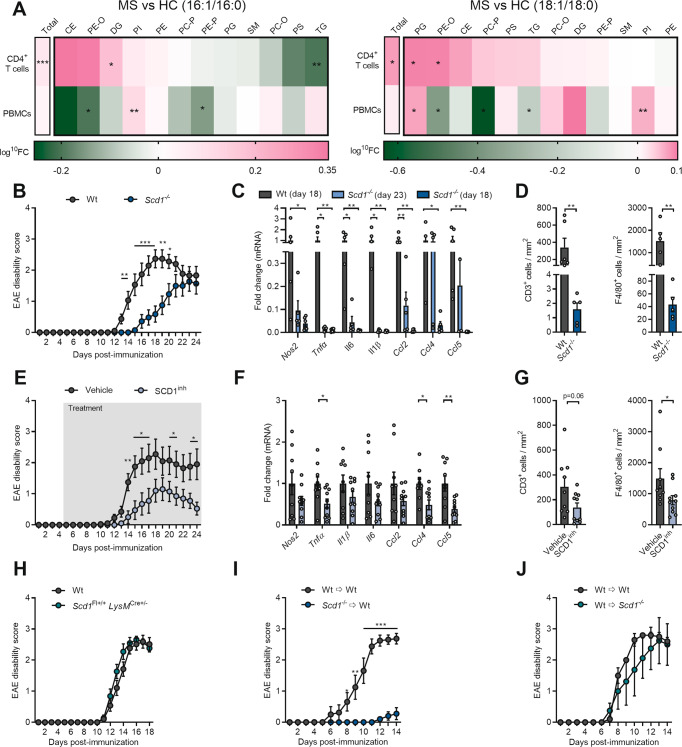
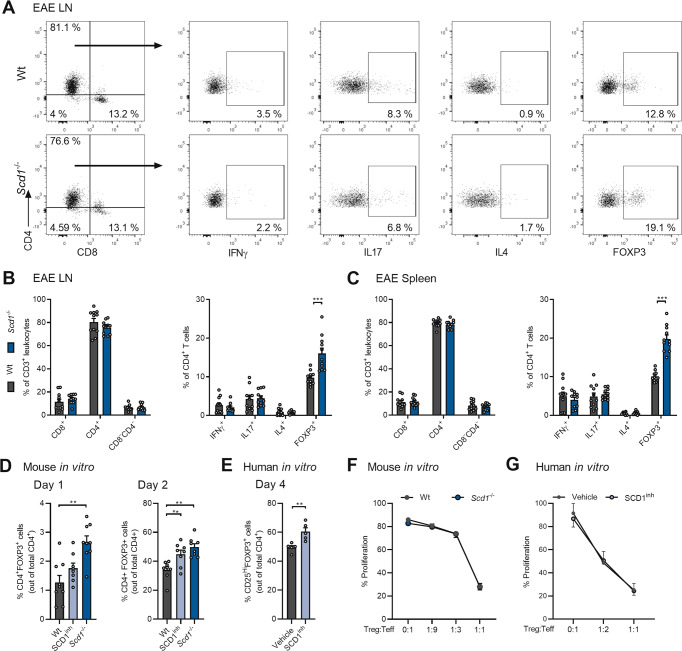
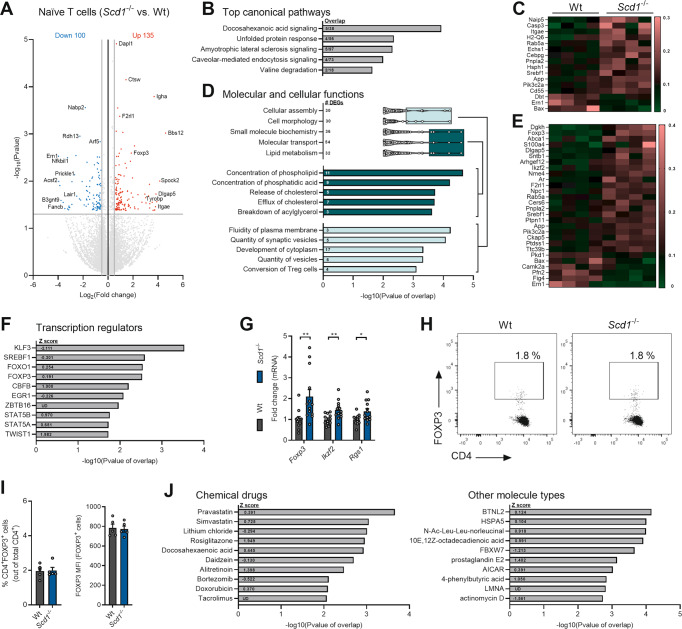
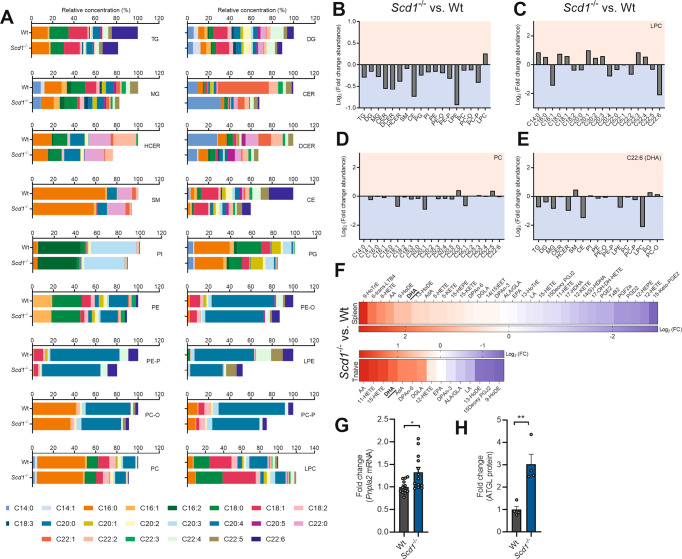
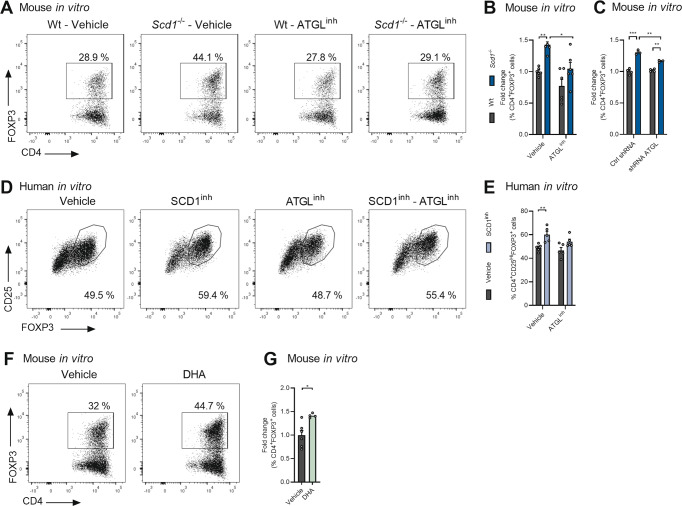
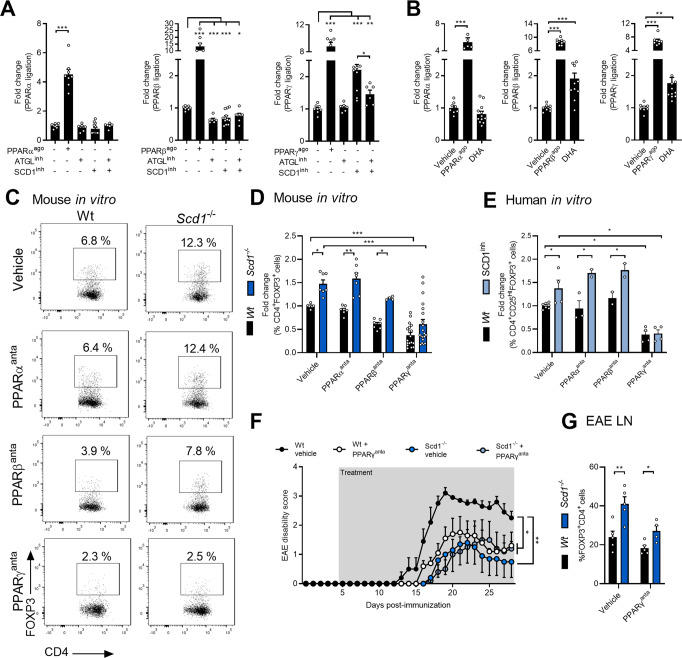
The imbalance between pathogenic and protective T cell subsets is a cardinal feature of autoimmune disorders such as multiple sclerosis (MS). Emerging evidence indicates that endogenous and dietary-induced changes in fatty acid metabolism have a major impact on both T cell fate and autoimmunity. To date, however, the molecular mechanisms that underlie the impact of fatty acid metabolism on T cell physiology and autoimmunity remain poorly understood. Here, we report that stearoyl-CoA desaturase-1 (SCD1), an enzyme essential for the desaturation of fatty acids and highly regulated by dietary factors, acts as an endogenous brake on regulatory T-cell (Treg) differentiation and augments autoimmunity in an animal model of MS in a T cell-dependent manner. Guided by RNA sequencing and lipidomics analysis, we found that the absence of Scd1 in T cells promotes the hydrolysis of triglycerides and phosphatidylcholine through adipose triglyceride lipase (ATGL). ATGL-dependent release of docosahexaenoic acid enhanced Treg differentiation by activating the nuclear receptor peroxisome proliferator-activated receptor gamma. Our findings identify fatty acid desaturation by SCD1 as an essential determinant of Treg differentiation and autoimmunity, with potentially broad implications for the development of novel therapeutic strategies and dietary interventions for autoimmune disorders such as MS.

Keywords: Autoimmunity; Fatty acid metabolism; Multiple sclerosis; Regulatory T cells; Stearoyl-CoA desaturase-1.


Conflict of interest statement

The authors declare no competing interests.

Figures

Fig. 1
Fig. 1. SCD1 inhibition and deficiency reduce EAE severity in a T cell-dependent manner.
A Liquid chromatography‒electrospray ionization tandem mass spectrometry (LC‒ESI‒MS/MS) analysis was performed to define the lipidome of peripheral blood mononuclear cells (PBMCs) and CD4+ T cells from MS patients and age- and gender-matched healthy controls. Desaturation indices were determined by calculating the 16:1/16:0 and 18:1/18:0 ratios (n = 4). B EAE disease score of Scd1−/− mice (n = 14) and wild-type littermates (wt, n = 15). C mRNA expression of Nos2, Tnfα, Il1β, Il6, Ccl2, Ccl4, and Ccl5 in spinal cord tissue obtained from the wt (n = 6) and Scd1−/− (n = 5) animals with EAE (18 and 23 days post-immunization, dpi). D Quantification of CD3 and F4/80 staining of spinal cord tissue obtained from the wt (n = 6) and Scd1−/− (n = 5) animals with EAE at the peak of the disease (18 dpi). E EAE disease score of the wt mice treated with vehicle (n = 10) or SCD1 inhibitor (SCD1inh, CAY10566, 2.5 mg/kg, n = 10) by oral gavage twice a day with a 12 h interval. F mRNA expression of Nos2, Tnfα, Il1β, Il6, Ccl2, Ccl4, and Ccl5 in spinal cord tissue obtained from the vehicle- (n = 9) and SCD1 inhibitor-treated (n = 10) animals with EAE (24 dpi). G Quantification of CD3 and F4/80 staining of spinal cord tissue obtained from the vehicle- (n = 9) and SCD1 inhibitor-treated (n = 10) animals with EAE (24 dpi). H EAE disease score of the wt (Scd1Fl+/+ and LysMCre+/-, n = 19) and Scd1Fl+/+ LysMCre+/- (n = 11) mice. I EAE disease score of the wt recipient mice that received lymph node-derived T lymphocytes from immunized wt (Wt ➩ Wt, n = 8) or Scd1−/− mice (Scd1−/− ➩ Wt, n = 10). J EAE disease score of the wt (n = 5) and Scd1−/− (n = 4) recipient mice that received lymph node-derived T lymphocytes from immunized wt animals. All replicates were biologically independent. All data are represented as the mean ± SEM and are pooled from 3 (B) or 2 (E, H, I) independent immunizations. *P < 0.05; **P < 0.01; ***P < 0.001; calculated with Tukey’s post hoc analysis (B) or a two-tailed unpaired Student’s t-test (A, C, EK)
Fig. 2
Fig. 2. SCD1 deficiency and inhibition promote the differentiation of Tregs.
AC Frequency of CD4+, CD8+, CD4-CD8-, CD4+IFNγ+, CD4+IL17+, CD4+IL4+, and CD4+FOXP3+ cells in the lymph nodes (LN, A, B) and spleen (C) of wild-type (wt, n = 11 animals) and Scd1−/− (n = 11 animals) animals with EAE 10 days post-immunization (dpi). Representative flow cytometric plots (A) and flow cytometric analysis (B, C) are shown. D, E Wt and Scd1−/− mouse naïve T cells (D) and human naïve T cells (E) were differentiated under Treg polarizing conditions and treated with vehicle or SCD1 inhibitor (SCD1inh, CAY10566, 1 µM). For mouse T-cell cultures, the frequency of CD4+FOXP3+ cells was quantified one and two days after Treg induction (n = 8 samples). For human T-cell cultures, the frequency of CD25HiFOXP3+ cells was quantified four days after induction (n = 5 healthy controls). The results from (AE) are pooled from at least three independent experiments. F, G Suppressive capacity of wt and Scd1−/− mouse Tregs (F) or human Tregs differentiated in the presence of an SCD1 inhibitor (SCD1inh, CAY10566, 1 µM) or vehicle (G). Increasing amounts of Tregs were cultured with CFSE- or CellTrace Violet (CTV)-labeled CD4+CD25- effector T cells (F, n = 3 wt samples; G, n = 2 healthy controls). Percentage proliferation was assessed after three (F) or five (G) days. All data are represented as the mean ± SEM. *P < 0.05; **P < 0.01; ***P < 0.001, calculated with two-tailed unpaired Student’s t-test (B, C), Tukey’s post hoc analysis (D), or Mann‒Whitney analysis (EG)
Fig. 3
Fig. 3. Naïve Scd1−/− T cells display a transcriptional profile characteristic of Tregs.
AF, J Bulk RNA sequencing was performed using wild-type (wt) and Scd1−/− naïve CD4+ T cells (CD4+CD25-CD44medCD62L+). A Differential gene expression analysis of the RNA sequencing data (log2-fold change < −0.5 and > 0.5; P-value < 0.05; complete list in Supplementary Table 2). B Top five most enriched canonical pathways in Scd1−/− naïve T cells (complete list in Supplementary Fig. 3B). C Heatmap displaying the expression of genes present in the top five canonical pathways. The data were scaled by the sum of each row. D Molecular and cellular function categories associated with differentially expressed genes in Scd1−/− naïve T cells. E Heatmap displaying the expression of genes involved in the molecular and cellular function categories. The data were scaled by the sum of each row. F Top 10 transcriptional regulators most associated with the transcriptome of Scd1−/− naïve T cells. G mRNA expression of Foxp3, Ikzf2, and Rgs1 in wt and Scd1−/− naïve T cells (n = 11 samples) H, I The frequency of CD4+FOXP3+ cells and the respective mean fluorescence intensity of FOXP3 in wt and Scd1−/− naïve T-cell populations were quantified (n = 5 samples). Representative flow cytometric plots (H) and flow cytometric analysis (I) are shown. J Top 10 chemical drugs, transcriptional regulators, and other molecule types most associated with the transcriptome of Scd1−/− naïve T cells. The results are pooled from four (AF, I, J), seven (G), or five (H) independent experiments. Data from (G, I) are represented as the mean ± SEM. *P < 0.05; **P < 0.01, calculated with two-tailed unpaired Student’s t-test (G, I)
Fig. 4
Fig. 4. Scd1 deficiency results in DHA-depleted lysolecithin and triglycerides.
AE Liquid chromatography‒electrospray ionization tandem mass spectrometry (LC‒ESI‒MS/MS) analysis was performed to define the lipidome of wild-type (wt) and Scd1−/− naïve T cells (n = 2 samples). A Fatty acid composition of all lipid classes. BE Log2 fold change abundance of all lipid classes (B), fatty acyl moieties within lysophosphatidylcholine (LPC, C) and phosphatidylcholine (PC, D), and docosahexaenoic acid (DHA) within all lipid classes (E) is shown (Scd1−/− vs. wt). Only detectable fatty acyl moieties and nonesterified fatty acids and downstream metabolites are reported. F LC‒MS/MS analysis was performed to determine the abundance of nonesterified fatty acids and downstream metabolites in wt and Scd1−/− naïve T cells and spleen tissue (n = 3 samples). Log2 fold change abundance of all fatty acids and downstream metabolites is shown (Scd1−/− vs. wt). G mRNA expression of Pnpla2 in wt and Scd1−/− naïve T cells (n = 11 samples). H ATGL protein levels in wt and Scd1−/− naïve T cells (n = 4 samples). The results are pooled from two (AE, H), three (F), or seven (G) independent experiments. Data are represented as the mean (AF) or as the mean ± SEM (G). *P < 0.05; **P < 0.01, calculated with two-tailed unpaired Student’s t-test (G, H)
Fig. 5
Fig. 5. ATGL-driven release of nonesterified DHA enhances Treg differentiation in Scd1−/− T cells.
AC Wt and Scd1−/− mouse naïve T cells were differentiated under Treg polarizing conditions and treated with vehicle or ATGL inhibitor (ATGLinh, Atglistatin, 20 µM; n = 9 samples) or were transduced with ATGL-specific (shRNA ATGL) or control shRNA (Ctrl shRNA) (n = 4 samples). The frequency of CD4+FOXP3+ cells was quantified two days after Treg induction. D, E Human naïve T cells were treated with SCD1 inhibitor (SCD1inh, CAY10566, 1 µM), ATGLinh, or vehicle (n = 5 healthy controls). The frequency of CD25HiFOXP3+ cells was quantified four days after Treg induction. Representative flow cytometric plots (A, D) and flow cytometric analyses (B, C, E) are shown. F, G Wt and Scd1−/− mouse naïve T cells were differentiated under Treg polarizing conditions and treated with vehicle or BSA-conjugated DHA (1 µM; n = 4 samples). The results are pooled from at least two independent experiments and presented as the mean ± SEM. *P < 0.05; **P < 0.01; ***P < 0.001, calculated with two-tailed unpaired Student’s t-test (B, C, E, G)
Fig. 6
Fig. 6. DHA-PPARγ signaling promotes Treg differentiation in the absence of SCD1.
A, B Ligand-binding luciferase reporter assays were used to assess ligation of the different PPAR isoforms (n = 6–12 samples). Jurkat T cells were treated with vehicle, ATGL inhibitor (ATGLinh, atglistatin, 20 μM), SCD1 inhibitor (SCD1inh, CAY10566, 10 μM) (A), DHA (1 μM) (B), and/or PPAR agonists (PPARαago: WY-14643, 10 μM; PPARβago: GW501516, 10 μM; PPARγago: rosiglitazone, 10 μM) for 24 h, after which PPAR ligation was assessed. C, D Wild-type (wt) and Scd1−/− naïve T cells were differentiated under Treg polarizing conditions and treated with vehicle, PPARα antagonist (PPARαanta: GW6471, 25 μM; n = 7–13 samples), PPARβ antagonist (PPARβanta: PTS58, 25 μM; n = 5–7 samples), and PPARγ antagonist (PPARγanta: GW9662, 25 μM; n = 18–20 samples). The frequency of CD4+FOXP3+ cells was quantified one day after Treg induction. Representative flow cytometric plots (C) and flow cytometric analysis (D) are shown. E Human naïve T cells were differentiated under Treg polarizing conditions and treated with vehicle (n = 5 healthy controls), PPARα antagonist (PPARαanta: GW6471, 25 μM; n = 3 healthy controls), PPARβ antagonist (PPARβanta: PTS58, 25 μM; n = 3 healthy controls) or PPARγ antagonist (PPARγanta: 25 μM; n = 4 healthy controls). The frequency of CD25+FOXP3+ cells among total CD4+ cells was quantified four days after Treg induction by flow cytometry. F, G Wt and Scd1−/− mice with EAE were treated daily with vehicle or a PPARγ antagonist (GW9662, 2 mg/kg, n = 5/group). Lymph nodes were collected 28 days postimmunization. EAE disease score (F) and flow cytometric analysis of the frequency of CD4+FOXP3+ cells in the lymph nodes (G). Data are represented as the mean ± SEM. **P < 0.01, calculated with Tukey’s post hoc analysis

Similar articles

Cited by

References

    1. Dominguez-Villar M, Hafler DA. Regulatory T cells in autoimmune disease. Nat Immunol. 2018;19:665–73. doi: 10.1038/s41590-018-0120-4. - DOI - PMC - PubMed
    1. Alissafi T, Kalafati L, Lazari M, Filia A, Kloukina I, Manifava M, et al. Mitochondrial oxidative damage underlies regulatory T cell defects in autoimmunity. Cell Metab. 2020;32:591–604 e597. doi: 10.1016/j.cmet.2020.07.001. - DOI - PMC - PubMed
    1. Kleinewietfeld M, Hafler DA. Regulatory T cells in autoimmune neuroinflammation. Immunol Rev. 2014;259:231–44. doi: 10.1111/imr.12169. - DOI - PMC - PubMed
    1. Bogie JFJ, Haidar M, Kooij G, Hendriks JJA. Fatty acid metabolism in the progression and resolution of CNS disorders. Adv Drug Deliv Rev. 2020;159:198–213. doi: 10.1016/j.addr.2020.01.004. - DOI - PubMed
    1. Swank RL, Lerstad O, Strom A, Backer J. Multiple sclerosis in rural Norway its geographic and occupational incidence in relation to nutrition. New Engl J Med. 1952;246:722–8. doi: 10.1056/NEJM195205082461901. - DOI - PubMed

Publication types