. 2023 Apr 11;18(1):67.
doi: 10.1186/s13014-023-02257-w.

A nomogram model based on pre-treatment and post-treatment MR imaging radiomics signatures: application to predict progression-free survival for nasopharyngeal carcinoma

Affiliations

A nomogram model based on pre-treatment and post-treatment MR imaging radiomics signatures: application to predict progression-free survival for nasopharyngeal carcinoma

Mi-Xue Sun et al. Radiat Oncol. .

Abstract

Background: To establish a novel model using radiomics analysis of pre-treatment and post-treatment magnetic resonance (MR) images for prediction of progression-free survival in the patients with stage II-IVA nasopharyngeal carcinoma (NPC) in South China.

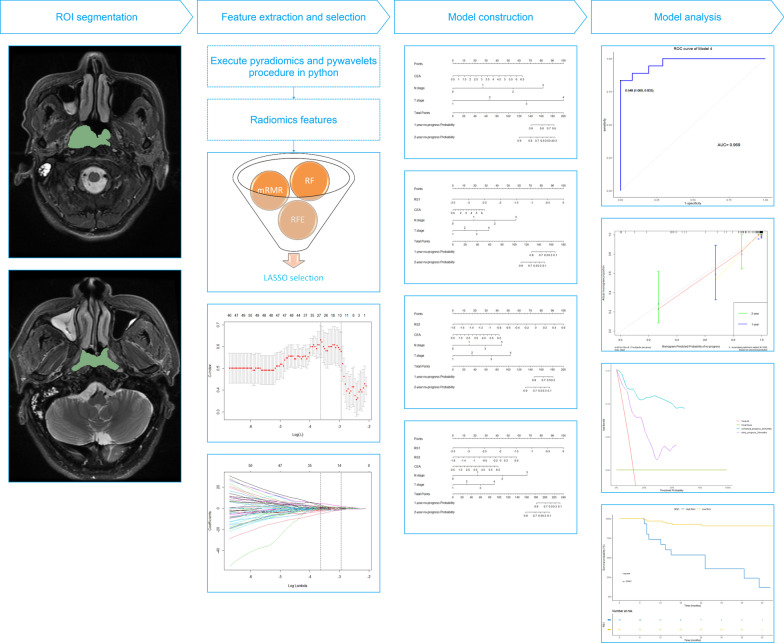
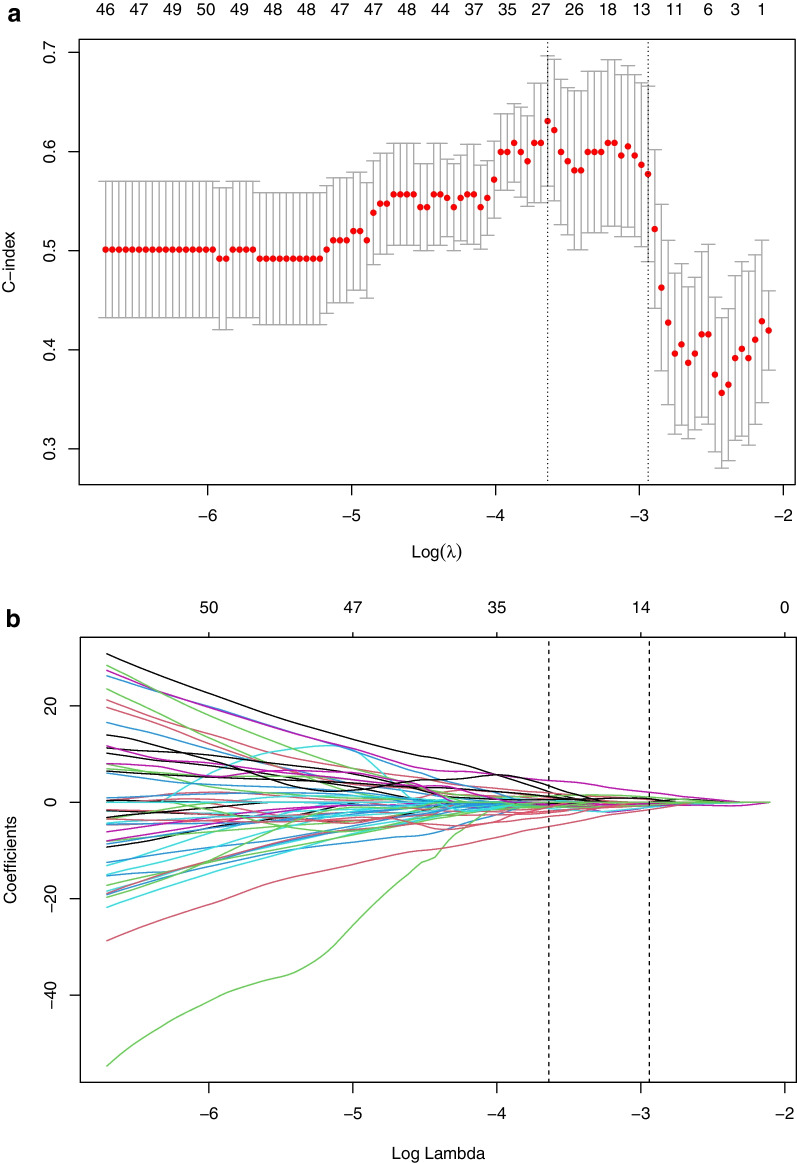
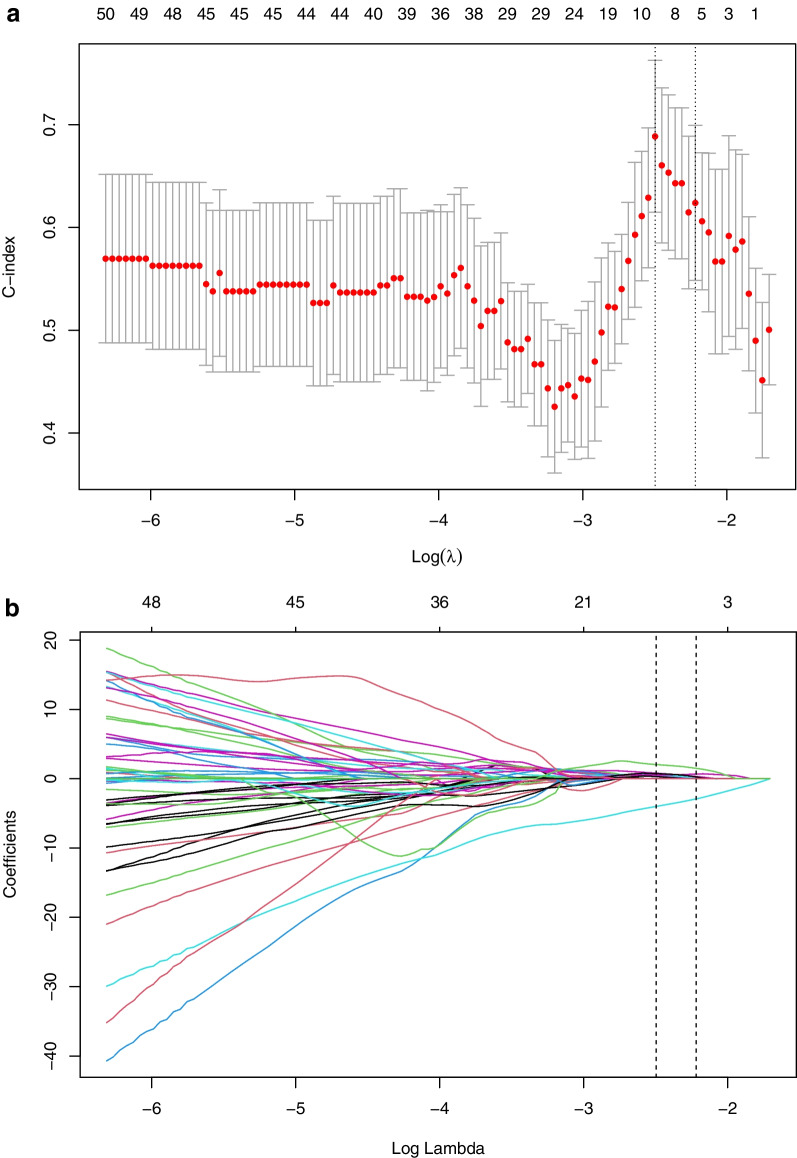
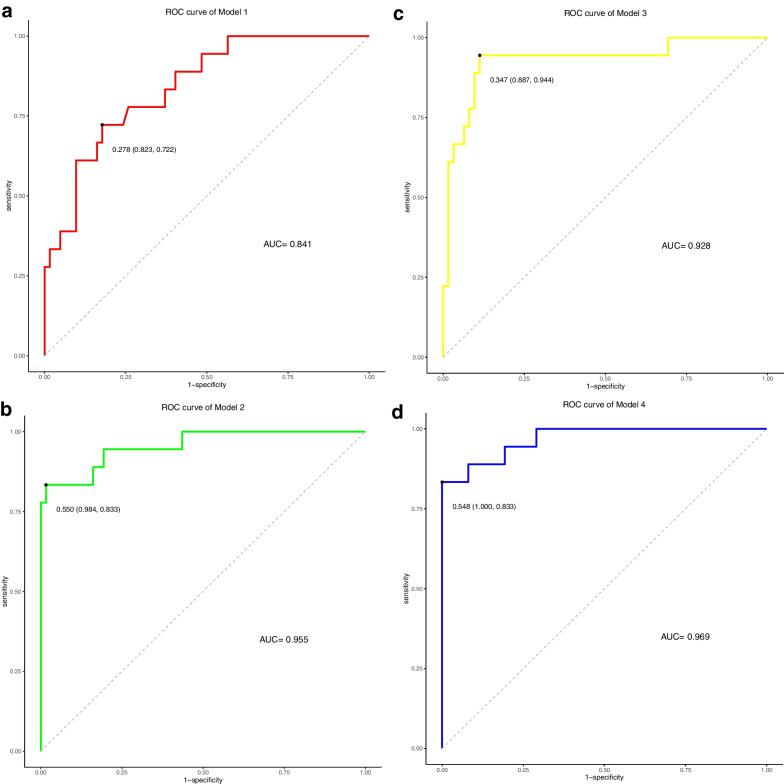
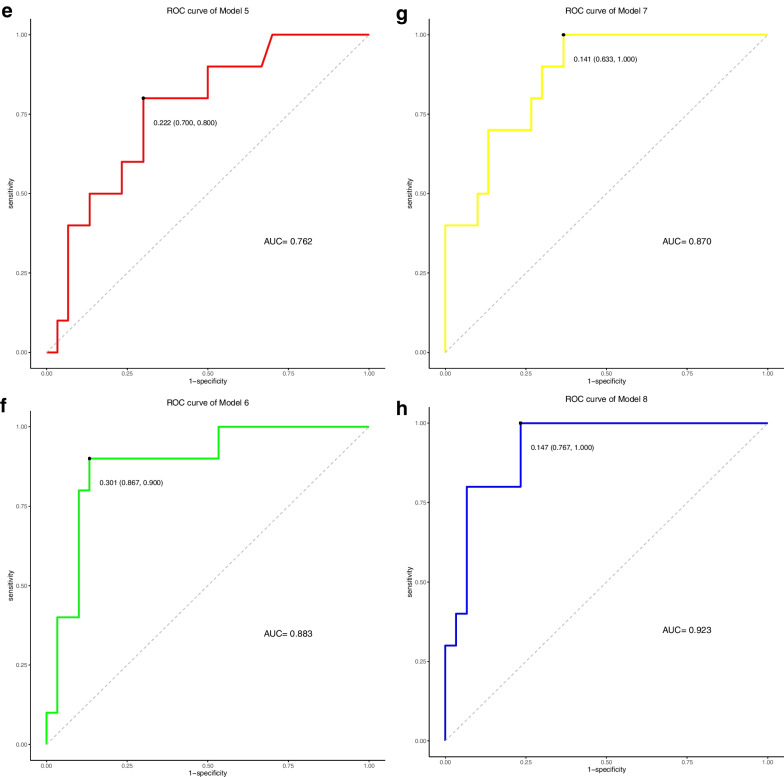
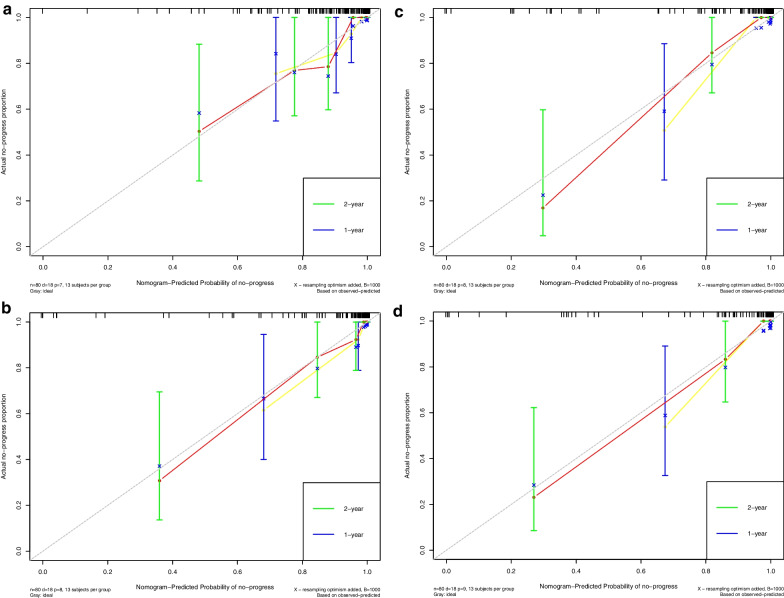
Methods: One hundred and twenty NPC patients who underwent chemoradiotherapy were enrolled (80 in the training cohort and 40 in the validation cohort). Acquiring data and screening features were performed successively. Totally 1133 radiomics features were extracted from the T2-weight images before and after treatment. Least absolute shrinkage and selection operator regression, recursive feature elimination algorithm, random forest, and minimum-redundancy maximum-relevancy (mRMR) method were used for feature selection. Nomogram discrimination and calibration were evaluated. Harrell's concordance index (C-index) and receiver operating characteristic (ROC) analyses were applied to appraise the prognostic performance of nomograms. Survival curves were plotted using Kaplan-Meier method.

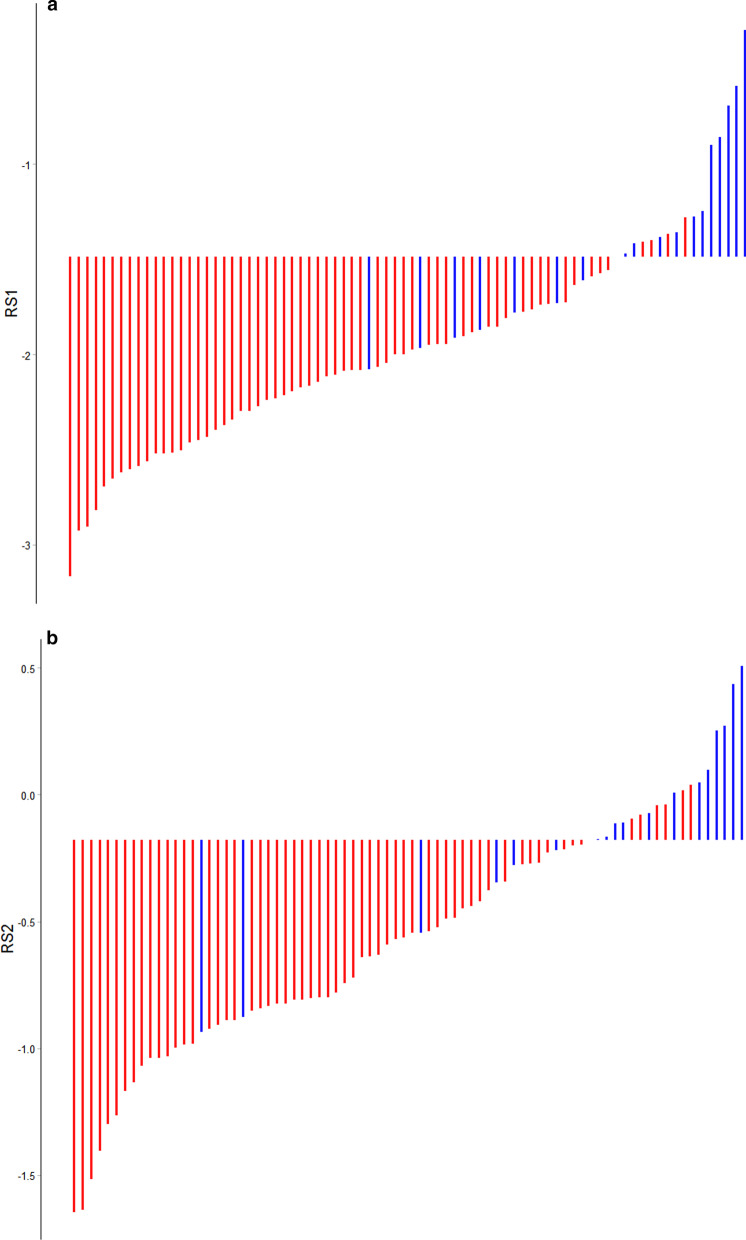
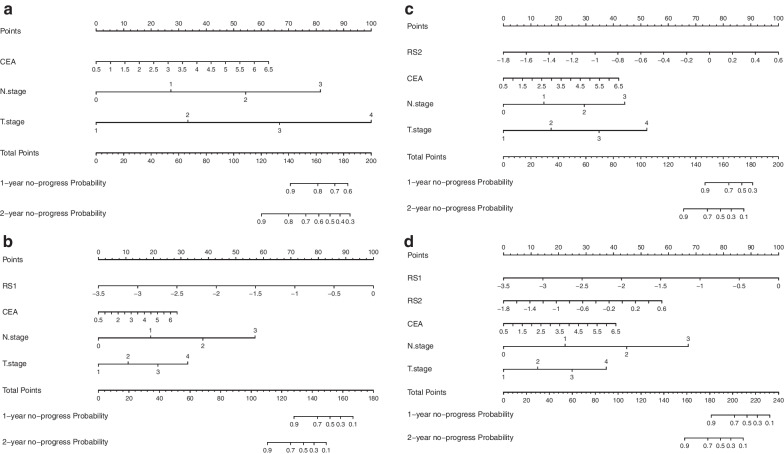
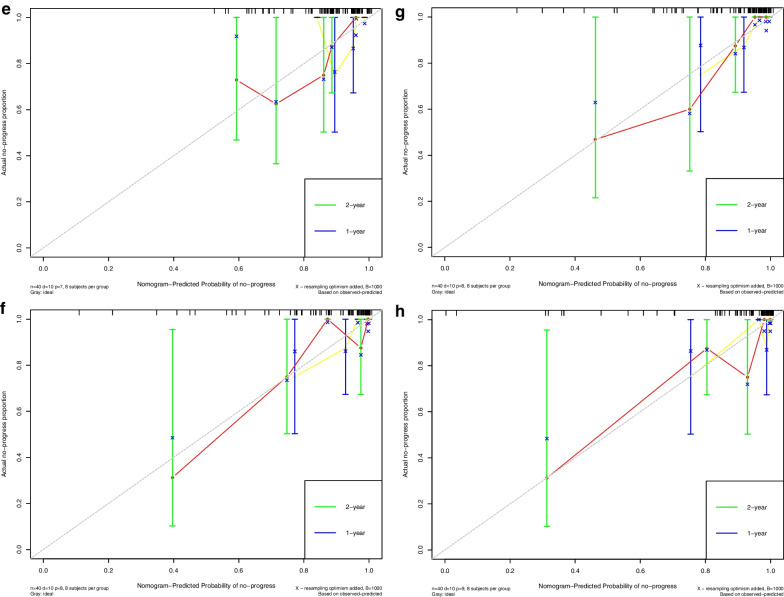
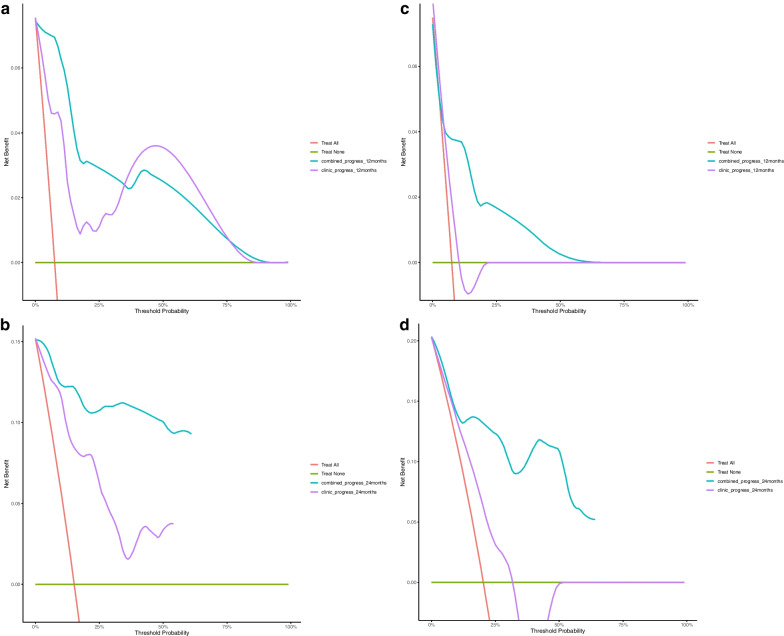
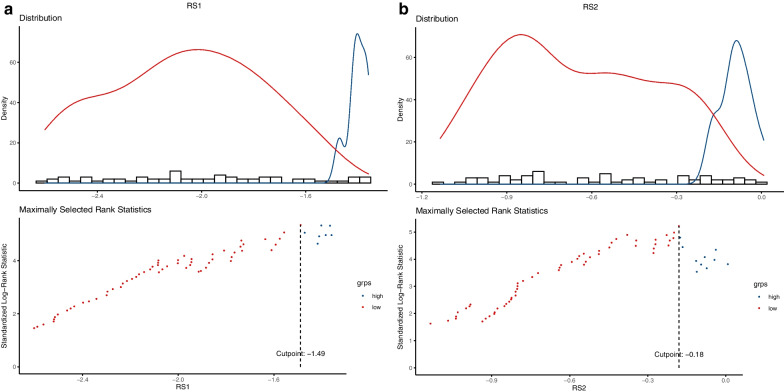
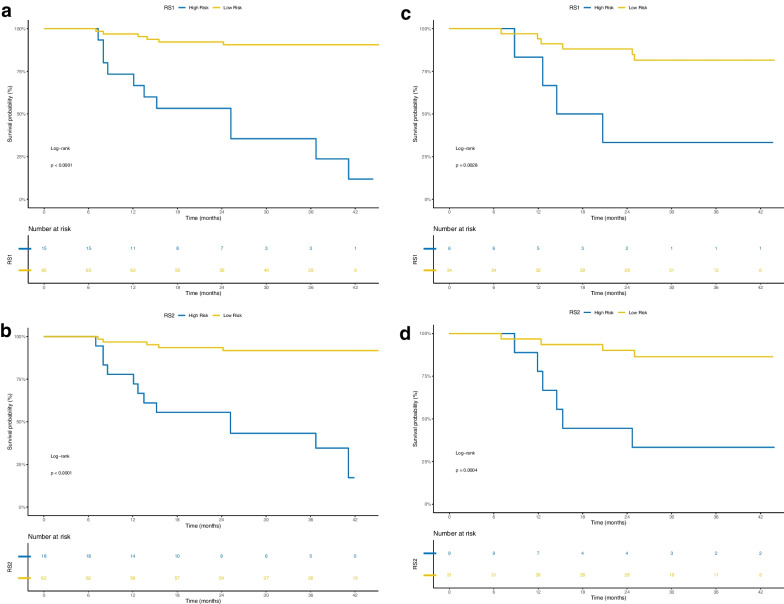
Results: Integrating independent clinical predictors with pre-treatment and post-treatment radiomics signatures which were calculated in conformity with radiomics features, we established a clinical-and-radiomics nomogram by multivariable Cox regression. Nomogram consisting of 14 pre-treatment and 7 post-treatment selected features has been proved to yield a reliable predictive performance in both training and validation groups. The C-index of clinical-and-radiomics nomogram was 0.953 (all P < 0.05), which was higher than that of clinical (0.861) or radiomics nomograms alone (based on pre-treatment statistics: 0.942; based on post-treatment statistics: 0.944). Moreover, we received Rad-score of pre-treatment named RS1 and post-treatment named RS2 and all were used as independent predictors to divide patients into high-risk and low-risk groups. Kaplan-Meier analysis showed that lower RS1 (less than cutoff value, - 1.488) and RS2 (less than cutoff value, - 0.180) were easier to avoid disease progression (all P < 0.01). It showed clinical benefit with decision curve analysis.

Conclusions: MR-based radiomics measured the burden on primary tumor before treatment and the tumor regression after chemoradiotherapy, and was used to build a model to predict progression-free survival (PFS) in the stage II-IVA NPC patients. It can also help to distinguish high-risk patients from low-risk patients, thus guiding personalized treatment decisions effectively.

Keywords: Magnetic resonance imaging; Nasopharyngeal carcinoma; Nomogram; Prognosis; Progression-free survival; Radiomics.


Conflict of interest statement

The authors declare that they have no competing interests.

Figures

Fig. 1
Fig. 1
Radiomics workflow in this study
Fig. 2
Fig. 2
Selection of radiomics features before treatment via the least absolute shrinkage and selection operator (LASSO) Cox regression model. Tuning parameter (λ) selection in this model used tenfold cross-validation via the minimum criteria. A The Harrell’s concordance index (C-index) was plotted versus log(λ). Dotted vertical lines were drawn at the optimal values by using the minimum criteria and the 1 standard error of the minimum criteria (the 1-SE criteria), and the line on the right with λ value of 0.05284452 was chosen according to tenfold cross-validation. B LASSO coefficient profiles of the 278 radiomics features. A coefficient profile plot was generated versus value of log (λ). Two vertical lines were drawn at the value selected using tenfold cross-validation, where optimal λ pointed to 12 nonzero coefficients
Fig. 3
Fig. 3
Selection of radiomics features after treatment via the LASSO Cox regression model. Tuning parameter (λ) selection in this model used tenfold cross-validation via the minimum criteria. A The C-index was plotted versus log(λ). Dotted vertical lines were drawn at the optimal values by using the minimum criteria and the 1 standard error of the minimum criteria (the 1-SE criteria), and the line on the right with λ value of 0.1087473 was chosen according to tenfold cross-validation. B LASSO coefficient profiles of the 299 radiomics features. A coefficient profile plot was generated versus value of log (λ). Two vertical lines were drawn at the value selected using tenfold cross-validation, where optimal λ pointed to 9 nonzero coefficients
Fig. 4
Fig. 4
Distributions of Rad-score of disease progression and no-progression groups in training cohort: A RS1. B RS2. Red bars showed points for patients who survived without locoregional recurrence or distant metastasis, while blue bars showed points for those who experienced progression or died.
Fig. 5
Fig. 5
Receiver operating characteristic (ROC) curves for progression-free survival (PFS) models, which were based on data before and after treatment. A, E clinical variables, B, F clinical variables and RS1, C, G clinical variables and RS2, and D, H clinical variables integrated with RS1 and RS2 in the training and validation cohorts, respectively
Fig. 5
Fig. 5
Receiver operating characteristic (ROC) curves for progression-free survival (PFS) models, which were based on data before and after treatment. A, E clinical variables, B, F clinical variables and RS1, C, G clinical variables and RS2, and D, H clinical variables integrated with RS1 and RS2 in the training and validation cohorts, respectively
Fig. 6
Fig. 6
Established clinical nomogram and various clinical-and-radiomics nomograms according to the data before and after treatment. Nomogram A, including selected clinical risk factors of Table 2, Nomogram B, referring to add RS1 on the basis of clinical risk factors, and Nomogram C, referring to add RS2 on the basis of clinical risk factors, for one- and two-year progression-free survival in patients with NPC. Nomogram D, that was composite clinical-and-radiomics model, for one- and two-year progression-free survival in NPC patients
Fig. 7
Fig. 7
Calibration curves of clinical nomogram and clinical-and-radiomics nomograms in the training (A, B, C, D) and validation cohorts (E, F, G, H)
Fig. 7
Fig. 7
Calibration curves of clinical nomogram and clinical-and-radiomics nomograms in the training (A, B, C, D) and validation cohorts (E, F, G, H)
Fig. 8
Fig. 8
Decision curve analysis for clinical and radiomics nomogram models in the training A, C and validation cohorts B, D. The red line represented the net benefit. The x-axis represented high-risk threshold probability. The purple line and blue line represented net benefit of the clinical model and clinical-and-radiomics nomogram, respectively
Fig. 9
Fig. 9
Threshold diagram of Rad-score (RS): A RS1. B RS2
Fig. 10
Fig. 10
Kaplan–Meier diagrams of NPC patients stratified according to RS1 and RS2, and it displayed a statistically significant difference for PFS with log-rank P value < 0.05. The risk table is shown at the bottom of the plots. PFS survival curve of patients in the training cohort: A RS1, B RS2. PFS survival curve of patients in the validation cohort: C RS1, D RS2

Similar articles

Cited by

References

    1. Bray F, Ferlay J, Soerjomataram I, Siegel RL, Torre LA, Jemal A. Global cancer statistics 2018: GLOBOCAN estimates of incidence and mortality worldwide for 36 cancers in 185 countries. CA Cancer J Clin. 2018;68(6):394–424. doi: 10.3322/caac.21492. - DOI - PubMed
    1. Sung H, Ferlay J, Siegel RL, Laversanne M, Soerjomataram I, Jemal A, Bray F. Global cancer statistics 2020: GLOBOCAN estimates of incidence and mortality worldwide for 36 cancers in 185 countries. CA Cancer J Clin. 2021;71(3):209–249. doi: 10.3322/caac.21660. - DOI - PubMed
    1. Sun X, Su S, Chen C, Han F, Zhao C, Xiao W, Deng X, Huang S, Lin C, Lu T. Long-term outcomes of intensity-modulated radiotherapy for 868 patients with nasopharyngeal carcinoma: an analysis of survival and treatment toxicities. Radiother Oncol. 2014;110(3):398–403. doi: 10.1016/j.radonc.2013.10.020. - DOI - PubMed
    1. Wu MY, He XY, Hu CS. Tumor regression and patterns of distant metastasis of T1–T2 nasopharyngeal carcinoma with intensity-modulated radiotherapy. PLoS ONE. 2016;11(4):e0154501. doi: 10.1371/journal.pone.0154501. - DOI - PMC - PubMed
    1. Lee N, Harris J, Garden AS, Straube W, Glisson B, Xia P, Bosch W, Morrison WH, Quivey J, Thorstad W, et al. Intensity-modulated radiation therapy with or without chemotherapy for nasopharyngeal carcinoma: radiation therapy oncology group phase II trial 0225. J Clin Oncol. 2009;27(22):3684–3690. doi: 10.1200/JCO.2008.19.9109. - DOI - PMC - PubMed

LinkOut - more resources