. 2023 Apr 11;13(1):72.
doi: 10.1186/s13578-023-01015-5.

Improving the response to oxaliplatin by targeting chemotherapy-induced CLDN1 in resistant metastatic colorectal cancer cells

Affiliations

Improving the response to oxaliplatin by targeting chemotherapy-induced CLDN1 in resistant metastatic colorectal cancer cells

Sara Cherradi et al. Cell Biosci. .

Abstract

Background: Tumor resistance is a frequent cause of therapy failure and remains a major challenge for the long-term management of colorectal cancer (CRC). The aim of this study was to determine the implication of the tight junctional protein claudin 1 (CLDN1) in the acquired resistance to chemotherapy.

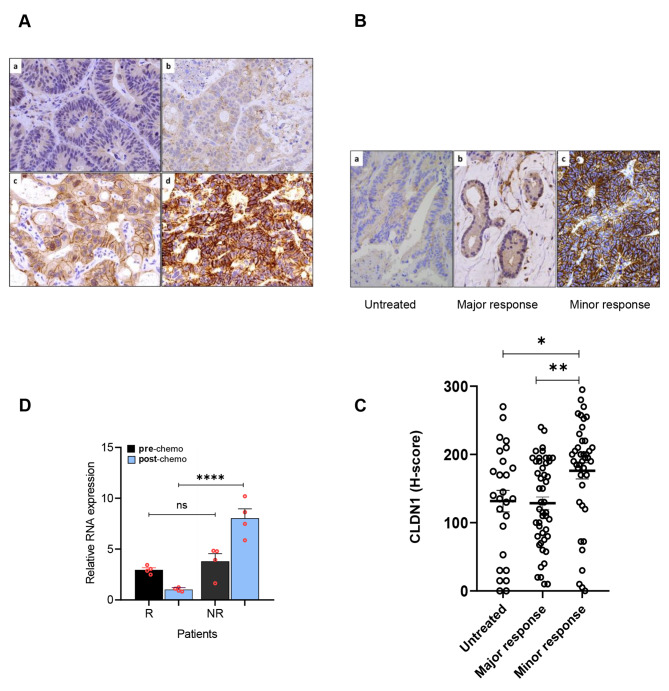
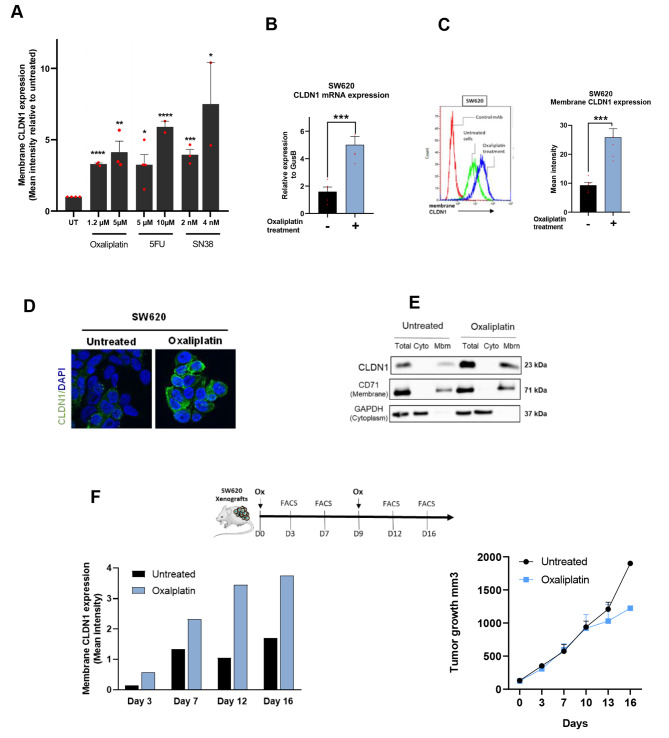
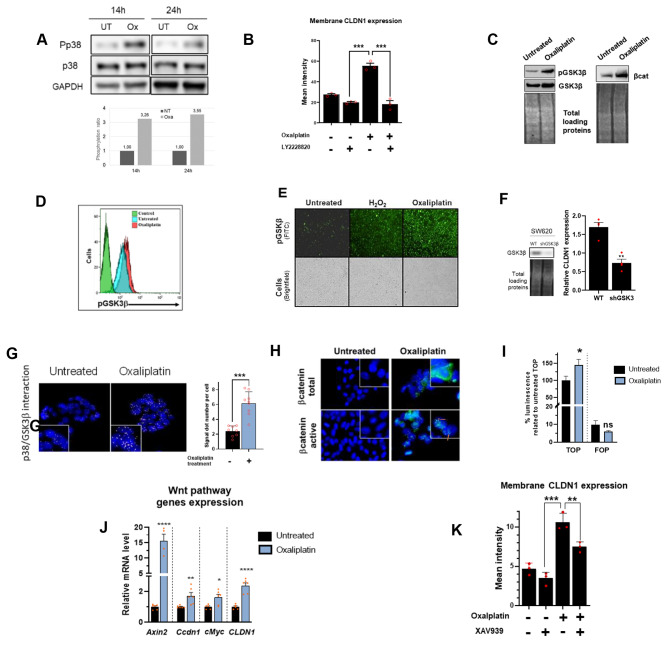
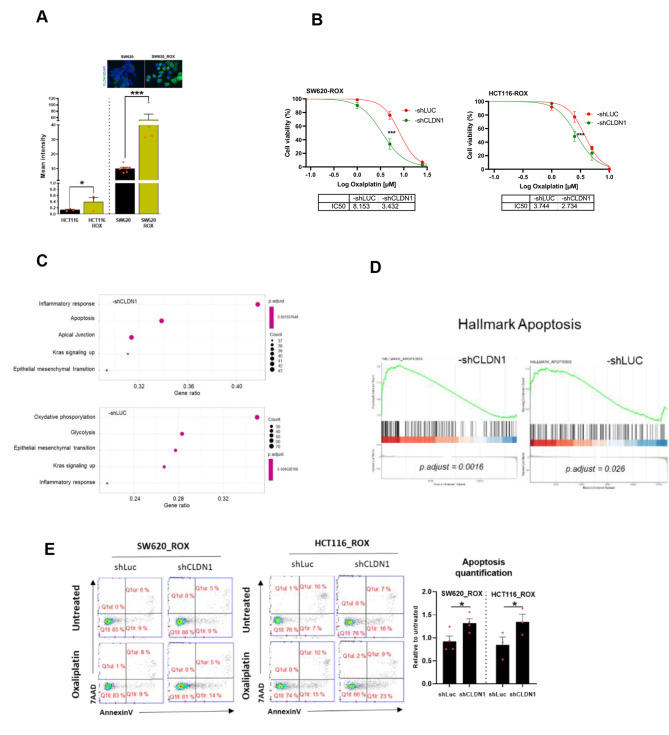
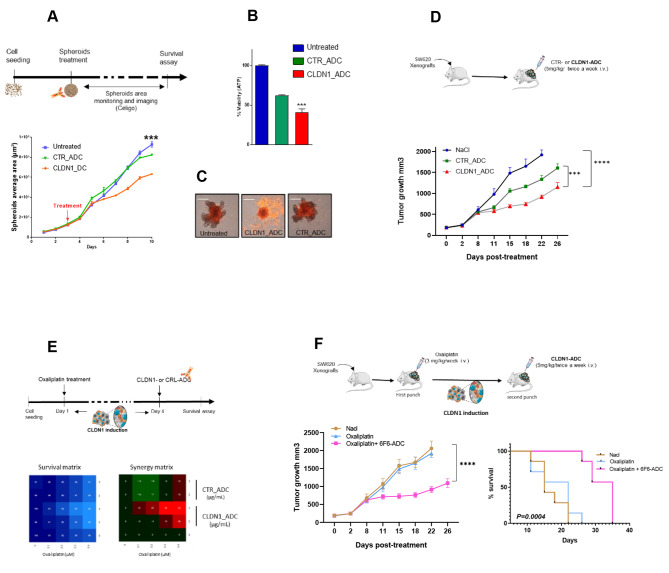
Methods: Immunohistochemistry was used to determine CLDN1 expression in post-chemotherapy liver metastases from 58 CRC patients. The effects of oxaliplatin on membrane CLDN1 expression were evaluated by flow cytometry, immunofluorescence and western blotting experiments in vitro and in vivo. Phosphoproteome analyses, proximity ligation and luciferase reporter assays were used to unravel the mechanism of CLDN1 induction. RNAseq experiments were performed on oxaliplatin-resistant cell lines to investigate the role of CLDN1 in chemoresistance. The "one-two punch" sequential combination of oxaliplatin followed by an anti-CLDN1 antibody-drug conjugate (ADC) was tested in both CRC cell lines and murine models.

Results: We found a significant correlation between CLDN1 expression level and histologic response to chemotherapy, CLDN1 expression being the highest in resistant metastatic residual cells of patients showing minor responses. Moreover, in both murine xenograft model and CRC cell lines, CLDN1 expression was upregulated after exposure to conventional chemotherapies used in CRC treatment. CLDN1 overexpression was, at least in part, functionally related to the activation of the MAPKp38/GSK3β/Wnt/β-catenin pathway. Overexpression of CLDN1 was also observed in oxaliplatin-resistant CRC cell lines and was associated with resistance to apoptosis, suggesting an anti-apoptotic role for CLDN1. Finally, we demonstrated that the sequential treatment with oxaliplatin followed by an anti-CLDN1 ADC displayed a synergistic effect in vitro and in in vivo.

Conclusion: Our study identifies CLDN1 as a new biomarker of acquired resistance to chemotherapy in CRC patients and suggests that a "one-two punch" approach targeting chemotherapy-induced CLDN1 expression may represent a therapeutic opportunity to circumvent resistance and to improve the outcome of patients with advanced CRC.

Keywords: ADC; Biomarker; CLDN1; Chemotherapy; Colorectal cancer; Resistance; “One-two punch”.


Conflict of interest statement

The authors declare that they have no competing interests.

Figures

Fig. 1
Fig. 1
Immunohistochemical analysis of CLDN1 expression in post-chemotherapy colorectal cancer liver metastasis specimens. (A) Representative images of liver metastases from colorectal cancers after chemotherapy with various CLDN1 expression levels: no detectable signal (a), weak (b), moderate (c), and strong signal intensity (d); immunoperoxidase x400. (B) CLDN1 membrane expression in a non-treated metastasis (a), in residual tumor cells of liver metastasis specimens that displayed minor response (b) and major response (c) to chemotherapy; immunoperoxidase x400. (C) Comparison of CLDN1 expression in untreated (n = 26), major response (n = 48) and minor response (n = 41) metastasis specimens from patients with colorectal cancer. * p = 0.018 and **p = 0.002 (Kruskal-Wallis test). (D) CLDN1 RNA expression before/after chemotherapy in metastasis specimens from one responder (R) and one non-responder (NR) patients with colorectal cancer according to the RECIST response criteria: R (-87%), NR (0%). Quantitative RT-PCR was performed twice on each of the two different RNA samples from the same metastatic biopsy both prior to treatment and after treatment (n = 4). ****p < 0.0001 (one-way ANOVA test)
Fig. 2
Fig. 2
CLDN1 is overexpressed at the membrane of colorectal cancer cells after exposure to chemotherapy drugs. (A) Flow cytometry analysis of CLDN1 expression at the surface of SW620 cells incubated with conventional chemotherapy agents (5-FU, SN38, oxaliplatin) at two concentrations. * p ≤ 0.05, ** p ≤ 0.01, *** p ≤ 0.001, **** p ≤ 0.0001 (Student’s t-test). (B) Relative CLDN1 gene expression in SW620 cells before (-) and after (+) incubation with oxaliplatin (1.2 µM for 72 h); *** p ≤ 0.001 (Student’s t-test). (C) Membrane CLDN1 expression analyzed by flow cytometry in SW620 cells before (-) and after (+) incubation with oxaliplatin (1.2 µM for 72 h); *** p ≤ 0.001 (Student’s t-test). (D) Immunofluorescence analysis of CLDN1 membrane expression in SW620 cells before (-) and after (+) incubation with oxaliplatin (1.2 µM for 72 h) (E) Subcellular localization of CLDN1 by western blotting in SW620 cells before (-) and after (+) incubation with oxaliplatin (1.2 µM for 72 h). CD71 and β-actin were used as markers for the membrane and cytoplasm fractions, respectively. Cyto, cytoplasm; Mbm, membrane. (F) In vivo kinetics of CLDN1 expression at the tumor cell membrane. Top: experimental setup: mice xenografted with SW620 cells were treated at day 0 and day 9 or not with oxaliplatin (Ox; 2 mg/kg). At the indicated time points, two tumors per condition were removed, dissociated and analyzed by flow cytometry. Left: Histograms showing CLDN1 membrane expression (g-mean) in untreated (black) and oxaliplatin-treated (blue) tumors. Right: tumor growth curves in untreated and oxaliplatin-treated mice xenografted with SW620 cells
Fig. 3
Fig. 3
Oxaliplatin-mediated membrane CLDN1 expression is dependent on MAPKp38,/GSK3β/ Wnt-βcat signaling cascade (A) Analysis of MAPK p38 phosphorylation (Pp38) by western botting in SW620 cells after incubation or not (UT) with oxaliplatin for 14 and 24 h (1.2 µM) Top: representative western blotting image; bottom: quantification of MAPK p38 phosphorylation level in the different conditions. (B) CLDN1 expression at the membrane (g-mean quantification) of SW620 cells incubated (+) or not (-) with oxaliplatin and/or LY2228820 (p38 inhibitor) (1 µM) for 72 h p ≤ 0.001 (Student’s t-test). (C) Western blotting showing the expression of GSK3β, GSK3βSer9 and β-catenin in SW620 cells incubated or not with oxaliplatin (5µM for 24 h). (D-E) GSK3βSer9 expression evaluated (D) by flow cytometry and (E) by immunofluorescence using the Celigo™ imaging cytometer. Incubation with H2O2 was used as positive control because it increases GSK3β phosphorylation at Ser9 (20). (F) GSK3β silencing. Left, western blot analysis of GSK3β expression in SW620 cells in which GSK3β was silenced (shGSK3β) or not (WT). Right, effect of GSK3β silencing on CLDN1 membrane expression after incubation with oxaliplatin (1.2 µM for 72 h) evaluated by FACS relative to non-silenced cells ** p = 0.001 (Student’s t-test). (G) Proximity ligation assay (PLA) with oligonucleotide-conjugated antibodies against p38 and GSK3β in SW620 cells incubated or not with oxaliplatin (5µM for 24 h). Left: Fluorescence images, nuclei were counterstained with DAPI (blue). Right: PLA dot counts per cell in the corresponding fluorescence images p ≤ 0.001 (Student’s t-test) (H) Expression and localisation of total and inactive (phosphorylated) βcatenin by immunofluorescence staining in SW620 cells after incubation or not with oxaliplatin (5µM for 72 h). In treated cells, total β-catenin expression increases and inactive β-catenin translocates to the nucleus (arrow) (I) The TOP/FOP Flash luciferase assay shows the transcriptional activation of the Wnt/β-catenin signaling pathway in SW620 cells after oxaliplatin incubation (5µM for 72 h) compared with untreated cells. * p = 0.01 (paired t-test) (J) Oxaliplatin (5µM for 72 h) effect on the mRNA expression of Wnt /β-catenin target genes in SW620 cells compared with untreated cells (Student’s t-test). (K) Oxaliplatin-induced (1.2µM for 72 h) CLDN1 membrane expression increase is reduced when SW620 cells are co-incubated with 7.5 µM XAV939 (small molecule inhibitor of tankyrase) ****p < 0.0001 (one-way ANOVA test)
Fig. 4
Fig. 4
CLDN1 is a key mediator to oxaliplatin resistance in CRC cell lines (A) CLDN1 membrane expression in oxaliplatin-resistant cell lines and their parental cell lines. Top: Immunofluorescence images of CLDN1 membrane expression in SW620-ROX cells (oxaliplatin resistant) and in SW620 cells (parental line). (B) Effect of CLDN1 silencing (shCLDN1) on oxaliplatin IC50 in the two oxaliplatin-resistant cell lines incubated with oxaliplatin compared with the shLUC controls. (C) Five GSEA hallmarks deregulated after oxaliplatin treatment with significantly enriched genes in SW620_ROX–shCLDN1 and -shLUC cells. Dot plots indicate the gene ratios (number of core genes over the total number of genes in the set). Dots are colored in function of the adjusted p-value and their size in the gene set. (D) Enrichment plots for the apoptosis hallmark. The location of the gene set members is indicated by vertical black lines and showed a significant positive enrichment (left) in SW620_ROX–shCLDN1 cell samples compared with SW620_ROX-shLUC samples (E) FACS profiles of annexin V-APC/7-AAD staining in the two oxaliplatin-resistant cell lines in which CLDN1 was silenced (-shCLDN1) or not (-shLUC) and incubated or not with oxaliplatin (5µM for 24 h). Apoptosis was quantified in at least three experiments (Student’s t-test)
Fig. 5
Fig. 5
Therapeutic effect of an anti-CLDN1 ADC in colorectal cancer cells and “one-two punch” therapeutic approach. (A) Growth curve of SW620 cell spheroids incubated with 10 µg/mL of 6F6-ADC, Control-ADC (anti-CD20 mAb), or not for 7 days monitored with the Celigo™ imaging cytometer. (B) Cell survival in spheroids at the experiment end was determined with a cytotoxicity assay. The luminescence intensity (i.e. viable cells) was measured and compared in the three conditions described in (A). (C) Spheroids were incubated with 1 µg/m of propidium iodide (PI) that emits a red fluorescence red when incorporated in dead cells. Images were acquired using the Celigo™ imaging cytometer. (D) Effect of 6F6–ADC and control-ADC (Human IgG1, kappa Isotype Control) on the growth of SW620 cell xenografts in athymic nude mice. Mice were treated or not (blue) with 5 mg/kg of Control-ADC (green) or 6F6-ADC (red) per week starting when tumors reached 100 mm3 (n = 7 mice per group). (E) In vitro analysis of the effects of the oxaliplatin + 6F6-ADC combination in SW620 cells. At 24 h post-seeding cells were incubated with increasing doses of oxaliplatin and 72 h later with increasing doses of 6F6-ADC or control-ADC. One week later, the cell viability assay was performed. The blue matrix represents cell viability. In the synergy matrix, red, black, and green represent synergy, additivity, and antagonism, respectively. (F) Tumor growth curves in mice xenografted with SW620 cells untreated, treated with oxaliplatin alone or with the sequential combination of oxaliplatin and 6F6-ADC (7 mice per group). Adapted Kaplan-Meier curves using the time taken to reach a tumor volume of 1500 mm3 in untreated, oxaliplatin-treated and sequential combination-treated mice (log-rank test)

References

    1. Rawla P, Sunkara T, Barsouk A. Epidemiology of colorectal cancer: incidence, mortality, survival, and risk factors. Prz Gastroenterol. 2019;14:89–103. - PMC - PubMed
    1. De Rosa M, Pace U, Rega D, Costabile V, Duraturo F, Izzo P, et al. Genetics, diagnosis and management of colorectal cancer (review) Oncol Rep. 2015;34:1087–96. doi: 10.3892/or.2015.4108. - DOI - PMC - PubMed
    1. Xie Y-H, Chen Y-X, Fang J-Y. Comprehensive review of targeted therapy for colorectal cancer. Signal Transduct Target Ther. 2020;5:22. doi: 10.1038/s41392-020-0116-z. - DOI - PMC - PubMed
    1. Vasan N, Baselga J, Hyman DM. A view on drug resistance in cancer. Nature. 2019;575:299–309. doi: 10.1038/s41586-019-1730-1. - DOI - PMC - PubMed
    1. Yanagisawa Y, Maruta F, Iinuma N, Ishizone S, Koide N, Nakayama J, et al. Modified Irinotecan/5FU/Leucovorin therapy in advanced colorectal cancer and predicting therapeutic efficacy by expression of tumor-related enzymes. Scand J Gastroenterol. 2007;42:477–84. doi: 10.1080/00365520600994418. - DOI - PubMed

LinkOut - more resources