

Agaricus subrufescens fermented rye affects the development of intestinal microbiota, local intestinal and innate immunity in suckling-to-nursery pigs
- PMID: 37041617
- PMCID: PMC10088699
- DOI: 10.1186/s42523-023-00244-w
Agaricus subrufescens fermented rye affects the development of intestinal microbiota, local intestinal and innate immunity in suckling-to-nursery pigs
Abstract
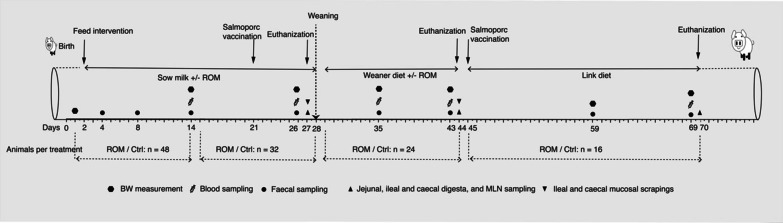
Background: Agaricus subrufescens is considered as one of the most important culinary-medicinal mushrooms around the world. It has been widely suggested to be used for the development of functional food ingredients to promote human health ascribed to the various properties (e.g., anti-inflammatory, antioxidant, and immunomodulatory activities). In this context, the interest in A. subrufescens based feed ingredients as alternatives for antibiotics has also been fuelled during an era of reduced/banned antibiotics use. This study aimed to investigate the effects of a fermented feed additive -rye overgrown with mycelium (ROM) of A. subrufescens-on pig intestinal microbiota, mucosal gene expression and local and systemic immunity during early life. Piglets received ROM or a tap water placebo (Ctrl) perorally every other day from day 2 after birth until 2 weeks post-weaning. Eight animals per treatment were euthanized and dissected on days 27, 44 and 70.
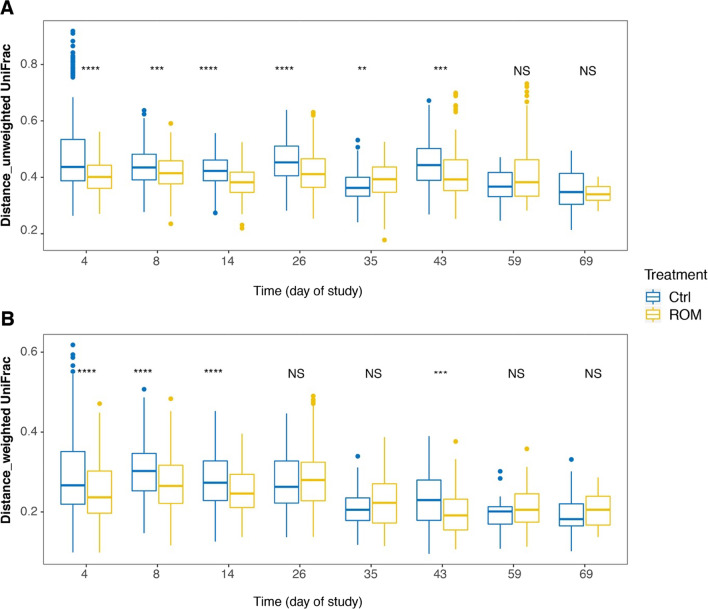
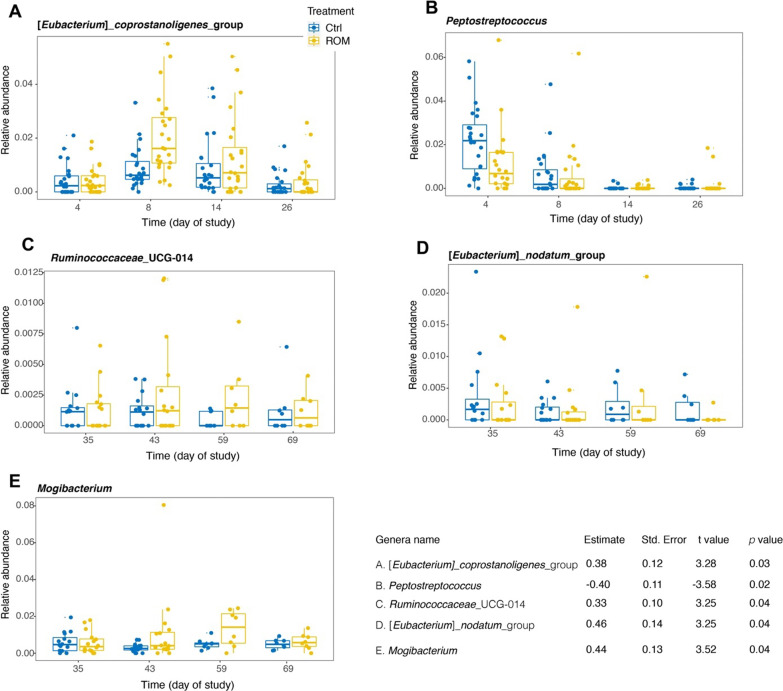
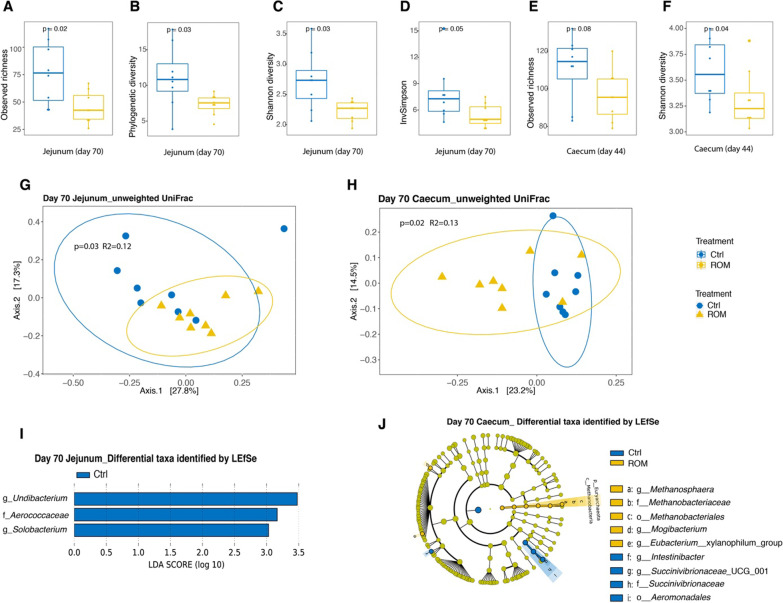
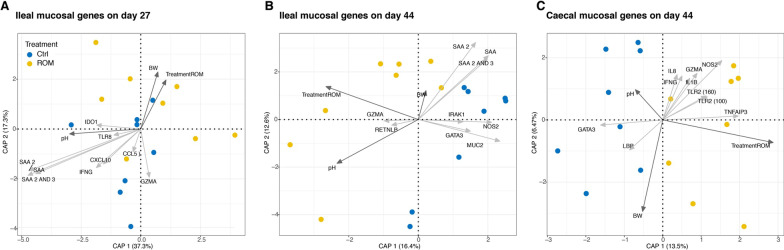
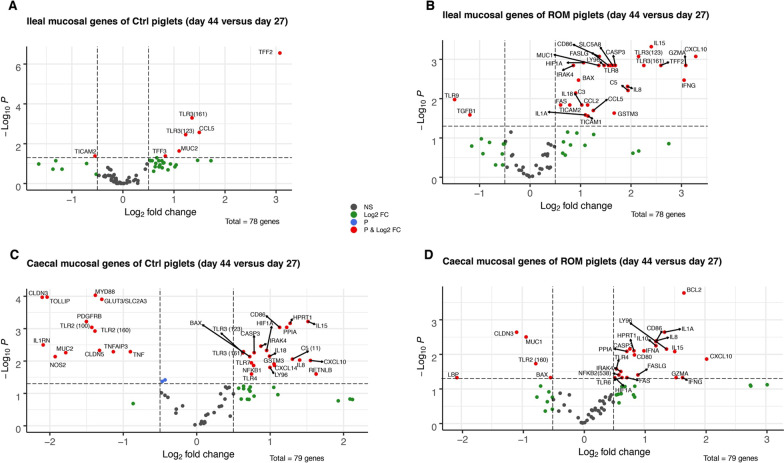
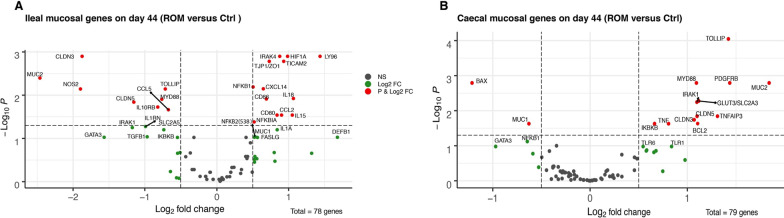
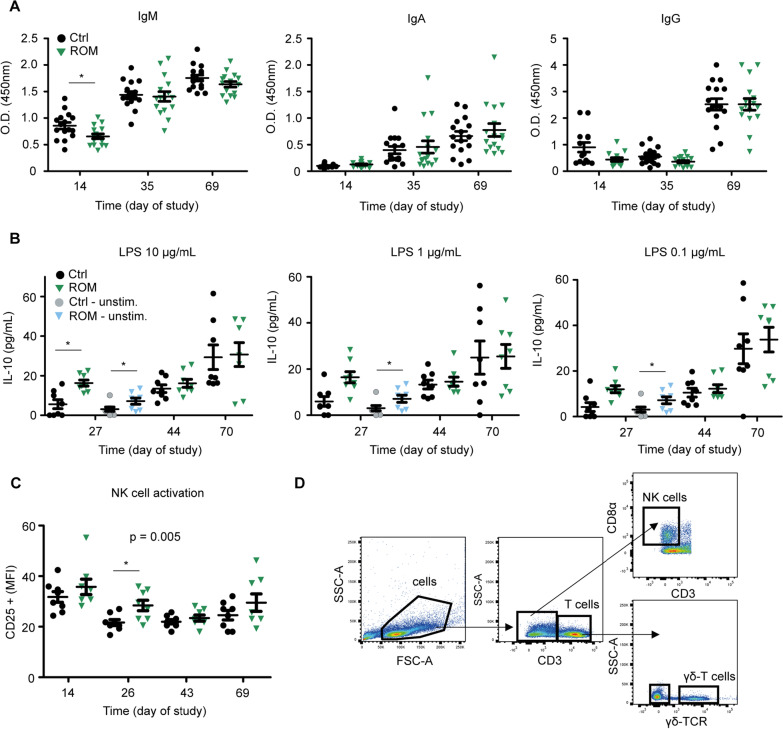
Results: The results showed ROM piglets had a lower inter-individual variation of faecal microbiota composition before weaning and a lower relative abundance of proteobacterial genera in jejunum (Undibacterium and Solobacterium) and caecum (Intestinibacter and Succinivibrionaceae_UCG_001) on day 70, as compared to Ctrl piglets. ROM supplementation also influenced gut mucosal gene expression in both ileum and caecum on day 44. In ileum, ROM pigs showed increased expression of TJP1/ZO1 but decreased expression of CLDN3, CLDN5 and MUC2 than Ctrl pigs. Genes involved in TLR signalling (e.g., TICAM2, IRAK4 and LY96) were more expressed but MYD88 and TOLLIP were less expressed in ROM pigs than Ctrl animals. NOS2 and HIF1A involved in redox signalling were either decreased or increased in ROM pigs, respectively. In caecum, differentially expressed genes between two groups were mainly shown as increased expression (e.g., MUC2, PDGFRB, TOLLIP, TNFAIP3 and MYD88) in ROM pigs. Moreover, ROM animals showed higher NK cell activation in blood and enhanced IL-10 production in ex vivo stimulated MLN cells before weaning.
Conclusions: Collectively, these results suggest that ROM supplementation in early life modulates gut microbiota and (local) immune system development. Consequently, ROM supplementation may contribute to improving health of pigs during the weaning transition period and reducing antibiotics use.
Keywords: Agaricus subrufescens; Early life; Fermentation; Gut microbiota; Immunity; Pigs.
© 2023. The Author(s).
Conflict of interest statement
We declare that we have no financial and personal relationships with other people or organizations that can inappropriately influence our work, and there is no professional or other personal interest of any nature or kind in any product, service and/or company that could be construed as influencing the content of this paper.
Figures
Similar articles
-
Fermented rye with Agaricus subrufescens and mannan-rich hydrolysate based feed additive to modulate post-weaning piglet immune response.Porcine Health Manag. 2021 Dec 9;7(1):60. doi: 10.1186/s40813-021-00241-y. Porcine Health Manag. 2021. PMID: 34886904 Free PMC article.
-
Bifidobacterium animalis Promotes the Growth of Weaning Piglets by Improving Intestinal Development, Enhancing Antioxidant Capacity, and Modulating Gut Microbiota.Appl Environ Microbiol. 2022 Nov 22;88(22):e0129622. doi: 10.1128/aem.01296-22. Epub 2022 Oct 27. Appl Environ Microbiol. 2022. PMID: 36300953 Free PMC article.
-
Weaning diet supplemented with health-promoting feed additives influences microbiota and immune response in piglets challenged with Salmonella.Vet Immunol Immunopathol. 2023 Jan;255:110533. doi: 10.1016/j.vetimm.2022.110533. Epub 2022 Dec 7. Vet Immunol Immunopathol. 2023. PMID: 36563567
-
The role of lactose in weanling pig nutrition: a literature and meta-analysis review.J Anim Sci Biotechnol. 2021 Jan 11;12(1):10. doi: 10.1186/s40104-020-00522-6. J Anim Sci Biotechnol. 2021. PMID: 33431022 Free PMC article. Review.
-
Using Nutritional Strategies to Shape the Gastro-Intestinal Tracts of Suckling and Weaned Piglets.Animals (Basel). 2021 Feb 5;11(2):402. doi: 10.3390/ani11020402. Animals (Basel). 2021. PMID: 33562533 Free PMC article. Review.
Cited by
-
Fermented Purslane (Portulaca oleracea L.) Supplementation Enhances Growth and Immune Function Parallel to the Regulation of Gut Microbial Butyrate Production in Weaned Piglets.Microorganisms. 2024 Jul 11;12(7):1403. doi: 10.3390/microorganisms12071403. Microorganisms. 2024. PMID: 39065171 Free PMC article.
References
-
- Xu B, Li Z, Wang C, Fu J, Zhang Y, Wang Y, et al. Effects of fermented feed supplementation on pig growth performance: a meta-analysis. Anim Feed Sci Technol. 2020;259:114315. doi: 10.1016/j.anifeedsci.2019.114315. - DOI
-
- Kabel MA, Frommhagen M, Sun P, Schols HA. Modification of plant carbohydrates using fungal enzymes. In: Zaragoza Ó, Casadevall A, editors. Encyclopedia of mycology. Amsterdam: Elsevier; 2021. pp. 370–384.
LinkOut - more resources
Full Text Sources
Miscellaneous