. 2021:2021:9823268.
doi: 10.34133/2021/9823268. Epub 2021 May 28.

Recent advances in photoacoustic tomography

Affiliations

Recent advances in photoacoustic tomography

Lei Li et al. BME Front. 2021.

Abstract

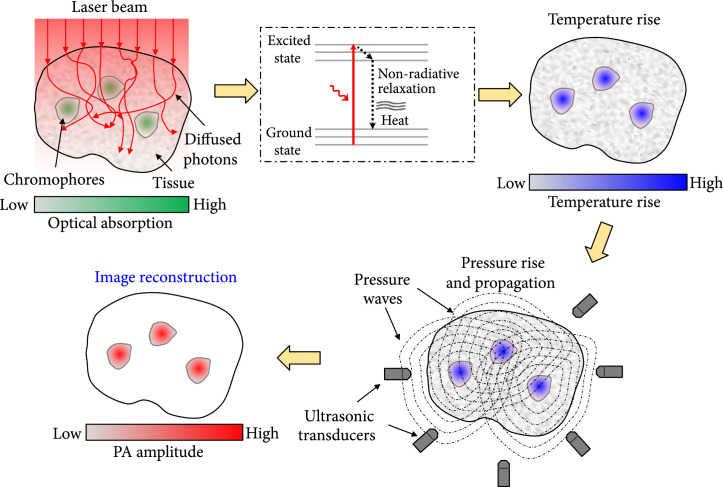
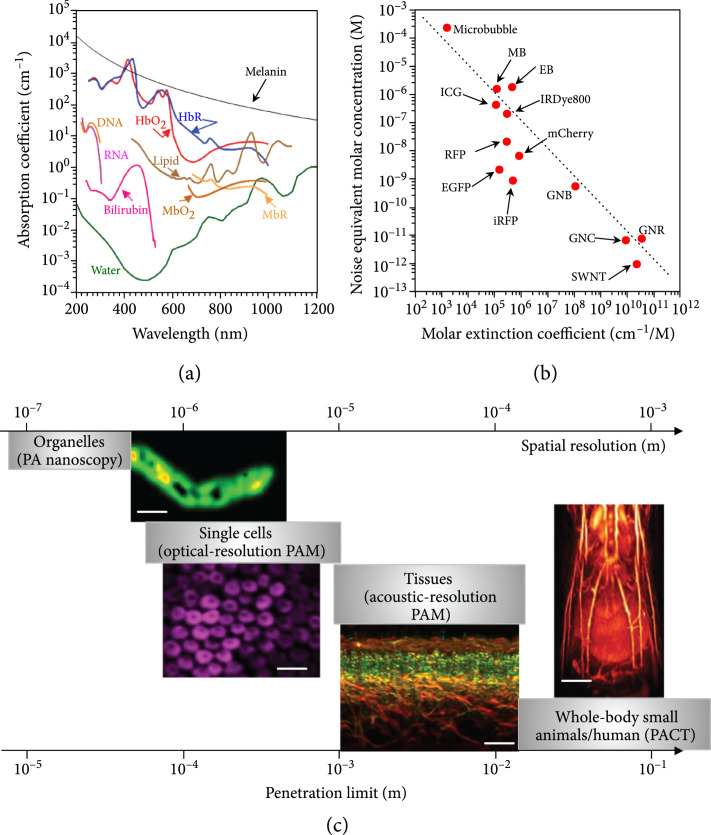
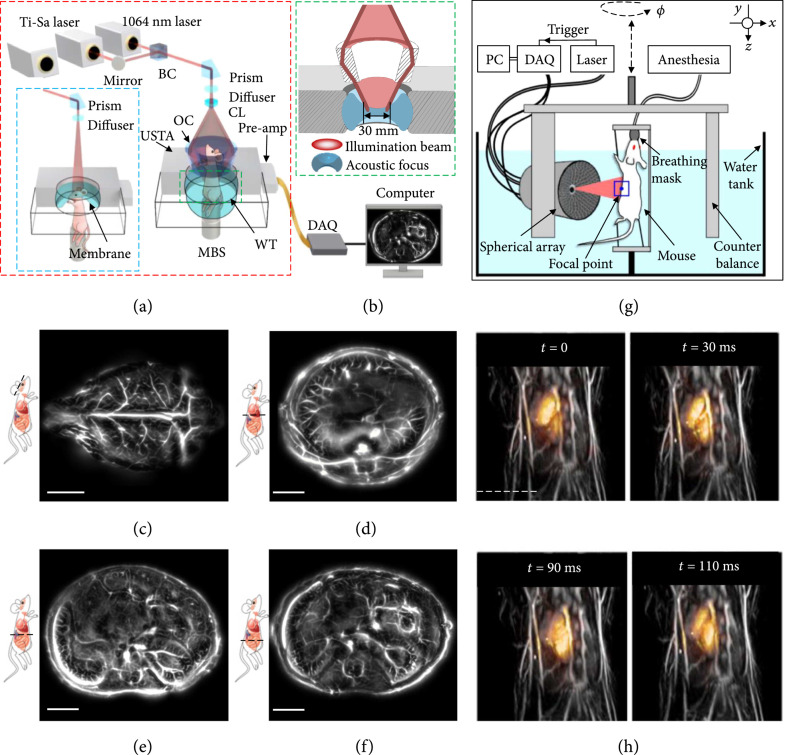
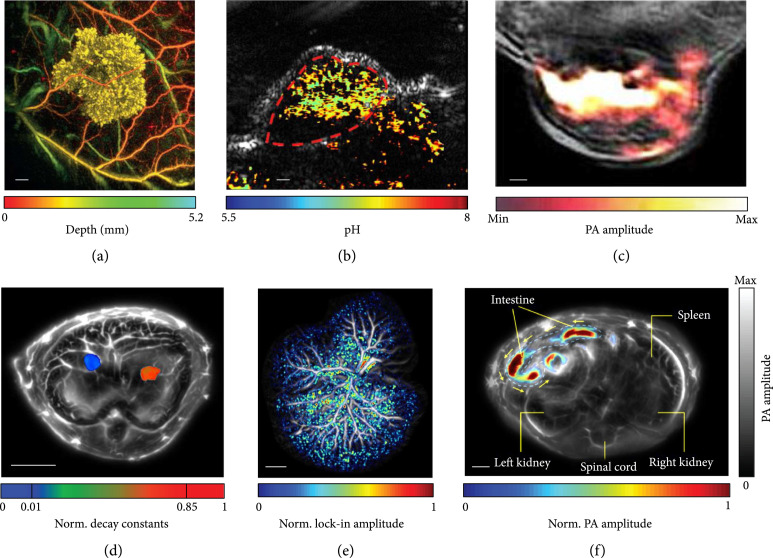
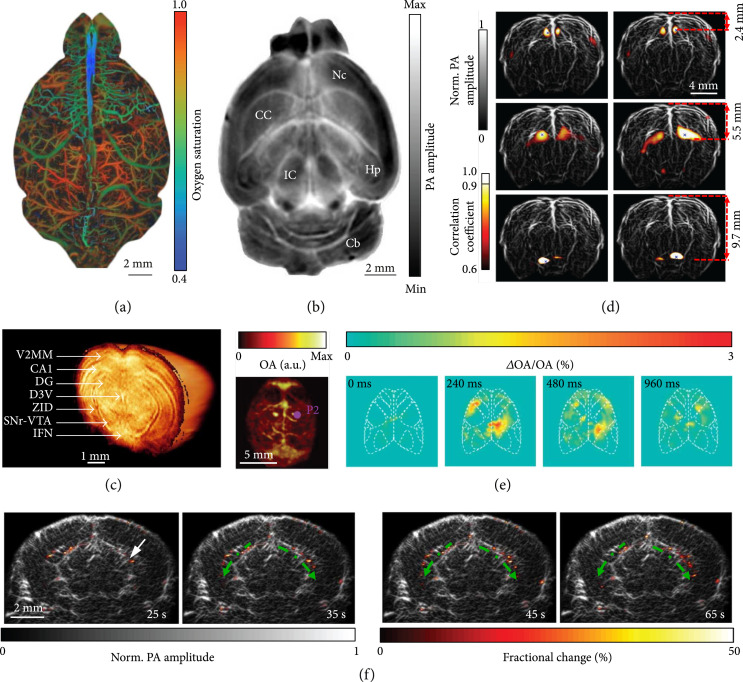
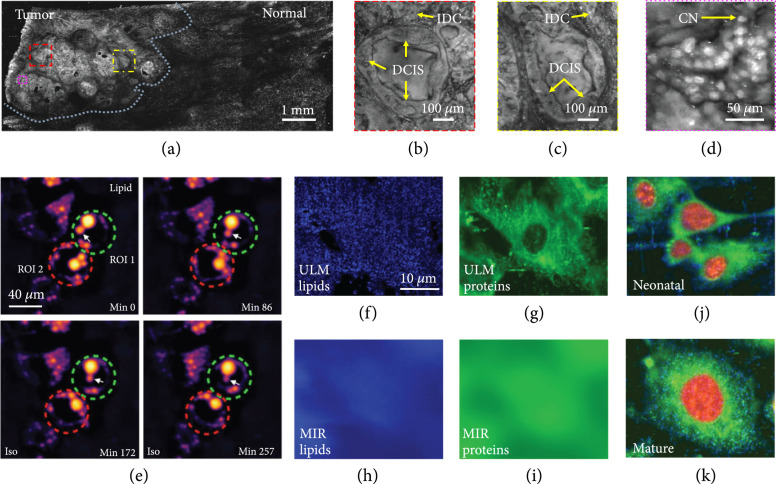
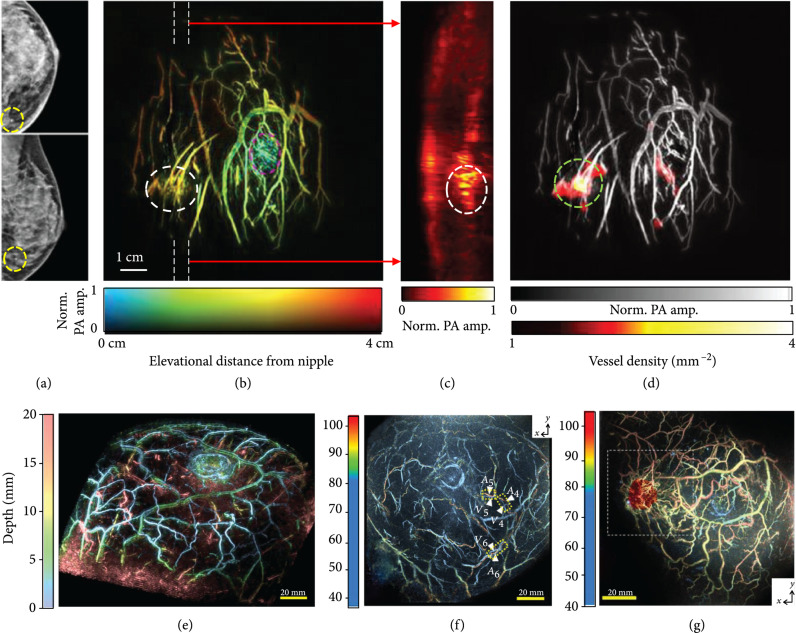
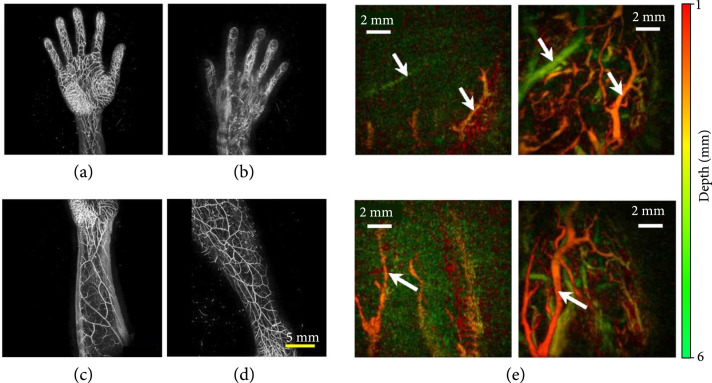
Photoacoustic tomography (PAT) that integrates the molecular contrast of optical imaging with the high spatial resolution of ultrasound imaging in deep tissue has widespread applications in basic biological science, preclinical research and clinical trials. Recently, tremendous progress has been made in PAT regarding technical innovations, preclinical applications, and clinical translations. Here, we selectively review the recent progresses and advances in PAT, including the development of advanced PAT systems for small-animal and human imaging, newly engineered optical probes for molecular imaging, broad-spectrum PAT for label-free imaging of biological tissues, high-throughput snapshot photoacoustic topography, and integration of machine learning for image reconstruction and processing. We envision that PAT will have further technical developments and more impactful applications in biomedicine.


Conflict of interest statement

L.V.W. has financial interests in Microphotoacoustics, Inc., CalPACT, LLC, and Union Photoacoustic Technologies, Ltd., which did not support this work.

Figures

Figure 1
Figure 1
The principle of PAT.
Figure 2
Figure 2
Multicontrast and multiscale PAT. (a) Absorption spectra of endogenous molecules at normal concentrations in vivo [27]. Bilirubin: 12 mg L-1 in blood; DNA/RNA: 1 g L-1 in cell nuclei; HbO2: oxyhemoglobin; HbR: deoxyhemoglobin, 2.3 mM in blood; MbO2: oxymyoglobin; MbR: reduced myoglobin, 0.5% mass concentration in skeletal muscle; melanin: 14.3 g L-1 in the skin; lipid: 20% volume concentration in tissue; water: 80% volume concentration in tissue. (b) Noise equivalent molar concentrations of some widely used exogenous contrast agents, based on reported values from the literature [27]. Illumination fluence is not compensated. EB: evens blue [45]; EGFP: enhanced green fluorescent protein [46]; GNB: gold nanobeacon [47]; GNC: gold nanocage [48]; GNR: gold nanorod [49]; ICG: indocyanine green [50]; IRDye800: near-infrared Dye800 [51]; iRFP: near-infrared red fluorescent protein [52]; MB: methylene blue [53]; mCherry: monomeric cherry protein [46]; microbubble [54]; RFP: red fluorescent protein [52]; SWNT: single-walled nanotube [55]. The dashed curve is power function fitting y=0.1x1, where y is the noise equivalent concentration in molars and x the molar extinction coefficient in cm-1 M-1. (c) Multiscale PAT and representative images. Organelles and PA nanoscopy of a single mitochondrion (scale bar, 500 nm) [37]. Single cells, optical-resolution PAM of red blood cells (scale bar, 20 μm) [38]. Tissues, acoustic-resolution PAM of human skin (scale bar, 500 μm) [25]. Whole-body small animals and whole-body PACT of a nude mouse in vivo (scale bar, 4 mm) [39].
Figure 3
Figure 3
Whole-body PACT of small animals [58, 59]. (a) Schematic of the SIP-PACT system for trunk and brain (blue dashed boxed inset) imaging [58]. Dual-wavelength illumination is used. BC: beam combiner; CL: conical lens; DAQ: data acquisition system; MBS: magnetic base scanner; OC: optical condenser; USTA: (full-ring) ultrasonic transducer array; WT: water tank. (b) Close-up of the green dashed line in (a), showing the confocal design of light illumination and acoustic detection. (c-f) Representative cross-sectional images of the brain (c), the liver (d), the upper abdominal cavity (e), and the lower abdominal cavity (f) in a live mouse, acquired by SIP-PACT [58]. Scale bar: 5 mm. (g) Layout of the spiral scanning PACT system for small-animal whole-body imaging [59]. DAQ: data acquisition unit. (h) Representative 3D whole-body images of a live mouse. Each image overlays the beating mouse heart (color) onto a whole-body anatomical image (gray) of the same mouse [59]. Scale bar: 5 mm.
Figure 4
Figure 4
Representative images of molecular PACT. (a) In vivo PA images of Tyr-expressing K562 cells after subcutaneous injection into the flank of a nude mouse (vasculature is color-coded for depth; K562 cells are false-colored yellow). Scale bar, 1 mm [64]. (b) Quantitative PACT of pH in vivo. Functional PA image in pseudo-color is superimposed on the gray-scale ultrasound image. Scale bar, 2 mm [72]. (c) In vivo PA image of a 4T1 tumor-bearing mouse, given a single injection of 150 μg of OMVMel via the tail vein. The image was acquired at 3 h postinjection, showing the accumulation of OMVMel in tumor tissue, where the OMVMel is in color and the background tissue is in gray [73]. (d) In vivo multicontrast PACT of two types of tumor cells in the liver. Two types of tumors expressing different photoswitchable proteins are separated by their decay characteristics. The tumors are shown in color, and the background tissues are shown in gray. Norm.: normalized [74]. (e) PA image of a hydrodynamic-transfected liver. The photoswitching signals are shown in color, confirming the existence of reconstituted DrSplit induced by protein-protein interactions. The background tissues are shown in gray [74]. (f) PA image of the microrobots in the intestines in vivo. The migrating microrobots are shown in color, and the mouse tissues are shown in gray. The yellow arrows indicate the direction of migration [76].
Figure 5
Figure 5
Multiscale PAT of the brain. (a) PAM of oxygen saturation of hemoglobin in a mouse brain [79]. (b) A cross-sectional PACT image of a saline-perfused mouse brain (horizontal plane) at 2.8 mm depth, showing internal structures of the brain clearly. Nc: neocortex; CC: corpus callosum; Hp: hippocampus; Cb: cerebellum; IC: inferior colliculus [80]. (c) 3D PACT image of a mouse brain ex vivo. Illumination wavelength: 740 nm; V2MM: secondary visual cortex, medio-medial; CA1: hippocampal CA1 area; DG: dentate gyrus; D3V: dorsal third ventricle; ZID: zona incerta dorsal; SNr: substantia nigra reticulate; VTA: ventral tegmental area; IFN: interfascicular nucleus [81]. (d) Functional mapping of the resting-state connectivity in a rat whole brain (coronal plane), showing a clear correlation between corresponding regions across the left and right hemispheres [58]. (e) PACT of GCaMP6s responses to electrical stimulation of the right or left hind paw. First from the left, maximum amplitude projection along the depth direction of the 3D images of a GCaMP6-expressing mouse; second to last, relative increases in PA signal with respect to the baseline for a slice at ~1 mm depth at different time points following the stimulation pulse for the GCaMP6s-expressing mouse [82]. (f) PACT images of epileptic activities during a seizure at different times. The fractional changes (color) in the PA amplitude are overlaid on the anatomical image (gray, Bregma: −1.0 mm). The arrow indicates the injection site, and the dashed green arrows indicate the epileptic wave propagation direction [83].
Figure 6
Figure 6
Broad-spectrum PAM of tissues and cells. (a) PAM image of a fixed, unprocessed breast tumor. Illumination wavelength, 266 nm [88]. (b-d) Zoomed-in PAM images of the red, yellow, and magenta dashed regions in (a), respectively. IDC: invasive ductal carcinoma; DCIS: ductal carcinoma in situ; CN: cell nuclei [88]. (e) Monitoring intrinsic lipid contrast during lipolysis in differentiated 3T3-L1 adipocytes at 2,857 cm−1. Two regions of interest (ROIs) enclosing individual adipocytes are marked: green dashed circle for ROI 1 and red dashed circle for ROI 2. The white arrow follows the process of lipid droplet remodeling in a single adipocyte enclosed in ROI 1 [91]. (f, g) ULM-PAM images of lipids (f) and proteins (g) [85]. MIR-PAM images of lipids (h) and proteins (i), imaged at 3,420 nm and 6,050 nm, respectively [85]. Composite images of cells formed by overlaying the images of lipids (blue), proteins (green), and nucleic acids (red) in different color channels at neonatal (j) and mature (k) stages [85].
Figure 7
Figure 7
PACT of human breasts. (a) X-ray mammograms of an affected breast [94]. (b) Depth-encoded angiogram of the affected breast acquired by SBH-PACT. The breast tumor is identified by a white circle; the nipple is marked by a magenta circle [94]. (c) Maximum amplitude projection (MAP) images of the thick slice in sagittal planes marked by white dashed lines in (b) [94]. (d) Automatic tumor detection on vessel density maps. Tumors are identified by green circles. Background images in gray scale are the MAP of vessels deeper than the nipple [94]. (e) Depth-encoded 3D PACT image of a healthy breast [95]. (f) Evaluation of the S-factor in a healthy breast, where the color represents the measured S-factor [96]. (g) A fusion image of the S-factor and 3D-US images (red color) [96].
Figure 8
Figure 8
PACT images of human extremities. (a-d) PACT images of various extremities, including palm (a), back of the hand (b), forearm (c), and lower thigh [98]. (e) MAP images of human fingertips after cold (left-hand panels) and warm (right-hand panels) water immersion, color-coded for depth, while arrows show the same vessels in each imaging condition [99].
Figure 9
Figure 9
Principles of PATER and representative images [100]. (a-f) Principles of PATER. (a) Simulation of acoustic propagation in the ER in calibration mode. Norm.: normalized. (b) Simulation of acoustic propagation in the ER in wide-field mode. (c) In the calibration mode, light is focused on each pixel to acquire the impulse response encoded by the ER, ki, and then raster scanned over the FOV. (d) Calibration image formed by computing the root-mean-squared amplitude of each received PA signal at every calibration position. (e) Snapshot wide-field imaging. A broad laser beam illuminates the entire FOV to acquire encoded signals, si, which can be repeated for high-speed imaging. (f) Reconstructed wide-field images. The reconstruction algorithm uses calibrated impulse responses to decode the wide-field signals and then display wide-field images. (g) Monitoring of blood pulse wave propagation. Wide-field images at different time points illustrate the thermal wave propagation in the middle cerebral arteries. The yellow circles, labeled L1 and L2, indicate the locations of the laser heating spots during wide-field measurement. The thermal wave signals are shown in color, and the background vessels are shown in gray.
Figure 10
Figure 10
Image reconstructions assisted by machine learning. (a-e) Deep learning PAT with sparse data [114]. (a) The U-Net network architecture, consisting of contracting (downsampling) and expansive (upsampling) paths, which is used for the image reconstruction with sparse data. (b) Artifactual reconstructed image with undersampled (128 projections) data, showing the reconstruction artifacts due to the sparse data. (c) Zoom-in images of the yellow and green boxed regions in (b). (d) Artifact-free counterpart of (b), obtained with the trained network. (e) Zoom-in images of the yellow and green boxed regions in (d). (f, g) Hybrid neural network for limited-view PACT. [117] (f) The global architecture of Y-Net. Two encoders extract different input features, which concatenate into the decoder. Both encoders have skip connections with the decoder. (g) Comparison of reconstructed images. Top left, ground truth; top right, image reconstructed using the universal back-projection method; bottom left, image reconstructed using the time-reversal method; bottom right, image reconstructed using the trained Y-net.

Similar articles

Cited by

References

    1. Ntziachristos V., “Going deeper than microscopy: the optical imaging frontier in biology,” Nature Methods, vol. 7, no. 8, pp. 603-614, 2010 - PubMed
    1. Ntziachristos V., Ripoll J., Wang L. V., and Weissleder R., “Looking and listening to light: the evolution of whole-body photonic imaging,” Nature Biotechnology, vol. 23, no. 3, pp. 313-320, 2005 - PubMed
    1. Beard P., “Biomedical photoacoustic imaging,” Interface Focus, vol. 1, no. 4, pp. 602-631, 2011 - PMC - PubMed
    1. Bell A. G., “ART. XXXIV.--On the Production and Reproduction of Sound by Light,” American Journal of Science (1880-1910), vol. 20, no. 118, p. 305, 1880
    1. Li L., Lin L., and Wang L. V., “Multiscale photoacoustic tomography,” Optics and Photonics News, vol. 29, no. 4, pp. 32-39, 2018

LinkOut - more resources