. 2023 Jul;102(7):759-766.
doi: 10.1177/00220345231160756. Epub 2023 Apr 11.

Microbial Indicators of Dental Health, Dysbiosis, and Early Childhood Caries

Affiliations

Microbial Indicators of Dental Health, Dysbiosis, and Early Childhood Caries

D Kahharova et al. J Dent Res. 2023 Jul.

Abstract

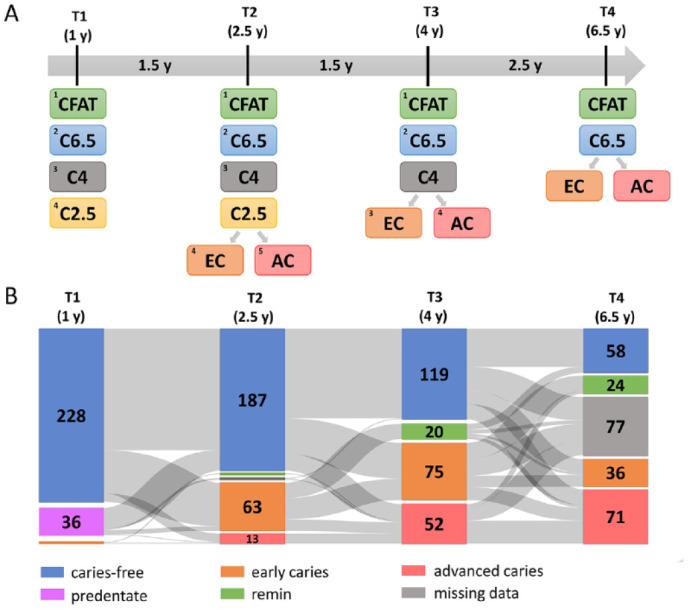
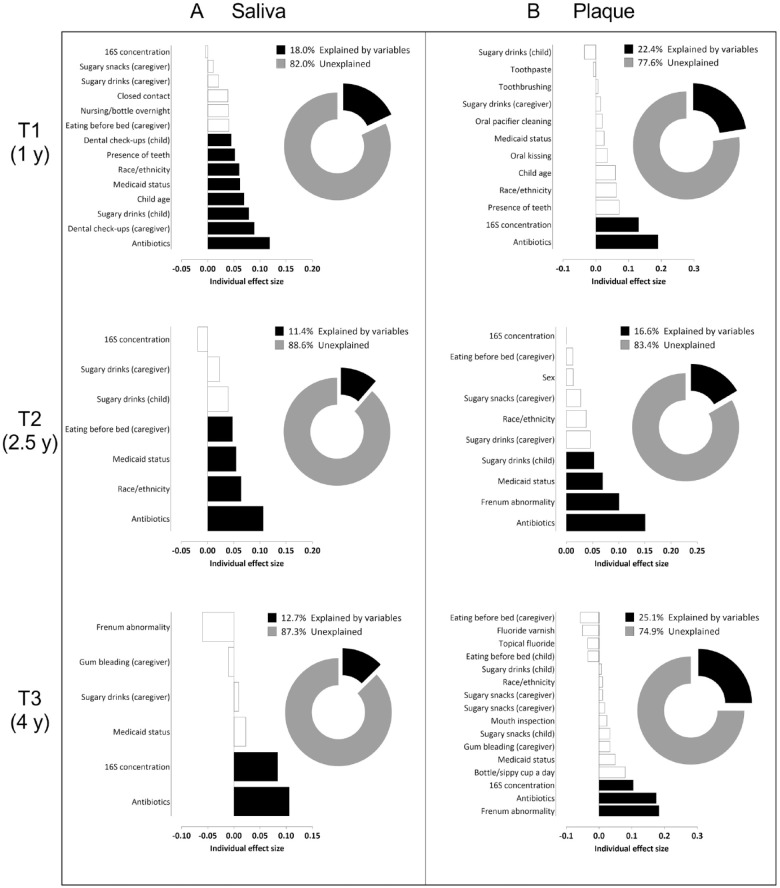
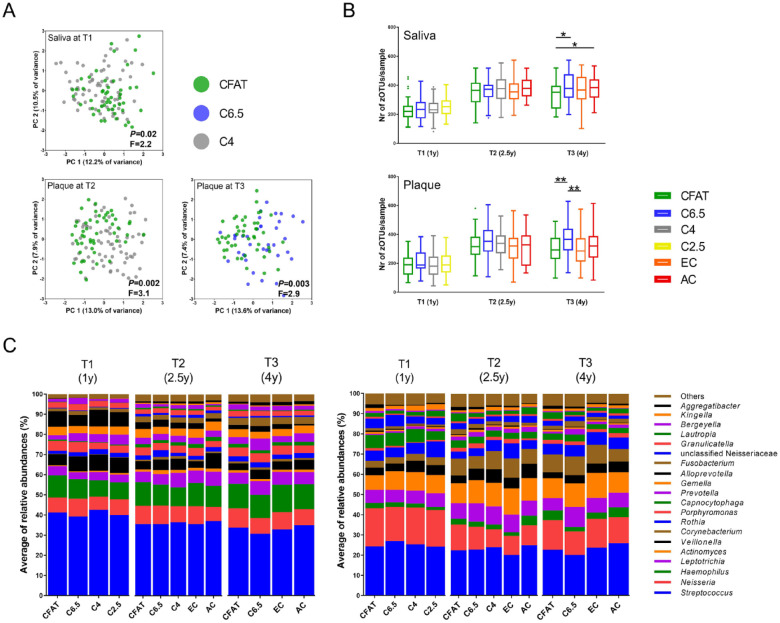
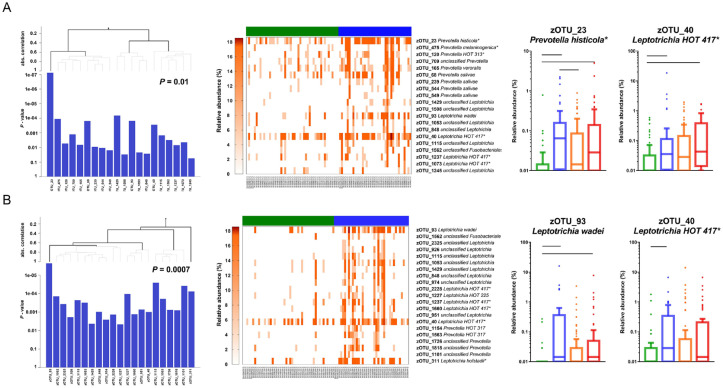
Dental caries lesions are a clinical manifestation of disease, preceded by microbial dysbiosis, which is poorly characterized and thought to be associated with saccharolytic taxa. Here, we assessed the associations between the oral microbiome of children and various caries risk factors such as demographics and behavioral and clinical data across early childhood and characterized over time the salivary and dental plaque microbiome of children before clinical diagnosis of caries lesions. Children (N = 266) were examined clinically at ~1, 2.5, 4, and 6.5 y of age. The microbiome samples were collected at 1, 2.5, and 4 y. Caries groups consisted of children who remained caries free (International Caries Detection and Assessment System [ICDAS] = 0) at all time points (CFAT) (n = 50); children diagnosed with caries (ICDAS ≥ 1) at 6.5 y (C6.5), 4 y (C4), or 2.5 y of age (C2.5); and children with early caries or advanced caries lesions at specific time points. Microbial community analyses were performed on zero-radius operational taxonomic units (zOTUs) obtained from V4 of 16S ribosomal RNA gene amplicon sequences. The oral microbiome of the children was affected by various factors, including antibiotic use, demographics, and dietary habits of the children and their caregivers. At all time points, various risk factors explained more of the variation in the dental plaque microbiome than in saliva. At 1 y, composition of saliva of the C4 group differed from that of the CFAT group, while at 2.5 y, this difference was observed only in plaque. At 4 y, multiple salivary and plaque zOTUs of genera Prevotella and Leptotrichia were significantly higher in samples of the C6.5 group than those of the CFAT group. In conclusion, up to 3 y prior to clinical caries detection, the oral microbial communities were already in a state of dysbiosis that was dominated by proteolytic taxa. Plaque discriminated dysbiotic oral ecosystems from healthy ones better than saliva.

Keywords: 16S rRNA; antibiotics; child; dental caries; dental plaque; saliva.


Conflict of interest statement

The authors declared the following potential conflicts of interest with respect to the research, authorship, and/or publication of this article: M. Fontana was a member of the National Scientific Advisory Committee of the Delta Dental Plans Association.

Figures

Figure 1.
Figure 1.
The flow diagram with the type of data set normalization per analysis type. Community-level analyses (yellow rectangles) were performed in both subsampled and trimmed mean of M-value (TMM) normalized data sets. Contribution of the various caries risk factors to the oral microbiome (blue rectangles) and individual zero-radius operational taxonomic unit–level analyses (green rectangles) were done on TMM normalized data sets.
Figure 2.
Figure 2.
Distribution of the children based on the time of caries diagnosis and caries severity between 1 and 6.5 y of age. (A) The study groups according to the caries status per time point. The gray horizontal arrow shows the time interval in years between each time point. At T1 (age 1 y), children were divided into 4 groups by their caries status: 1) CFAT group (n = 50, green rectangle), children who remained caries free (International Caries Detection and Assessment System [ICDAS] = 0) at all time points (T1–T4, thus between age 1 and 6.5 y); 2) C6.5 group (n= 38, blue rectangle), children first time diagnosed with caries (ICDAS ≥ 1) at T4 (thus at 6.5 y) but caries free at T1, T2, and T3 (age 1, 2.5, and 4 y); 3) C4 group (n= 70, gray rectangle), children first time diagnosed with caries at T3 (4 y) but caries free at T1 and T2; and 4) C2.5 group (n= 75, yellow rectangle), children first time diagnosed with caries at T2 (2.5 y) but caries free at T1. At T2 (age 2.5 y), the children were divided into 5 caries groups: 1) CFAT (n = 50); 2) C6.5 (n= 38); 3) C4 (n= 70); 4) EC (n = 63, orange rectangle), children with early (thus presented with ICDAS = 1 or ICDAS = 2) caries lesions at T2 (2.5 y); and 5) AC group (n = 13, red rectangle), children with advanced (ICDAS ≥ 3) caries lesions at T2. At T3 (age 4 y), the children were divided into 4 caries groups: 1) CFAT (n = 50); 2) C6.5 (n = 38); 3) EC (n = 75), children with early caries lesions at T3 (4 y); and 4) AC (n = 52), children with advanced caries lesions at T3. (B) The Sankey graph of the entire study population. Among the 266 participants at the first visit (T1), 228 (85.7%) children were clinically caries free (blue columns), 2 children (0.9%) had early dental caries lesions (orange column), and 36 (13.5%) children were predentate (purple column). Only 50 (26.4%) children remained caries free during all 4 visits (T1–T4), while at T4, data were not available (missing data, gray column) for 77 (28.9%) children. Remin (green column)—children previously diagnosed with caries at the specific visit but caries free at the next time point, suggesting remineralization of lesions.
Figure 3.
Figure 3.
Variables associated with the salivary (A) and dental plaque (B) microbiome variation at T1, T2, and T3. Bar graphs depict the individual effect sizes of the variables selected as significantly influencing the microbiome composition. The black bars indicate the variables contributing to the best model based on the bioenv function. Bars with negative values mean that, even if the variable had a significant effect on the microbiome, it did not explain variation between samples. A variable can have a negative effect size if it is taken alone but contributes positively to the variation in combination with other variables. Pie charts show the percentage (%) of the explained variation of the microbiome composition with a combined effect size coming from the best combination of the selected variables (best model) (black part) and unexplained part of the microbiome (gray part).
Figure 4.
Figure 4.
Microbial profile analyses of the salivary and dental plaque microbiome of the children over time (T1, T2, T3). (A) Principal component analysis (PCA) plots displaying the microbial profiles of the samples in the caries free at all time points (CFAT), C6.5, and C4 groups. Axes show the first 2 principal components (PCs) explaining the largest intersample variation (percentage of variance). The P and F values indicate the output of PERMANOVA analyses, using Bray–Curtis similarity. The P values were corrected for multiple testing using Bonferroni correction. (B) The α-diversity presented as species richness of the microbial composition in both salivary and dental plaque samples of the children according to their caries statuses over time. The boxplots are plotted using Tukey’s method. Statistically significant differences within the respective caries group are indicated by asterisks: *P < 0.05 and **P < 0.01 (Kruskal–Wallis test and Mann–Whitney test with Bonferroni correction). Different colors of the boxes indicate caries groups. Green boxes, CFAT (n = 50); blue, caries at 6.5 y (C6.5) (n = 38); gray, caries at 4 y (C4) (n = 70); yellow, caries at 2.5 y (C2.5) (n = 75); orange, early caries (EC) (International Caries Detection and Assessment System [ICDAS] score 1 and 2) (T2: n = 63; T3: n = 75); and red, advanced caries (AC) (ICDAS ≥ 3) (T2: n = 13; T3: n = 52) at the respective clinical examination. Lines connect the caries groups that differed within a time point. (C) Taxonomic distribution of the mean relative abundance of reads of the top 20 most abundant bacterial genera in salivary (left plot) and dental plaque (right plot) samples of the children according to their caries groups over time.
Figure 5.
Figure 5.
Differences in microbial composition between children with different caries status. The output of the global test comparing the composition of (A) salivary and (B) dental plaque samples collected at 4 y of age (T3) in children who remained caries free at all time points (CFAT) (n = 50) with those who were diagnosed with caries at 6.5 y (C6.5) (n = 38) but were caries free at the time of the sample collection (4 y). The bar graphs with dendrograms show the zero-radius operational taxonomic units (zOTUs) selected with the global test (P is the overall P value) and contributing to the significant differences in (A) salivary and (B) dental plaque samples. The dendrogram at the top shows single zOTUs and zOTU groups associated with the caries groups (in this case, all associated with C6.5, blue), with the absolute correlation from the global test at the upper y-axis. The lower y-axis shows the logarithmic P values corresponding to the tests for the associations of each individual zOTU with the caries group, plotted such that the longest bar has the lowest P value. The heatmaps show the relative abundance of the same zOTUs and zOTU groups in the same order as in the bar graphs in (A) salivary and (B) dental plaque samples in the CFAT (green) and C6.5 (blue) groups. The boxplots show examples of zOTUs selected with the global test in (A) salivary and dental (B) plaque samples by caries group: the CFAT, green; C6.5, blue; early caries (EC), orange; and advanced caries (AC), red. Lines connect the statistically significantly different groups. *Indicates zOTUs additionally blasted on the HOMD website with similarity ≥98.5%. The number of zOTUs per group, taxonomic names, and individual P values of all selected zOTUs are listed in Appendix Table 3A.

Similar articles

Cited by

References

    1. Banting DW, Eggertsson H, Zandoná AGF, Ismail AI, Longbottom C, Pitts NB, Reich E, Ricketts D, Selwitz RH, Sohn W. 2012. Rationale and evidence for the International Caries Detection and Assessment System (ICDAS II) author: International Caries Detection and Assessment System Coordinating Committee [accessed 2023 Feb 14]. https://www.semanticscholar.org/paper/Rationale-and-Evidence-for-the-Int....
    1. Campbell SB, Shaw DS, Gilliom M. 2000. Early externalizing behavior problems: toddlers and preschoolers at risk for later maladjustment. Dev Psychopathol. 12(3):467–488. - PubMed
    1. Chen T, Yu WH, Izard J, Baranova OV, Lakshmanan A, Dewhirst FE. 2010. The human oral microbiome database: a web accessible resource for investigating oral microbe taxonomic and genomic information. Database. 2010:baq013. - PMC - PubMed
    1. Fontana M, Eckert GJ, Keels MA, Jackson R, Katz BP, Kemper AR, Levy BT, Levy SM, Yanca E, Kelly S, et al.. 2019. Predicting caries in medical settings: risk factors in diverse infant groups. J Dent Res. 98(1):68–76. - PMC - PubMed
    1. Goeman JJ, van de Geer SA, de Kort F, van Houwelingen HC. 2004. A global test for groups of genes: testing association with a clinical outcome. Bioinformatics. 20(1):93–99. - PubMed

Publication types

Substances