. 2023 Jun;238(6):1354-1367.
doi: 10.1002/jcp.31018. Epub 2023 Apr 12.

The β3-subunit modulates the effect of venom peptides ProTx-II and OD1 on NaV 1.7 gating

Affiliations

The β3-subunit modulates the effect of venom peptides ProTx-II and OD1 on NaV 1.7 gating

Samantha C Salvage et al. J Cell Physiol. 2023 Jun.

Abstract

The voltage-gated sodium channel NaV 1.7 is involved in various pain phenotypes and is physiologically regulated by the NaV -β3-subunit. Venom toxins ProTx-II and OD1 modulate NaV 1.7 channel function and may be useful as therapeutic agents and/or research tools. Here, we use patch-clamp recordings to investigate how the β3-subunit can influence and modulate the toxin-mediated effects on NaV 1.7 function, and we propose a putative binding mode of OD1 on NaV 1.7 to rationalise its activating effects. The inhibitor ProTx-II slowed the rate of NaV 1.7 activation, whilst the activator OD1 reduced the rate of fast inactivation and accelerated recovery from inactivation. The β3-subunit partially abrogated these effects. OD1 induced a hyperpolarising shift in the V1/2 of steady-state activation, which was not observed in the presence of β3. Consequently, OD1-treated NaV 1.7 exhibited an enhanced window current compared with OD1-treated NaV 1.7-β3 complex. We identify candidate OD1 residues that are likely to prevent the upward movement of the DIV S4 helix and thus impede fast inactivation. The binding sites for each of the toxins and the predicted location of the β3-subunit on the NaV 1.7 channel are distinct. Therefore, we infer that the β3-subunit influences the interaction of toxins with NaV 1.7 via indirect allosteric mechanisms. The enhanced window current shown by OD1-treated NaV 1.7 compared with OD1-treated NaV 1.7-β3 is discussed in the context of differing cellular expressions of NaV 1.7 and the β3-subunit in dorsal root ganglion (DRG) neurons. We propose that β3, as the native binding partner for NaV 1.7 in DRG neurons, should be included during screening of molecules against NaV 1.7 in relevant analgesic discovery campaigns.

Keywords: NaV1.7; OD1; ProTx-II; pain; voltage-gated sodium channel; β3-subunit.


Conflict of interest statement

The authors declare no conflict of interest.

Figures

Figure 1
Figure 1
The NaV1.7 α‐subunit and its binding to the β3‐subunit. (a) Domain organisation of the human NaV1.7 α‐subunit in cartoon form and from the cryo‐EM structure (PDB: 6j8g). The locations of the DI–DIV domains, voltage‐sensor module, pore module, loop regions and transmembrane α‐helices S1–6 are indicated. (b) Stable interaction between FLAG‐tagged NaV1.7 α‐subunit and EGFP‐tagged β3‐subunit in HEK293 cells. Cell lysates from NaV1.7 or NaV1.7‐β3‐subunit cell lines were separately immunoprecipitated with anti‐Flag to pull down NaV1.7. Samples were run on SDS‐PAGE gels and blotted for either FLAG (NaV1.7) or EGFP (β3‐subunit).
Figure 2
Figure 2
Functional consequences of ProTx‐II and OD1 on NaV1.7 steady‐state activation and inactivation with and without the β3‐subunit. (a) Representative whole‐cell NaV1.7 and NaV1.7‐β3 subunit Na+ currents elicited by the activation protocol (inset) in the absence and presence of ProTx‐II or OD1. (b). Histograms of NaV1.7 ± β3‐subunit peak current densities (INa) in untreated, ProTx‐II‐treated and OD1‐treated HEK293 cells (compared by two‐way analysis of variance and Sidak post hoc tests). (c) Current‐voltage relationships (left hand panels) and conductance voltage plots (right hand panels) for NaV1.7 (top) and NaV1.7‐β3‐subunit (bottom), both in the presence and absence of 5 nM ProTx‐II or 45 nM OD1. (d). Channel availability (INa/INa.max) for NaV1.7 (top) and NaV1.7‐β3‐subunit (bottom), both in the presence and absence of 5 nM ProTx‐II or 45 nM OD1, recorded from a steady‐state inactivation protocol plotted against the conditioning voltage step. All data are mean ± SEM, n ≥ 6. The curve fits are to Boltzmann functions (see Section 2) providing the half‐maximal voltages, V½ and slope factors, k shown in Table 1. *p < 0.05 and **p < 0.01 comparisons as indicated by the bars.
Figure 3
Figure 3
Channel availability and conductance for (a) NaV1.7 and (b) NaV1.7‐β3‐subunit, with and without OD1. Combined representation of data to demonstrate voltage ranges at which activation and inactivation curves overlap, potentially resulting in window currents. Lower panels show a zoomed in representation of this window, highlighted by a dashed box in the upper panel.
Figure 4
Figure 4
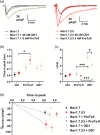
Functional consequences of ProTx‐II and OD1 on NaV1.7 and NaV1.7‐β3 activation and inactivation kinetics. (a) Representative whole‐cell NaV1.7 and NaV1.7‐β3 Na+ currents in response to the fixed −10 mV test pulse from a variable prepulse, where activation and inactivation kinetics were indistinguishable (−140 to −100 mV) in the presence or absence of ProTx‐II or OD1. (b) Mean time to peak (NaV1.7 n = 14, NaV1.7‐β3 n = 11, NaV1.7 + ProTx‐II n = 9, NaV1.7‐β3 + ProTx‐II n = 6, NaV1.7 + OD1 n = 8 and NaV1.7‐β3 + OD1 n = 6). (c) Mean τ values from a single exponential fit to the current decay/inactivation time course (NaV1.7 n = 14, NaV1.7‐β3 n = 11, NaV1.7 + ProTx‐II n = 9, NaV1.7‐β3 + ProTx‐II n = 6, NaV1.7 + OD1 n = 8, NaV1.7‐β3 + OD1 n = 6. (d) Peak currents plotted against time to peak. Data are means ± SEM (b–d) and compared by two‐way ANOVA, followed by Sidak's post hoc test (b and c). *p < 0.05 and ***p < 0.001 comparisons as indicated by the bars.
Figure 5
Figure 5
Recovery from inactivation kinetics for NaV1.7 and NaV1.7‐β3‐subunit, with and without OD1. (a) Typical traces for NaV1.7 and NaV1.7‐β3 channels in response to a double pulse protocol (inset) to assess recovery from inactivation in the presence and absence of OD1 (only the first 60 ms shown for clarity). (b) Plots of fractional recovery (IP2/IP1) as a function of time. Curves are a single exponential fit to the data providing k recov and t½. The inset shows the first 16 ms expanded on a logarithmic scale.
Figure 6
Figure 6
OD1 toxin and its binding site on the NaV1.7 DIV voltage sensor module. (a) Top view of human NaV1.7 (PDB: 6j8g), as in Figure 1a. The box highlights the DIV voltage‐sensor module (VSM). (b) Enlarged top view of the DIV VSM, in its deactivated state (PDB: 6NT4). (c) Enlarged top view of the DIV VSM, in its activated state (PDB: 6NT3). Left box: cartoon rendering, highlighting the positively charged S4 helix residues. Right box: Electrostatic potential distribution of the solvent‐accessible surfaces. (d) Toxin OD1 (PDB: 4HHF). Left: cartoon rendering. Right: Electrostatic potential distribution of the solvent accessible surfaces. In all cases, electrostatic potentials were calculated by Adaptive Poisson‐Boltzmann Solver in PyMol (https://pymol.org) and visualized in red to blue (−2 to +2 kT/e).
Figure 7
Figure 7
Predicted binding mode of OD1 to DIV voltage‐sensor module (VSM). (a) Close structural similarity between OD1 (cyan) and the related toxin AaHII (gold). (b) Proposed mode of binding of OD1 (cyan) to human DIV VSM (PDB: 6NT4) (grey), overlaid on the previously determined structure of bound AaHII‐toxin (gold) (Clairfeuille et al., 2019). The DI pore module is shown in magenta. (c) Enlarged views of the proposed interface between OD1 and the DIV VSM of human NaV1.7 in the deactivated state. Key residues discussed in the text are shown as stick representations and labelled in roman (OD1) or italic (VSM). (d) Enlarged comparison of the DIV, VSMs in the activated state (PDB: 6NT3) and deactivated state (PDB: 6NT4) showing key residues implicated in OD1‐binding (see text for details).

References

    1. Altman, D. G. (1982). Statistics in medical journals. Statistics in Medicine, 1, 59–71. - PubMed
    1. Armstrong, C. M. (2006). Na channel inactivation from open and closed states. Proceedings of the National Academy of Sciences, 103, 17991–17996. - PMC - PubMed
    1. Bosmans, F. , Martin‐Eauclaire, M. F. , & Swartz, K. J. (2008). Deconstructing voltage sensor function and pharmacology in sodium channels. Nature, 456, 202–208. - PMC - PubMed
    1. Catterall, W. A. (2017). Forty years of sodium channels: Structure, function, pharmacology, and epilepsy. Neurochemical Research, 42, 2495–2504. - PMC - PubMed
    1. Catterall, W. A. , Cestèle, S. , Yarov‐Yarovoy, V. , Yu, F. H. , Konoki, K. , & Scheuer, T. (2007). Voltage‐gated ion channels and gating modifier toxins. Toxicon, 49, 124–141. - PubMed

Publication types

LinkOut - more resources