. 2023 Jul 3;220(7):e20221391.
doi: 10.1084/jem.20221391. Epub 2023 Apr 12.

CTLA4 depletes T cell endogenous and trogocytosed B7 ligands via cis-endocytosis

Affiliations

CTLA4 depletes T cell endogenous and trogocytosed B7 ligands via cis-endocytosis

Xiaozheng Xu et al. J Exp Med. .

Abstract

CD28 and CTLA4 are T cell coreceptors that competitively engage B7 ligands CD80 and CD86 to control adaptive immune responses. While the role of CTLA4 in restraining CD28 costimulatory signaling is well-established, the mechanism has remained unclear. Here, we report that human T cells acquire antigen-presenting-cell (APC)-derived B7 ligands and major histocompatibility complex (MHC) via trogocytosis through CD28:B7 binding. Acquired MHC and B7 enabled T cells to autostimulate, and this process was limited cell-intrinsically by CTLA4, which depletes B7 ligands trogocytosed or endogenously expressed by T cells through cis-endocytosis. Extending this model to the previously proposed extrinsic function of CTLA4 in human regulatory T cells (Treg), we show that blockade of either CD28 or CTLA4 attenuates Treg-mediated depletion of APC B7, indicating that trogocytosis and CTLA4-mediated cis-endocytosis work together to deplete B7 from APCs. Our study establishes CTLA4 as a cell-intrinsic molecular sink that limits B7 availability on the surface of T cells, with implications for CTLA4-targeted therapy.


Conflict of interest statement

Disclosures: The authors declare no competing interests exist.

Figures
None
Graphical abstract
Figure 1.
Figure 1.
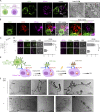
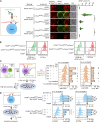
CD28 mediates acquisition of APC-derived membrane fragments upon B7 binding. (A) Left: Confocal microscopy of a conjugate between a CD80-GFP+ Raji B cell and a CD80-GFP+ Jurkat T cell. Image shows CD80-GFP accumulation in CTLA4-associated vesicles and CTLA4-independent acquisition of membrane fragments enriched in CD80-GFP (white arrowhead). Right: Correlated light electron micrograph (CLEM) of confocal inset in A. Red arrowhead indicates discrete membrane fragments acquired by Jurkat from Raji APC. (B) Confocal micrographs of CD28−/− Jurkat cells co-expressing CD28-mCherry and CTLA4-HaloTag (JFX-646) in conjugation with CD80−/−CD86−/− Raji cells expressing CD80-GFP. Insets show CD28 and CTLA4 colocalization with Raji-derived membrane projections. (C) Coomassie brilliant blue stained SDS-PAGE of purified MBP-28.3scFv. (D) Representative confocal micrographs of a Raji (CD80−/−CD86−/−CD80-GFP+):Jurkat (CD28−/−CD28-mCherry+) conjugate (left) and a Raji (CD80−/−CD86−/−CD86-GFP+):Jurkat (CD28−/−CD28-mCherry+) conjugate (right), with or without the presence of 28.3scFv. Scatter plots on the immediate right show the synaptic enrichment indices of CD28. In differential interference contrast (DIC) images, R denotes Raji, J denotes Jurkat. Scale bar: 5 µm. n = 20 conjugates. (E) Cartoon depicting EM labeling strategy of human regulatory T cells following conjugation with Raji B cells expressing CD80-HaloTag (JFX-549). Laser excitation at 561 nm induces oxidative polymerization of electron-dense DAB proximal to CD80. (F) Representative electron micrographs of human Treg cells upon contact with Raji APC expressing CD80-Halo in the presence or absence of 28.3scFv, with CD80-Halo stained by DAB. The rightmost two images under the −28.3scFv condition show zoomed in view of another Treg cell after Raji contact, highlighting possible fusion of CD80-Halo–associated membrane fragments. Error bars in D are SD from 20 Raji:Jurkat conjugates under each indicated condition. ***, P < 0.001; Student’s t test. Source data are available for this figure: SourceData F1.
Figure 2.
Figure 2.
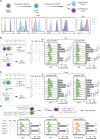
CD28 expressed by human T cells mediate rapid B7 acquisition upon ligand binding. (A) Scheme of Treg and Tconv isolation from human PBMCs. Flow cytometry histograms show surface expressions of CD4, CD25, and CD127 and intracellular expression of Foxp3 of purified Treg and Tconv cells. (B) Effects of CD28 blockade and CTLA4 blockade on the abilities of human Tregs to acquire CD80 and CD86 from Raji APCs. Left: A cartoon depicting a Treg:Raji (CD80−/−CD86−/−CD80-GFP+) or Treg:Raji (CD80−/−CD86−/−CD86-GFP+) coculture assay, after which GFP signal in Tregs was measured. Right: Representative flow cytometry histograms showing the amounts of CD80-GFP or CD86-GFP on Tregs after a 15-min incubation with Raji under the indicated conditions. Bar graphs on the immediate right show the normalized MFI values of acquired GFP on Tregs, calculated by setting the MFI of the “−, −, −, −” condition as 0 and the MFI of “+, +, −, −” condition as 100. (C) Same as in B except replacing human Tregs with Tconvs. (D) Effects of CD28 deficiency or blockade on the abilities of Jurkat to acquire CD80, CD86, and MHCII. Upper: A cartoon depicting the assay setup. Lower: Representative flow cytometry histograms showing the relative levels of acquired CD80, CD86, or MHCII on the indicated Jurkat cells after a 15-min incubation with either Raji (CD80−/−CD86−/−CD80-GFP+) or Raji (CD80−/−CD86−/−CD86-GFP+) cells. Bar graphs immediate right show the normalized MFI values of acquired CD80-GFP, CD86-GFP, or HLA-DR on Jurkat cells, calculated by setting the MFI of “−, −, −” condition as 0 and the MFI of “+, +, −” condition as 100. Error bars are SD from three independent coculture experiments performed on three different days, data in B and C were generated using PBMCs from three independent age-matched donors. *, P < 0.05; **, P < 0.01; ***, P < 0.001; unpaired two-tailed Student’s t test.
Figure S1.
Figure S1.
Gating strategy and protein expression levels related to Fig. 2. (A) Upper: Experimental scheme depicting the method of gating Tregs or Raji cells in coculture. Lower: Flow cytometry contour maps or histograms before and after mixing of Tregs and VF-405 prestained Raji cells. (B) Flow cytometry histograms showing the CD28 and CTLA4 total levels on Jurkat (CD28+/+) and Jurkat (CD28−/−CTLA4high) cells. (C) Flow cytometry histograms showing the MHC II (anti–HLA-DR) levels on Jurkat and Raji cells. (D) Flow cytometry histograms showing the CD28 levels on Jurkat (CD28+/+) and Jurkat (CD28−/−) cells.
Figure 3.
Figure 3.
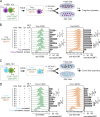
CTLA4-mediated trogocytosis is promoted by TCR stimulation. (A and B) Flow cytometry histograms showing total and surface levels of CD28 and CTLA4 on indicated Jurkat cells. Total and surface staining was conducted with permeabilized and unpermeabilized cells, respectively. Numbers in parentheses indicate percentages of surface CD28 or CTLA4. (C) Schematics of a Jurkat:Raji coculture assay examining CD28 or CTLA4-mediated trogocytosis (acquisition) of B7 and MHC from APCs. (D) Effects of CTLA4 or CD28 blockade on the abilities of indicated Jurkat to acquire CD80, CD86, or MHCII. Representative flow cytometry histograms and MFI values showing the CD80-GFP (reflecting total CD80), anti-CD80 (reflecting surface CD80), CD86-GFP (reflecting total CD86), anti-CD86 (reflecting surface CD86), or anti–HLA-DR (reflecting surface MHCII) in indicated Jurkat after a 15-min incubation with Raji (CD80−/−CD86−/−CD80-GFP+) or Raji (CD80−/−CD86−/−CD86-GFP+) cells under the indicated conditions. Bar graphs immediate right show the normalized MFI (norm MFI) values of acquired CD80-GFP, anti-CD80, CD86-GFP, anti-CD86, or anti–HLA-DR on Jurkat cells, calculated by setting the MFI of “CD28−/− Jurkat −, −, −, −” condition as 0 and the condition with the highest MFI value as 100 in each replicate. Error bars are SD from three independent coculture experiments performed on three different days. *, P < 0.05; **, P < 0.01; ***, P < 0.001; unpaired two-tailed Student’s t test.
Figure S2.
Figure S2.
CTLA4 partially contributed to the acquisition of B7 in Jurkat (CD28+/+CTLA4high) cells, related to Fig. 3. (A) FACS histograms showing the total and surface levels of CD28 and CTLA4 on Tregs and Jurkat (CD28+/+CTLA4high) cells, numbers on the left of histograms showing the MFI values. (B) Effects of CTLA4 and/or CD28 blockade on the abilities of Jurkat to acquire CD80 and CD86. Upper: Schematics of a Jurkat:Raji coculture assay examining Jurkat-mediated acquisition of B7 ligands from APCs. Lower: Representative FACS histograms showing the CD80-GFP or CD86-GFP levels on Jurkat (CD28+/+CTLA4high) cells after a 15-min incubation with either CD80−/−CD86−/−CD80-GFP+ or CD80−/−CD86−/−CD86-GFP+ Raji cells. Bar graphs on the immediate right show the normalized MFI values of acquired CD80-GFP or CD86-GFP on Jurkat cells, calculated by setting the MFI of “−, −, −, −” condition as 0 and the MFI of “+, +, −, −” condition as 100. Error bars are SD from three independent coculture experiments performed on three different days. *, P < 0.05; **, P < 0.01; ***, P < 0.001; unpaired two-tailed Student’s t test.
Figure S3.
Figure S3.
Gating strategy and DC profiling for cell culture assays, related to Fig. 4. (A) Gating strategy of human CD4+ T cells preconditioned with indicated Raji APCs. (B) FACS histograms showing the expression of indicated cell surface markers during DC maturation from human monocytes.
Figure 4.
Figure 4.
CTLA4 restricts autostimulation of CD4+ T cells displaying APC-derived CD80. (A) Human CD4+ T cells, purified from PBMCs of a healthy donor, were incubated with either CD80−/−CD86−/− Raji or CD80−/−CD86−/−CD80-GFP+ Raji, isolated by FACS, and then cultured with mature DCs derived from human monocytes of another donor, in the presence of SEB, before flow cytometry analysis of IL-2+ and IFNγ+ T cells, summarized in the bar graphs. (B) Upper: Experimental scheme depicting the assay setup. Human CD4+ T cells, purified from PBMCs, were incubated with either CD80−/−CD86−/− Raji or CD80−/−CD86−/−CD80-GFP+ Raji, to allow for trogocytosis, isolated by FACS, and then cultured for 1–4 d with SEB in the presence or absence of ipilimumab before measurement of IL-2 concentration in the medium. Lower: Plot summarizing IL-2 concentrations in the indicated conditions. Error bars: SD. **, P < 0.01; ***, P < 0.001; unpaired two-tailed Student’s t test.
Figure 5.
Figure 5.
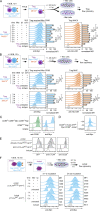
CTLA4 mediates T cell–intrinsic cis depletion of CD80 but not MHCII. (A) Experimental scheme. Human Tregs were precultured with CD80−/−CD86−/−CD80-GFP+ Raji cells in the presence of SEB, isolated by FACS, and incubated alone or with 30-fold excess of CD28/− Jurkat filler cells for 9 h, in the presence or absence of ipilimumab and/or 28.3scFv before flow cytometry measurement of CD80 and HLA-DR amounts. (B) Representative flow cytometry histograms and quantification graph of CD80 and HLA-DR amounts on Tregs before (0 h) and after 9 h incubation under the indicated conditions. Tregs at 0 h were preconditioned by CD80−/−CD86−/−CD80-GFP+ Raji cells as shown in A. Normalized MFIs of anti-CD80 and anti–HLA-DR were calculated by setting the MFI of “Treg untreated, isotype” condition as 0 and the MFI of “0 h, −, −, −” condition as 100. (C and D) Same as A and B except replacing human Tregs with human Tconvs. Error bars are SD from three independent coculture experiments using PBMCs from three independent age-matched donors. *, P < 0.05; **, P < 0.01; ***, P < 0.001; unpaired two-tailed Student’s t test.
Figure S4.
Figure S4.
Confocal microscopy images showing filler cells inhibition of T–T contacts. Treg cells were prestained with VF405 dye (rendered as green) and mixed with 30-fold excess unstained filler cells (shown as gray) before centrifugation onto a flat-bottom plate to form monolayer followed by incubation at 37°C. Shown are representative confocal images of the indicated channels of a randomly selected field taken at indicated time points. Bar graph summarizes the percentage of isolated Treg cells from five different image fields, calculated as (the number of Treg cells not in physical contact with another Treg cell)/(the total number of Treg cells) × 100. Each data point in the bar graph corresponds to the percentage of isolated Treg cells in a randomly selected image field.
Figure S5.
Figure S5.
CTLA4-mediated CD80 cis depletion is promoted by TCR stimulation. (A) FACS histograms showing surface levels of CTLA4 and CD28 on human Tregs after 12 h coculture with Raji (CD80−/−CD86−/−CD80-GFP+) in the presence or absence of SEB. (B) Upper: Experimental scheme. Human Tregs were precultured with CD80-GFP-expressing Raji (CD80-GFP+CD80−/−CD86−/−) in the presence or absence of SEB, isolated by FACS, and incubated with 30-fold excess of CD28−/− Jurkat filler cells for 9 h, in the presence or absence of ipilimumab and/or 28.3scFv before FACS measurement of CD80 and HLA-DR amounts. Lower: Representative FACS histograms and quantification graph of CD80 and HLA-DR amounts on Tregs before (0 h) and after 9 h incubation under the indicated conditions. Tregs at 0 h were preconditioned by Raji (CD80−/−CD86−/−CD80-GFP+) as shown in A. Normalized MFIs of anti-CD80 and anti–HLA-DR were calculated by setting the MFI of “Treg, isotype” as 0 and the MFI of “0 h, +, −, −” as 100. Error bars are SD from three independent coculture experiments, data were generated using PBMCs from three independent age-matched donors. *, P < 0.05; ***, P < 0.001; unpaired two-tailed Student’s t test.
Figure 6.
Figure 6.
CTLA4 mediates cis-endocytosis of CD80 acquired via trogocytosis. (A) Effects of filler cells on CTLA4-mediated depletion of Treg trogocytosed Myc-CD80. Human Tregs were precultured with Myc-CD80–expressing Raji (CD80−/−CD86−/−Myc-CD80+) in the presence of SEB, isolated by FACS, and incubated alone or with 30-fold excess of CD28−/− Jurkat filler cells for 0 or 3 h, in the presence or absence of ipilimumab and/or 28.3scFv before flow cytometry measurement of Myc-CD80 and HLA-DR amounts. Bar graph summarizes data from three technical replicates of Tregs isolated from a single human donor. (B) Effect of TCR stimulation on CTLA4-mediated cis depletion of Treg trogocytosed Myc-CD80. Tregs were precultured with Myc-CD80–expressing Raji (CD80−/−CD86−/−Myc-CD80+) in the presence or absence of SEB, isolated by FACS, and incubated with 30-fold excess of CD28−/− Jurkat filler cells for 0 or 3 h, in the presence or absence of ipilimumab and/or 28.3scFv before flow cytometry measurement of Myc-CD80 and HLA-DR. Bar graph summarizes data from three technical replicates of Tregs isolated from a single human donor. (C) Flow cytometry histograms showing Myc-CD80 and endogenous CD80 expression on indicated Raji cells measured by anti-CD80 staining and anti-Myc staining, respectively. (D) Flow cytometry histograms of anti-Myc staining of indicated Jurkat cells in the presence or absence of ipilimumab. (E) Flow cytometry histograms showing the GFP signal (total expression of CTLA4), anti-CTLA4 staining (surface expression of CTLA4), and anti-CD28 staining (surface expression of CD28) on indicated Jurkat cells. (F) Ipilimumab effects on the cell surface expression of trogocytosed Myc-CD80 in Jurkat expressing CTLA4WT or CTLA4ΔICD. Flow cytometry histograms show anti-Myc staining of indicated Jurkat after 1 h incubation in the presence of excess filler cells at 37°C or on ice, with or without ipilimumab. In A and B, normalized MFIs were calculated by setting the absolute 0 as 0 and the highest MFI value among all the conditions as 100 in each replicate. Error bars: SD. *, P < 0.05; **, P < 0.01; ***, P < 0.001; unpaired two-tailed Student’s t test.
Figure 7.
Figure 7.
CTLA4 binds and depletes T cell–intrinsic CD80 in cis. (A) Left: Experimental scheme. Right: Representative confocal images and quantification violin plot showing how coexpression of CD80 or CD86 affected the B7-Ig staining of CTLA4ΔICD. (B) Flow cytometry histograms showing how coexpression of CD80 or CD86 affected the B7-Ig staining of CTLA4ΔICD. (C) CTLA4 regulation of endogenous CD80 expression on human Tregs. Human Tregs were precultured with CD80−/−CD86−/−CD86-GFP+ Raji, isolated by FACS, and incubated with 30-fold excess of CD28−/− Jurkat filler cells for 6 h, in the presence or absence of ipilimumab and/or 28.3scFv before flow cytometry measurement of anti-CD80 staining. Data presented as three technical replicates for Tregs from a single human donor (male, age 30). Normalized MFIs were calculated by setting the absolute 0 as 0 and the MFI of “Treg untreated” condition as 100 in each replicate. (D) CTLA4 regulation of Myc-CD80 expression in Jurkat cells. CD28−/− or CD28+/+ Jurkat cells cotransduced with CTLA4 and Myc-CD80 were incubated with a 30-fold excess of CD28−/− Jurkat filler cells for 1 h, in the presence or absence of ipilimumab before flow cytometry measurement of anti-Myc staining. Normalized MFIs were calculated by setting the absolute 0 as 0 and the highest MFI value among all the conditions as 100 in each replicate. Error bars: SD. *, P < 0.05; **, P < 0.01; ***, P < 0.001; unpaired two-tailed Student’s t test.
Figure 8.
Figure 8.
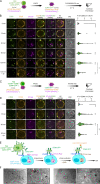
B7 ligands acquired by trogocytosis initially colocalize with CD28 prior to subsequent cis capture and internalization by CTLA4. (A) Experimental scheme for examining the localization of trogocytosed CD80 in Jurkat cells. After coculture with CD80−/−CD86−/−CD80-GFP+ Raji cells, Jurkat (JF646-SPY-CD28+CTLA4-mCherry+) cells were isolated, incubated alone or in the presence of ipilimumab for indicated durations, fixed, and imaged for CD80-GFP, CD28, and CTLA4. (B) Left: Representative maximum intensity z-projection confocal micrographs showing the CD28/CD80/CTLA4 localizations in CD80-GFP acquired Jurkat (JF646-SPY-CD28+CTLA4-mCherry+) cells at indicated time points of post-sorting incubation. Right: A violin plot showing the relative FI values of CD80-GFP colocalized with CTLA4. (C and D) Same as A and B except replacing CD80-GFP with CD86-GFP and showing single images instead of maximum intensity z-projection images. (E) Cartoon depicting dual EM labeling strategy using CD4+ T cells expressing CTLA4-HaloTag conjugated with CD80−/−CD86−/−CD80-GFP+ Raji cells. Laser excitation at 549 nm induces oxidative polymerization of electron-dense DAB proximal to CTLA4-HaloTag (JFX-549), CD80 was labeled by 10-nm nanogold conjugated secondary antibody. (F) Electron micrographs showing CTLA4-HaloTag (DAB staining, white arrowheads) and CD80 (nanogold, red arrowheads). Scale bar: 5 µm. Error bars are SD from 40 cells. **, P < 0.01; ***, P < 0.001; ****, P < 0.0001; unpaired two-tailed Student’s t test.
Figure 9.
Figure 9.
Blockade of either CD28 or CTLA4 inhibits B7 depletion from APCs by human Tregs. (A) Schematics of a Treg:Raji coculture assay examining Treg-mediated depletion of B7 ligands from APCs. GFP fluorescence in Raji (CD80−/−CD86−/−CD80-GFP+) or Raji (CD80−/−CD86−/−CD86-GFP+) cells was measured by flow cytometry after 9 h coculture with human Tregs. (B) Representative flow cytometry histograms and quantification graph of CD80-GFP amounts in Raji (CD80−/−CD86−/−CD80-GFP+) after incubation with Tregs under the indicated conditions. Normalized MFIs of CD80-GFP were calculated by setting the MFI of Raji (CD80−/−CD86−/−) as 0 and the MFI of “−, −, −, −” as 100. (C) Same as B except measuring CD86-GFP in Raji (CD80−/−CD86−/−CD86-GFP+) cells. Error bars are SD from three independent coculture experiments using PBMCs from three independent age-matched donors. *, P < 0.05; **, P < 0.01; ***, P < 0.001; unpaired two-tailed Student’s t test.
Figure 10.
Figure 10.
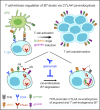
Proposed working model. Summary of the proposed working model of CD28-mediated trogocytosis of B7 ligands from APCs followed by CTLA4-mediated cis-endocytosis of acquired B7 from the T cell surface.

Comment in

References

    1. Akkaya, B., Oya Y., Akkaya M., Al Souz J., Holstein A.H., Kamenyeva O., Kabat J., Matsumura R., Dorward D.W., Glass D.D., and Shevach E.M.. 2019. Regulatory T cells mediate specific suppression by depleting peptide-MHC class II from dendritic cells. Nat. Immunol. 20:218–231. 10.1038/s41590-018-0280-2 - DOI - PMC - PubMed
    1. Akkaya, B., and Shevach E.M.. 2020. Regulatory T cells: Master thieves of the immune system. Cell. Immunol. 355:104160. 10.1016/j.cellimm.2020.104160 - DOI - PMC - PubMed
    1. Al-Yassin, G.A., and Bretscher P.A.. 2018. Does T cell activation require a quorum of lymphocytes? J. Immunol. 201:2855–2861. 10.4049/jimmunol.1800805 - DOI - PubMed
    1. Attanasio, J., and Wherry E.J.. 2016. Costimulatory and coinhibitory receptor pathways in infectious disease. Immunity. 44:1052–1068. 10.1016/j.immuni.2016.04.022 - DOI - PMC - PubMed
    1. Azuma, M., Yssel H., Phillips J.H., Spits H., and Lanier L.L.. 1993. Functional expression of B7/BB1 on activated T lymphocytes. J. Exp. Med. 177:845–850. 10.1084/jem.177.3.845 - DOI - PMC - PubMed

Publication types