BMP-4 and BMP-7 Inhibit EMT in a Model of Anterior Subcapsular Cataract in Part by Regulating the Notch Signaling Pathway
- PMID: 37043340
- PMCID: PMC10103728
- DOI: 10.1167/iovs.64.4.12
BMP-4 and BMP-7 Inhibit EMT in a Model of Anterior Subcapsular Cataract in Part by Regulating the Notch Signaling Pathway
Abstract
Purpose: The proliferation, migration, and epithelial-mesenchymal transition (EMT) of lens epithelial cells (LECs) are believed to be the pathological mechanisms underlying anterior subcapsular cataract (ASC). Bone morphogenetic proteins (BMPs) inhibit transforming growth factor-beta (TGF-β)-induced fibrosis in the lens. Herein, we aimed to further clarify the roles of BMP-4/BMP-7 in the progression and the underlying mechanisms of fibrotic cataract.
Methods: BMP-4/BMP-7, TGF-β2, jagged-1 peptide, or DAPT were applied in a mouse injury-induced ASC model and in the human LEC cell line SRA01/04. The volume of opacity was examined by a slit lamp and determined by lens anterior capsule whole-mount immunofluorescence. Global gene expression changes were assessed by RNA sequencing, and the levels of individual mRNAs were validated by real-time PCR. Protein expression was determined by the Simple Western sample dilution buffer. Cell proliferation was examined by CCK8 and EdU assays, and cell migration was measured by Transwell and wound healing assays.
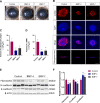
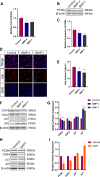
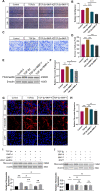
Results: Anterior chamber injection of BMP-4/BMP-7 significantly suppressed subcapsular opacification formation. RNA sequencing of the mouse ASC model identified the Notch pathway as a potential mechanism involved in BMP-mediated inhibition of ASC. Consistently, BMP-4/BMP-7 selectively suppressed Notch1 and Notch3 and their downstream genes, including Hes and Hey. BMP-4/BMP-7 or DAPT suppressed cell proliferation by inducing G1 cell cycle arrest. BMP-4/BMP-7 also inhibited TGF-β2-induced cell migration and EMT by modulating the Notch pathway.
Conclusions: BMP-4/BMP-7 attenuated ASC by inhibiting proliferation, migration, and EMT of LECs via modulation of the Notch pathway, thereby providing a new avenue for ASC treatment.
Conflict of interest statement
Disclosure:
Figures


Similar articles
-
Smurf1 Modulates Smad Signaling Pathway in Fibrotic Cataract Formation.Invest Ophthalmol Vis Sci. 2024 Feb 1;65(2):18. doi: 10.1167/iovs.65.2.18. Invest Ophthalmol Vis Sci. 2024. PMID: 38324299 Free PMC article.
-
Arginase-1 promotes lens epithelial-to-mesenchymal transition in different models of anterior subcapsular cataract.Cell Commun Signal. 2023 Sep 18;21(1):236. doi: 10.1186/s12964-023-01210-4. Cell Commun Signal. 2023. PMID: 37723490 Free PMC article.
-
Autophagy inhibition attenuates TGF-β2-induced epithelial-mesenchymal transition in lens epithelial cells.Life Sci. 2021 Jan 15;265:118741. doi: 10.1016/j.lfs.2020.118741. Epub 2020 Nov 10. Life Sci. 2021. PMID: 33181173
-
Fibrosis in the lens. Sprouty regulation of TGFβ-signaling prevents lens EMT leading to cataract.Exp Eye Res. 2016 Jan;142:92-101. doi: 10.1016/j.exer.2015.02.004. Epub 2015 May 21. Exp Eye Res. 2016. PMID: 26003864 Free PMC article. Review.
-
Roles of TGF β and FGF Signals in the Lens: Tropomyosin Regulation for Posterior Capsule Opacity.Int J Mol Sci. 2018 Oct 9;19(10):3093. doi: 10.3390/ijms19103093. Int J Mol Sci. 2018. PMID: 30304871 Free PMC article. Review.
Cited by
-
Bone morphogenetic proteins (BMPs) at the forefront of ocular diseases and therapeutics.Eye Vis (Lond). 2025 Jul 23;12(1):29. doi: 10.1186/s40662-025-00445-1. Eye Vis (Lond). 2025. PMID: 40696418 Free PMC article. Review.
-
Over-expressed Phospholamban in Cancer-associated Fibroblasts Is a Driver for CMS4 Subtype Colorectal Cancer Formation.Cell Mol Gastroenterol Hepatol. 2025;19(9):101524. doi: 10.1016/j.jcmgh.2025.101524. Epub 2025 Apr 26. Cell Mol Gastroenterol Hepatol. 2025. PMID: 40288441 Free PMC article.
-
JAG1/Notch Pathway Inhibition Induces Ferroptosis and Promotes Cataractogenesis.Int J Mol Sci. 2025 Jan 1;26(1):307. doi: 10.3390/ijms26010307. Int J Mol Sci. 2025. PMID: 39796164 Free PMC article.
-
Smurf1 Modulates Smad Signaling Pathway in Fibrotic Cataract Formation.Invest Ophthalmol Vis Sci. 2024 Feb 1;65(2):18. doi: 10.1167/iovs.65.2.18. Invest Ophthalmol Vis Sci. 2024. PMID: 38324299 Free PMC article.
-
Exosomes containing miR-148a-3p derived from mesenchymal stem cells suppress epithelial-mesenchymal transition in lens epithelial cells.Stem Cells Transl Med. 2025 Feb 11;14(2):szae091. doi: 10.1093/stcltm/szae091. Stem Cells Transl Med. 2025. PMID: 40036306 Free PMC article.
References
-
- Alfonso JF, Lisa C, Abdelhamid A, Fernandes P, Jorge J, Montés-Micó R. Three-year follow-up of subjective vault following myopic implantable collamer lens implantation. Graefes Arch Clin Exp Ophthalmol. 2010; 248: 1827–1835. - PubMed
-
- Nakamura T, Isogai N, Kojima T, Yoshida Y, Sugiyama Y.. Posterior chamber phakic intraocular lens implantation for the correction of myopia and myopic astigmatism: A retrospective 10-year follow-up study. Am J Ophthalmol. 2019; 206: 1–10. - PubMed
-
- Imaizumi T, Kurosaka D, Tanaka U, Sakai D, Fukuda K, Sanbe A.. Topical administration of a ROCK inhibitor prevents anterior subcapsular cataract induced by UV-B irradiation. Exp Eye Res. 2019; 181: 145–149. - PubMed
-
- Dilley KJ, Bron AJ, Habgood JO.. Anterior polar and posterior subcapsular cataract in a patient with retinitis pigmentosa: A light-microscopic and ultrastructural study. Exp Eye Res. 1976; 22: 155–167. - PubMed
-
- Shirai K, Okada Y, Saika S.. Immunohistochemical observation of anterior subcapsular cataract in eye with spontaneously regressed retinoblastoma. J Cataract Refract Surg. 2010; 36: 503–507. - PubMed
Publication types
MeSH terms
Substances
LinkOut - more resources
Full Text Sources
Medical
Miscellaneous

