. 2023 Apr 25;42(4):112353.
doi: 10.1016/j.celrep.2023.112353. Epub 2023 Apr 11.

Decoding the molecular crosstalk between grafted stem cells and the stroke-injured brain

Affiliations

Decoding the molecular crosstalk between grafted stem cells and the stroke-injured brain

Ricardo L Azevedo-Pereira et al. Cell Rep. .

Erratum in

Abstract

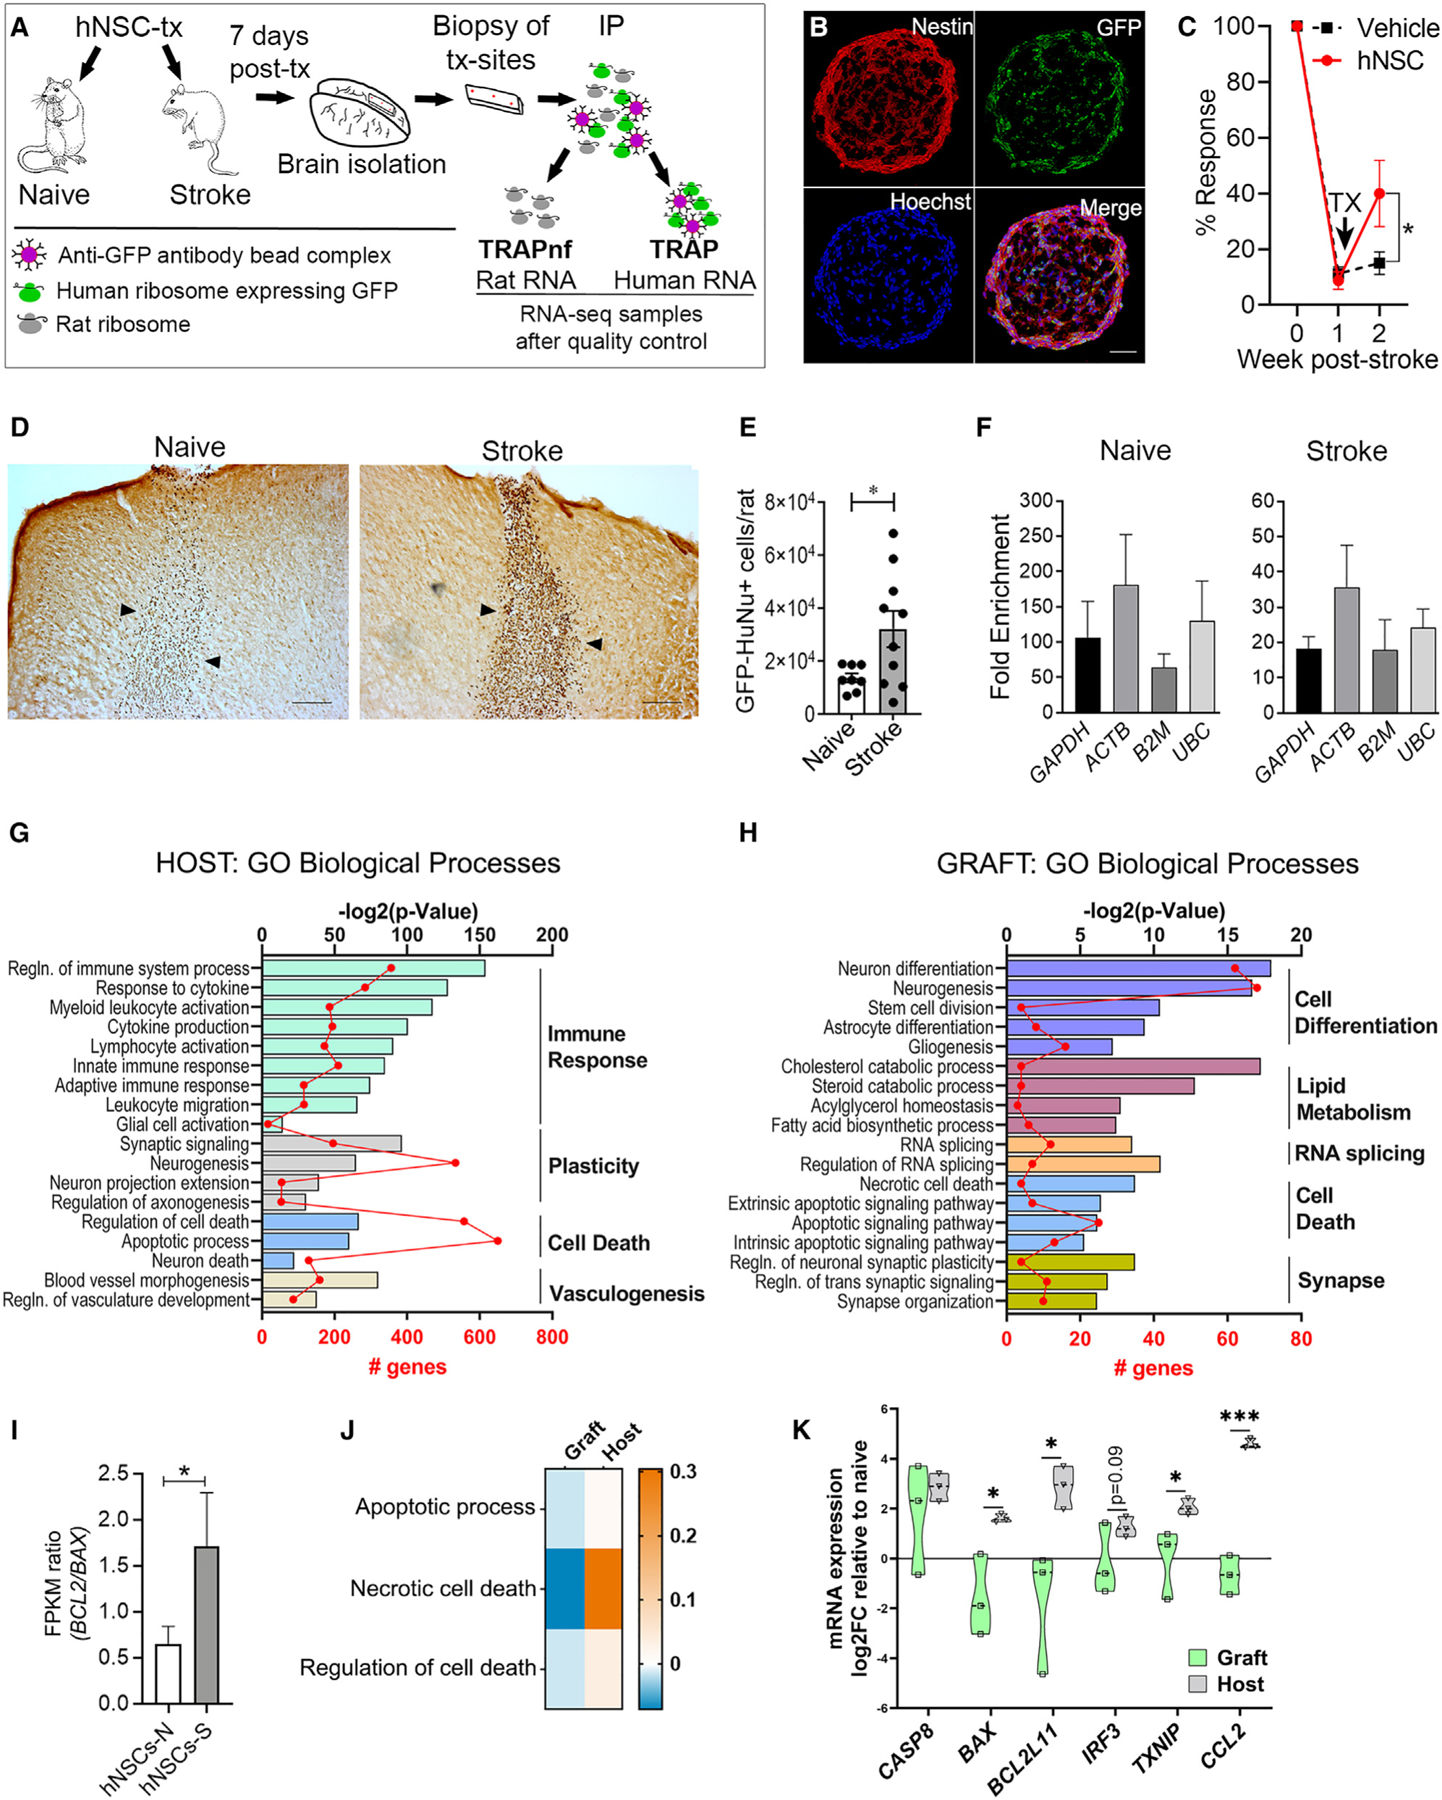
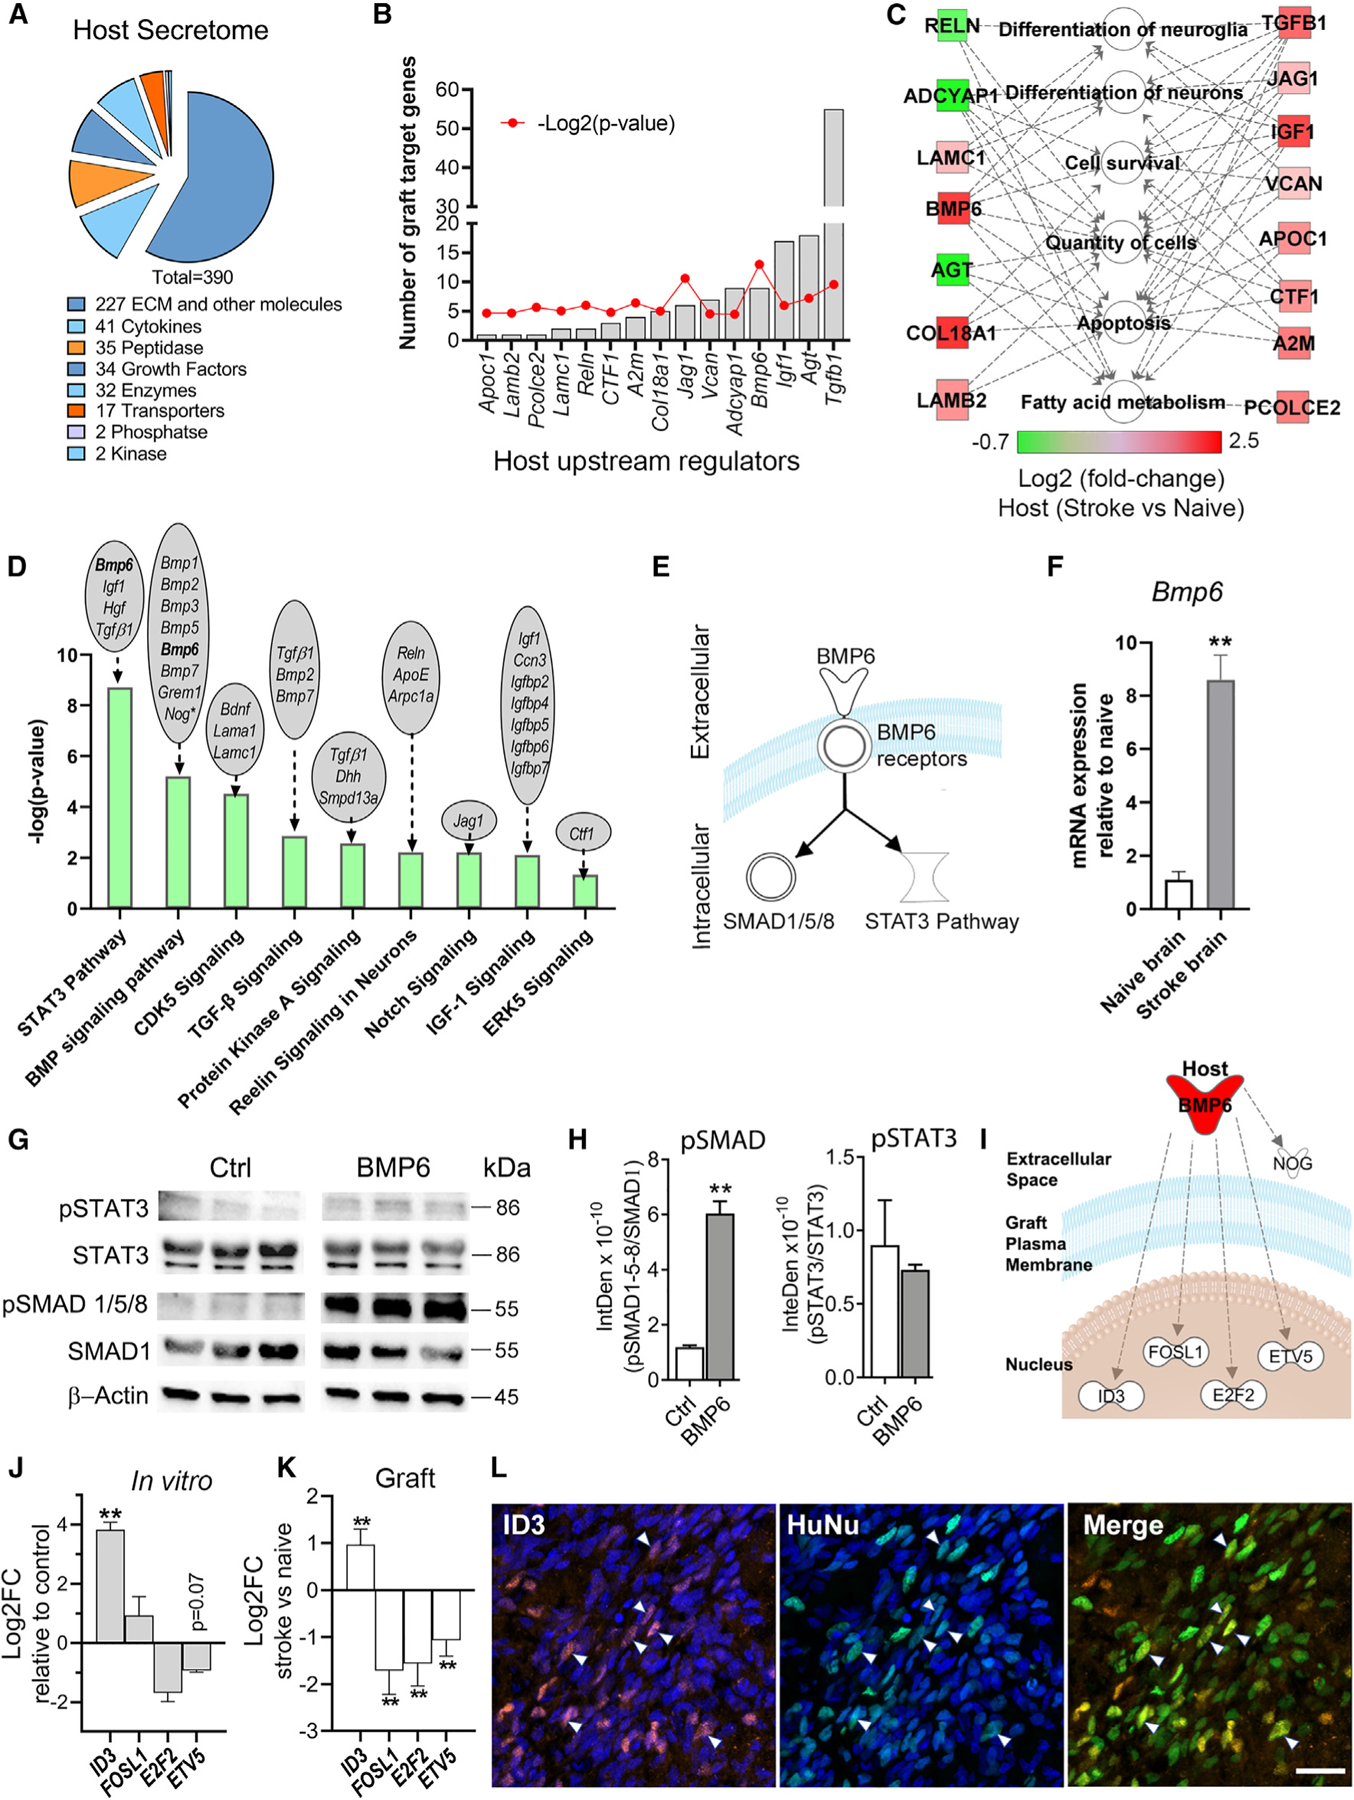
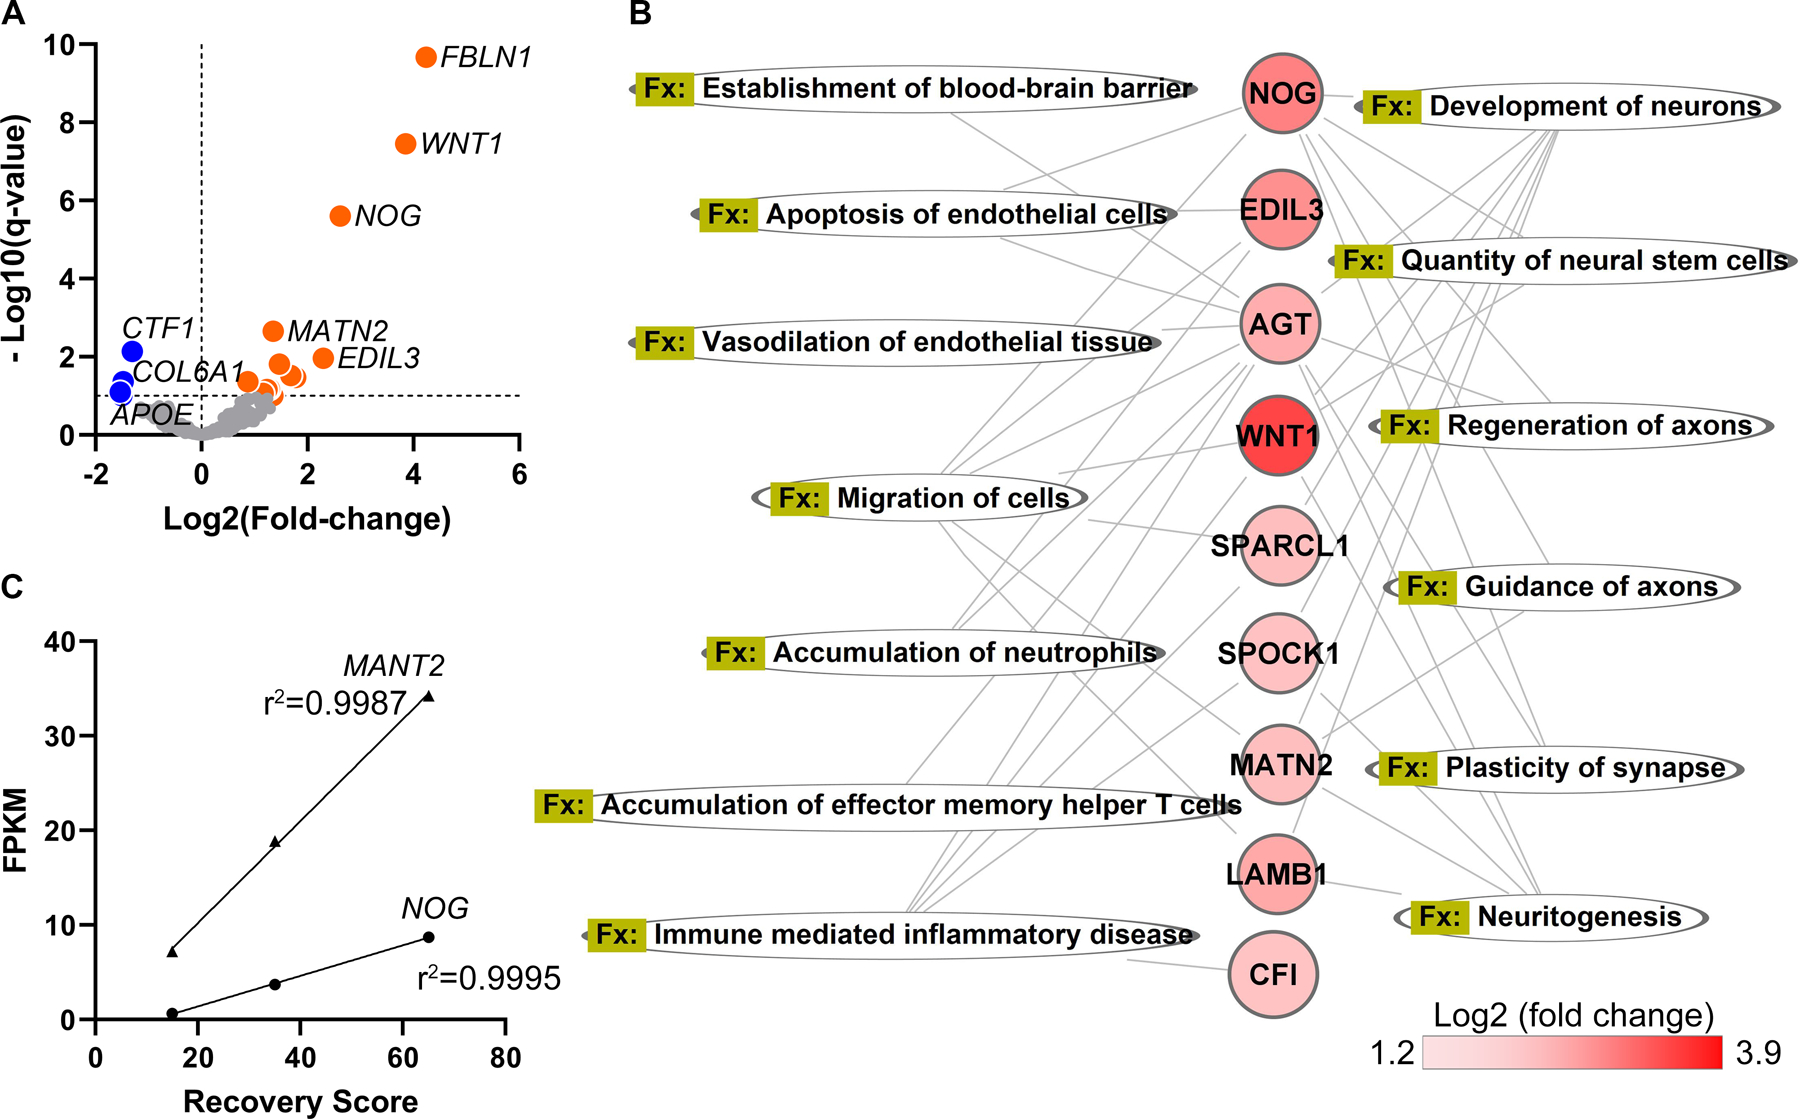
Stem cell therapy shows promise for multiple disorders; however, the molecular crosstalk between grafted cells and host tissue is largely unknown. Here, we take a step toward addressing this question. Using translating ribosome affinity purification (TRAP) with sequencing tools, we simultaneously decode the transcriptomes of graft and host for human neural stem cells (hNSCs) transplanted into the stroke-injured rat brain. Employing pathway analysis tools, we investigate the interactions between the two transcriptomes to predict molecular pathways linking host and graft genes; as proof of concept, we predict host-secreted factors that signal to the graft and the downstream molecular cascades they trigger in the graft. We identify a potential host-graft crosstalk pathway where BMP6 from the stroke-injured brain induces graft secretion of noggin, a known brain repair factor. Decoding the molecular interplay between graft and host is a critical step toward deciphering the molecular mechanisms of stem cell action.

Keywords: BMP6; CP: Neuroscience; CP: Stem cell research; NOG; RNA-seq; TRAP; mechanism; stem cell; stroke; transcriptome; transplant.


Conflict of interest statement

Declaration of interests The authors declare no competing interests.

Figures

Figure 1.
Figure 1.. TRAP-seq facilitates separation and identification of graft and host transcriptomes
(A) TRAP-seq method overview: hNSCs were transplanted into brain of naive and stroke rats (7 days post-stroke) and biopsy of transplantation sites taken 7 days later. GFP-tagged ribosomes were immunoprecipitated (IP) using anti-GFP antibody. mRNA of graft (TRAP) and host (TRAP-negative fraction [TRAPnf]) were isolated for sequencing. (B) hNSC neurospheres express nestin and GFP. Hoechst-stained nuclei (blue). Scale: 50 µm. (C) Whisker-paw reflex behavioral test following stroke and treatment. Tx, time of treatment. *p < 0.05; two-way ANOVA-Sidak; n = 4/group. (D) hNSC survival 7 days post-transplantation into naive and stroke-injured brains. hNSCs (dark brown) are stained for GFP plus human nuclear marker. Arrowheads indicate graft borders. Scale: 100 µm. (E) Quantification of hNSCs in naive (n = 8) and stroke (n = 10) brains (*p < 0.05; unpaired Welch’s t test). (F) Degree of graft RNA enrichment by TRAP (compared with using conventional RNA isolation; n = 4). (G) Gene set enrichment analysis of host tissue DEGs. (H) Gene set enrichment analysis of graft DEGs. (I) FPKM ratio of BCL-2 and BAX expressed in hNSCs grafted in naive (hNSC-N) or stroke (hNSC-S) brains. n = 3; *p = 0.05; Mann-Whitney, one-tailed. (J) Heatmap of gene ratio indicating whether GO term enrichment is driven by downregulated genes (blue), upregulated genes (orange), or both (white). (K) qPCR validation showing differential regulation of pro-death genes in graft and host. Data shown as log2 fold change (FC) of stroke versus naive for host (gray) and for graft in stroke versus naive environment (green). Violin plot showing all points, n = 3; *p < 0.05, ***p < 0.001 by one-tailed t test of host versus graft. All graph error bars: SEM. See also Figures S1 and S2 and Table S1.
Figure 2.
Figure 2.. Graft and host transcriptome interactome analyses predict signaling from the host brain to the graft
(A) Host secretome signature of differentially expressed secretome genes in naive versus stroke-injured brains. (B) Host-expressed upstream regulators (URs) of grafted hNSC DEGs. (C) Molecular functions of host URs identified in (B). (D) Graft canonical pathways predicted to be affected by host environment. Host brain DEGs that signal to these pathways indicated above each bar. (E) BMP6 signaling pathways schematic. (F) qPCR validation of increased host Bmp6 expression in stroke versus naive brains. n = 3; **p < 0.01; unpaired t test. (G) Immunoblotting for pSTAT3 and pSMAD1/5/8 in BMP6-treated hNSCs. SMAD1, STAT3, and β-actin used as internal controls. Membranes were digitally cut at the molecular weight of each protein. Space between control (Ctrl) and BMP6 images indicates lanes removed relating to BDNF-treated hNSCs (data not shown). (H) Intensity density (InteDen) quantification of western blots for pSMAD 1/5/8 and pSTAT3. n = 3; **p < 0.01; Welch’s t test. (I) Schematic of graft DEGs (white symbols) predicted to be downstream of host-secreted BMP6 (red). (J) qPCR analysis showing BMP6 (50 ng/mL) treatment affects expression of its predicted downstream genes in cultured hNSCs. n = 3; **p < 0.01 compared with non-stimulated (control); multiple t tests with Holm-Sidak multiple comparisons correction. (K) Graph showing log2FC of predicted downstream genes of BMP6, in hNSCs grafted in stroke versus naive brains, as determined by DESeq2 analysis of RNA-seq data. n = 3, **p < 0.01. (L) Confocal projection image showing graft cells (green) at the stroke lesion border express ID3 (red), a downstream target of pSMAD signaling. Arrowheads indicate some ID3+ graft cells. HuNu, human nuclei marker. Blue: Hoechst nuclei stain. Scale: 20 µm. All graph error bars: SEM. See also Figures S3 and S4 and Table S2.
Figure 3.
Figure 3.. Graft secretome is modulated by the host environment
(A) Volcano plot of graft secretome genes. Orange: graft genes upregulated by the stroke environment; blue: downregulated genes. (B) Molecular functions of graft secretome genes upregulated by the stroke environment. (C) Linear regression showing positive correlation between graft expression levels of NOG and MATN2 with the extent of graft-induced behavior recovery. p < 0.05, q = 0.15 by the Benjamini-Hochberg procedure.
Figure 4.
Figure 4.. Host and graft crosstalk mediated by BMP-NOG interplay
(A) qPCR of TRAP samples confirming increased expression of NOG by hNSCs grafted into stroke (hNSC-S; n = 4) versus naive brain (hNSC-N; n = 3). ***p < 0.001; Welch’s t test. (B) Immunohistochemistry (IHC) and ISH of hNSCs in stroke brain expressing mCherry protein (mCh; red) and NOG mRNA (green). Hoechst-stained nuclei (blue); scale: 50 µm. White box in first panel indicates region magnified in subsequent panels. (C) URs of NOG predicted by IPA and STRING. Colored edges represent action type: activation (green); inhibition (red); transcriptional regulation (yellow); comentioned in previous reports (gray); unspecified reaction (black). (D) Expression levels, by RNA-seq analyses, of host secretome genes encoding URs of NOG. n = 3–4, ****p < 0.0001 by DESeq2 analysis of stroke versus naive tissue. (E) qPCR of NOG in cultured hNSCs after stimulation with recombinant BMP6 or TGFb1. n = 3; ****p < 0.001 compared with non-stimulated (Ctrl); one way ANOVA with Tukey post-hoc. (F) ELISA quantification of tissue culture conditioned media showing Bmp6 treatment significantly increased noggin expression by hNSCs in vitro (n = 3; *p < 0.05; unpaired t test). (G) Pearson correlation between Bmp6 expression in stroke tissue and corresponding graft NOG expression based on RNA-seq data. (H) qPCR analysis showing BMP6 induces NOG expression in cultured hNSCs in a dose-dependent manner. n = 3; ****p < 0.0001; one way ANOVA with Tukey post-hoc. (I) Schematic of potential graft and host crosstalk mediated by the BMP6 pathway. All graph error bars: SEM.

References

    1. Trounson A, and McDonald C (2015). Stem cell therapies in clinical trials: progress and challenges. Cell Stem Cell 17, 11–22. 10.016/j.stem.2015.06.007. - DOI - PubMed
    1. Steinberg GK, Kondziolka D, Wechsler LR, Lunsford LD, Coburn ML, Billigen JB, Kim AS, Johnson JN, Bates D, King B, et al. (2016). Clinical outcomes of transplanted modified bone marrow-derived mesenchymal stem cells in stroke: a phase 1/2a study. Stroke 47, 1817–1824. 10.1161/STROKEAHA.116.012995. - DOI - PMC - PubMed
    1. Heiman M, Schaefer A, Gong S, Peterson JD, Day M, Ramsey KE, Suárez-Fariñas M, Schwarz C, Stephan DA, Surmeier DJ, et al. (2008). A translational profiling approach for the molecular characterization of CNS cell types. Cell 135, 738–748. 10.1016/j.cell.2008.10.028. - DOI - PMC - PubMed
    1. Andres RH, Horie N, Slikker W, Keren-Gill H, Zhan K, Sun G, Manley NC, Pereira MP, Sheikh LA, McMillan EL, et al. (2011). Human neural stem cells enhance structural plasticity and axonal transport in the ischaemic brain. Brain 134, 1777–1789. 10.1093/brain/awr094. - DOI - PMC - PubMed
    1. Horie N, Pereira MP, Niizuma K, Sun G, Keren-Gill H, Encarnacion A, Shamloo M, Hamilton SA, Jiang K, Huhn S, et al. (2011). Transplanted stem cell-secreted vascular endothelial growth factor effects poststroke recovery, inflammation, and vascular repair. Stem Cells 29, 274–285. 10.1002/stem.584. - DOI - PMC - PubMed

Publication types