

Use of machine learning to identify risk factors for insomnia
- PMID: 37043435
- PMCID: PMC10096447
- DOI: 10.1371/journal.pone.0282622
Use of machine learning to identify risk factors for insomnia
Abstract
Importance: Sleep is critical to a person's physical and mental health, but there are few studies systematically assessing risk factors for sleep disorders.
Objective: The objective of this study was to identify risk factors for a sleep disorder through machine-learning and assess this methodology.
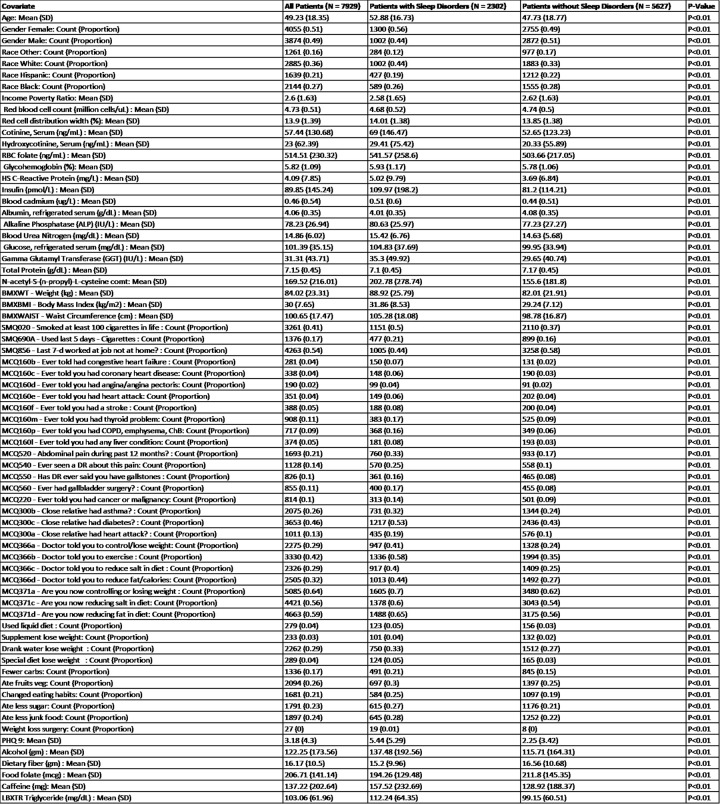
Design, setting, and participants: A retrospective, cross-sectional cohort study using the publicly available National Health and Nutrition Examination Survey (NHANES) was conducted in patients who completed the demographic, dietary, exercise, and mental health questionnaire and had laboratory and physical exam data.
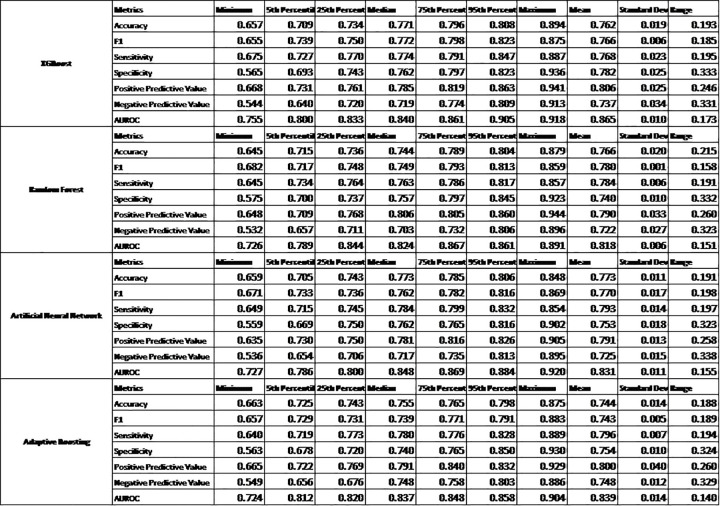
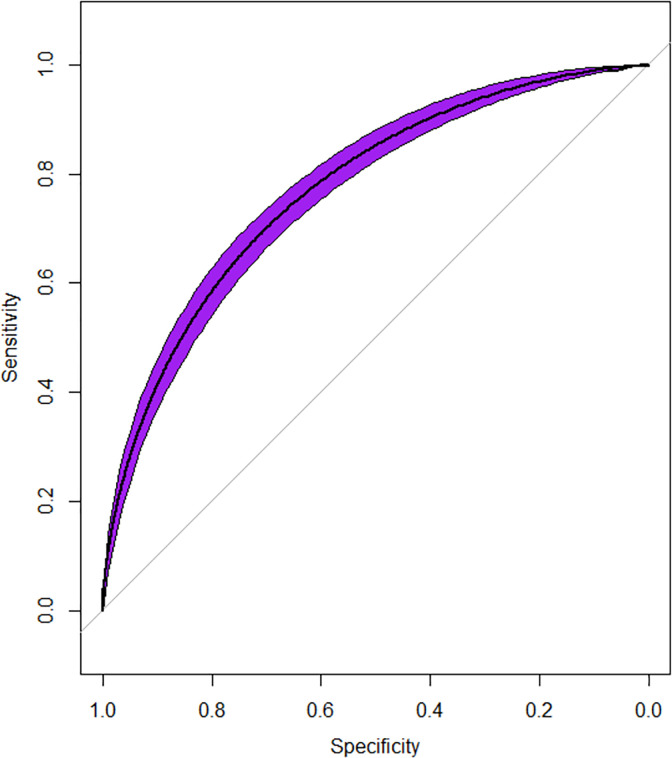
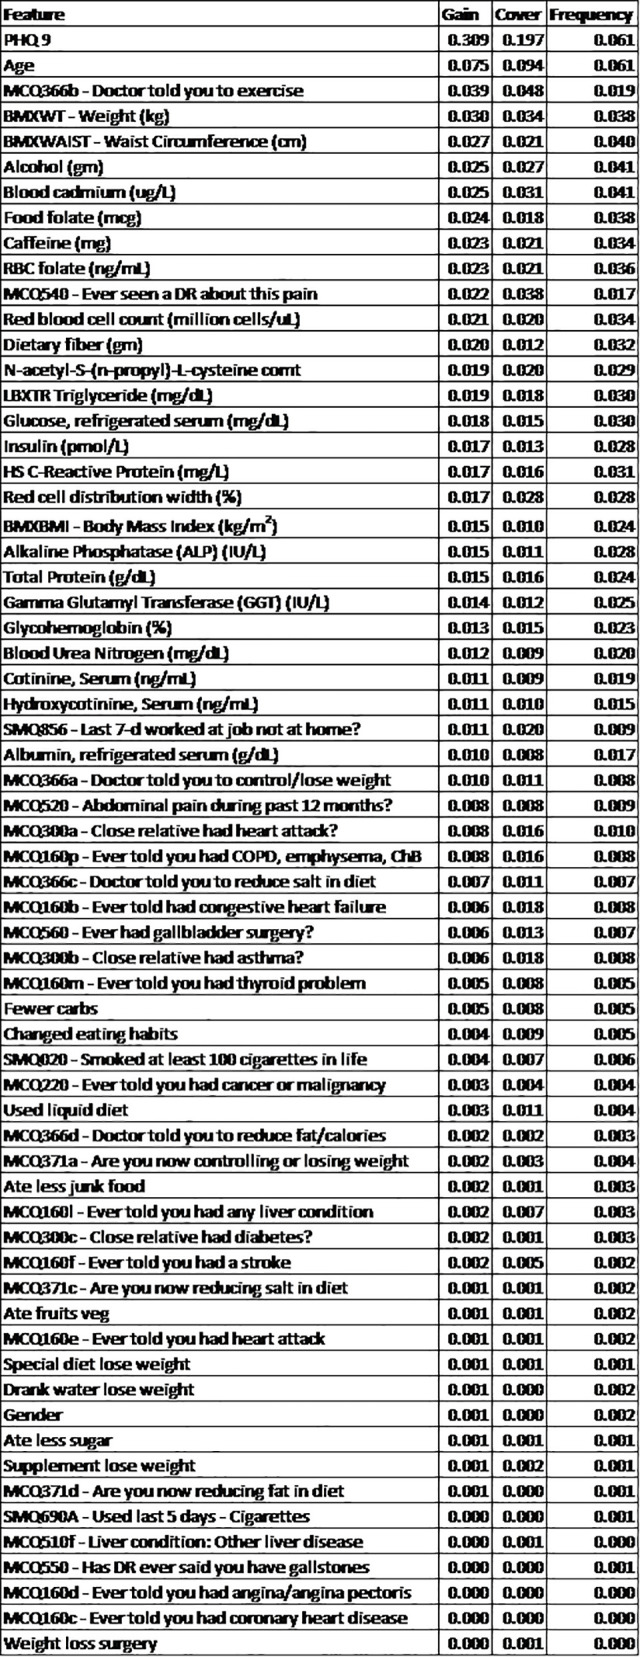
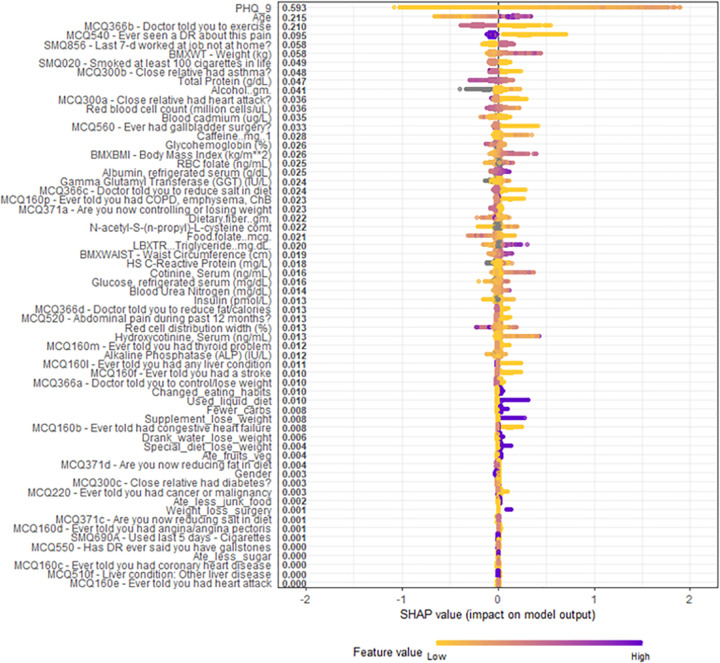
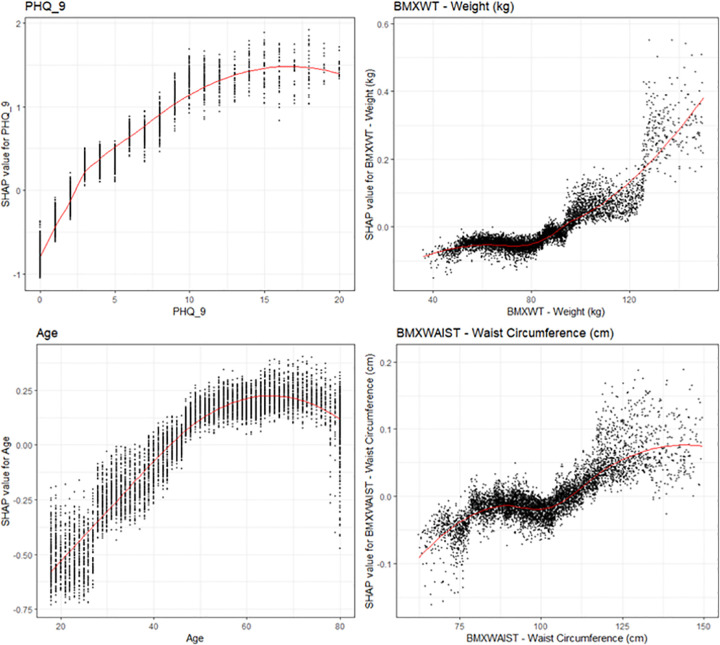
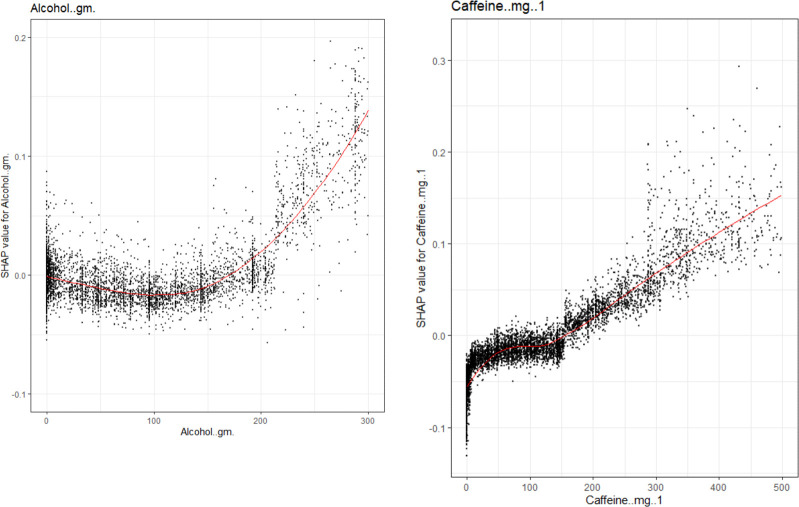
Methods: A physician diagnosis of insomnia was the outcome of this study. Univariate logistic models, with insomnia as the outcome, were used to identify covariates that were associated with insomnia. Covariates that had a p<0.0001 on univariate analysis were included within the final machine-learning model. The machine learning model XGBoost was used due to its prevalence within the literature as well as its increased predictive accuracy in healthcare prediction. Model covariates were ranked according to the cover statistic to identify risk factors for insomnia. Shapely Additive Explanations (SHAP) were utilized to visualize the relationship between these potential risk factors and insomnia.
Results: Of the 7,929 patients that met the inclusion criteria in this study, 4,055 (51% were female, 3,874 (49%) were male. The mean age was 49.2 (SD = 18.4), with 2,885 (36%) White patients, 2,144 (27%) Black patients, 1,639 (21%) Hispanic patients, and 1,261 (16%) patients of another race. The machine learning model had 64 out of a total of 684 features that were found to be significant on univariate analysis (P<0.0001 used). These were fitted into the XGBoost model and an AUROC = 0.87, Sensitivity = 0.77, Specificity = 0.77 were observed. The top four highest ranked features by cover, a measure of the percentage contribution of the covariate to the overall model prediction, were the Patient Health Questionnaire depression survey (PHQ-9) (Cover = 31.1%), age (Cover = 7.54%), physician recommendation of exercise (Cover = 3.86%), weight (Cover = 2.99%), and waist circumference (Cover = 2.70%).
Conclusion: Machine learning models can effectively predict risk for a sleep disorder using demographic, laboratory, physical exam, and lifestyle covariates and identify key risk factors.
Copyright: © 2023 Huang, Huang. This is an open access article distributed under the terms of the Creative Commons Attribution License, which permits unrestricted use, distribution, and reproduction in any medium, provided the original author and source are credited.
Conflict of interest statement
The authors have declared that no competing interests exist.
Figures
Similar articles
-
Use of machine learning to identify risk factors for coronary artery disease.PLoS One. 2023 Apr 14;18(4):e0284103. doi: 10.1371/journal.pone.0284103. eCollection 2023. PLoS One. 2023. PMID: 37058460 Free PMC article.
-
Comparison of model feature importance statistics to identify covariates that contribute most to model accuracy in prediction of insomnia.PLoS One. 2024 Jul 2;19(7):e0306359. doi: 10.1371/journal.pone.0306359. eCollection 2024. PLoS One. 2024. PMID: 38954735 Free PMC article.
-
Shapely additive values can effectively visualize pertinent covariates in machine learning when predicting hypertension.J Clin Hypertens (Greenwich). 2023 Dec;25(12):1135-1144. doi: 10.1111/jch.14745. Epub 2023 Nov 16. J Clin Hypertens (Greenwich). 2023. PMID: 37971610 Free PMC article.
-
Exploring Depression and Nutritional Covariates Amongst US Adults using Shapely Additive Explanations.Health Sci Rep. 2023 Oct 20;6(10):e1635. doi: 10.1002/hsr2.1635. eCollection 2023 Oct. Health Sci Rep. 2023. PMID: 37867784 Free PMC article.
-
Application of a transparent artificial intelligence algorithm for US adults in the obese category of weight.PLoS One. 2024 May 31;19(5):e0304509. doi: 10.1371/journal.pone.0304509. eCollection 2024. PLoS One. 2024. PMID: 38820332 Free PMC article.
Cited by
-
Association between neutrophil to high-density lipoprotein cholesterol ratio (NHR) and depression symptoms among the United States adults: a cross-sectional study.Lipids Health Dis. 2024 Jul 13;23(1):215. doi: 10.1186/s12944-024-02204-y. Lipids Health Dis. 2024. PMID: 39003458 Free PMC article.
-
Association between red blood cell distribution width-to-albumin ratio and depression: a cross-sectional analysis among US adults, 2011-2018.BMC Psychiatry. 2025 May 7;25(1):464. doi: 10.1186/s12888-025-06907-z. BMC Psychiatry. 2025. PMID: 40335911 Free PMC article.
-
Predictive modeling of lean body mass, appendicular lean mass, and appendicular skeletal muscle mass using machine learning techniques: A comprehensive analysis utilizing NHANES data and the Look AHEAD study.PLoS One. 2024 Sep 6;19(9):e0309830. doi: 10.1371/journal.pone.0309830. eCollection 2024. PLoS One. 2024. PMID: 39240958 Free PMC article.
-
The Clínica Universidad de Navarra-Body Adiposity Estimator index is a reliable tool for screening metabolic dysfunction-associated steatotic liver disease: an analysis from a gender perspective.Lipids Health Dis. 2024 Sep 27;23(1):311. doi: 10.1186/s12944-024-02299-3. Lipids Health Dis. 2024. PMID: 39334354 Free PMC article.
-
Treatment of Depression-Related Circadian Rhythm Sleep-Wake Disorder (CRSWD) With Melatonin Receptor Agonist Ramelteon: A Case Report.Cureus. 2024 Aug 31;16(8):e68311. doi: 10.7759/cureus.68311. eCollection 2024 Aug. Cureus. 2024. PMID: 39350880 Free PMC article.
References
-
- Wang J, Ren X. Association Between Sleep Duration and Sleep Disorder Data from the National Health and Nutrition Examination Survey and Stroke Among Adults in the United States. Med Sci Monit. 2022;28:e936384. Epub 20220703. doi: 10.12659/MSM.936384 ; PubMed Central PMCID: PMC9261468. - DOI - PMC - PubMed
-
- Wolf C, Wolf S, Weiss M, Nino G. Children’s Environmental Health in the Digital Era: Understanding Early Screen Exposure as a Preventable Risk Factor for Obesity and Sleep Disorders. Children (Basel). 2018;5(2). Epub 20180223. doi: 10.3390/children5020031 ; PubMed Central PMCID: PMC5836000. - DOI - PMC - PubMed
-
- Guo Q, Xie W, Peng R, Ma Y, Chong F, Wang Y, et al.. A Dose-Response Relationship Between Sleep Duration and Stroke According to Nonhealth Status in Central China: A Population-based Epidemiology Survey. J Stroke Cerebrovasc Dis. 2019;28(7):1841–52. Epub 20190507. doi: 10.1016/j.jstrokecerebrovasdis.2019.04.016 . - DOI - PubMed
-
- Carriedo-Diez B, Tosoratto-Venturi JL, Canton-Manzano C, Wanden-Berghe C, Sanz-Valero J. The Effects of the Exogenous Melatonin on Shift Work Sleep Disorder in Health Personnel: A Systematic Review. Int J Environ Res Public Health. 2022;19(16). Epub 20220817. doi: 10.3390/ijerph191610199 ; PubMed Central PMCID: PMC9408537. - DOI - PMC - PubMed
MeSH terms
LinkOut - more resources
Full Text Sources
Medical
Miscellaneous
