. 2023 May 2;40(5):msad088.
doi: 10.1093/molbev/msad088.

The Origin of Floral Quartet Formation-Ancient Exon Duplications Shaped the Evolution of MIKC-type MADS-domain Transcription Factor Interactions

Affiliations

The Origin of Floral Quartet Formation-Ancient Exon Duplications Shaped the Evolution of MIKC-type MADS-domain Transcription Factor Interactions

Florian Rümpler et al. Mol Biol Evol. .

Abstract

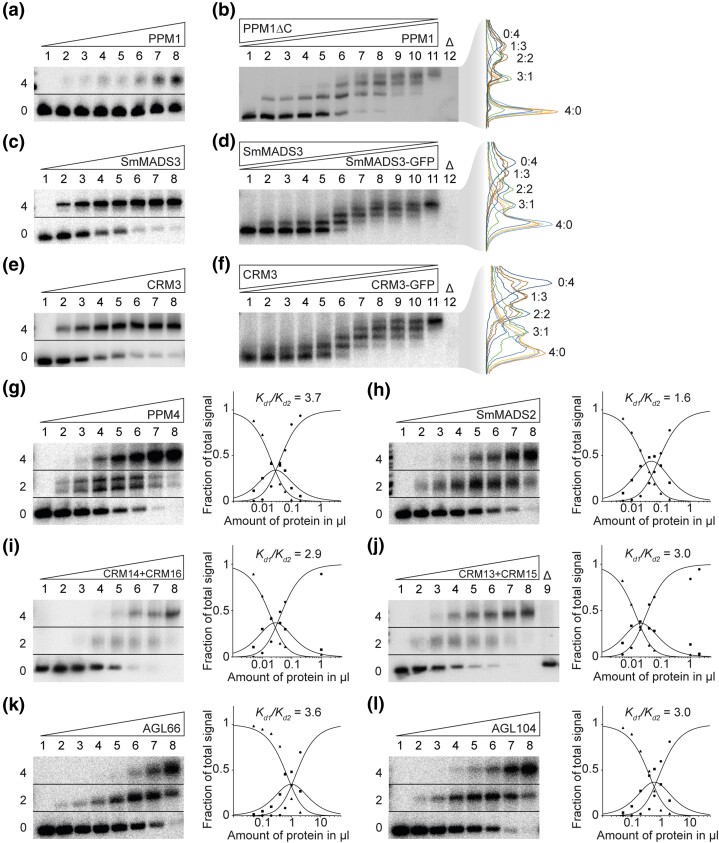
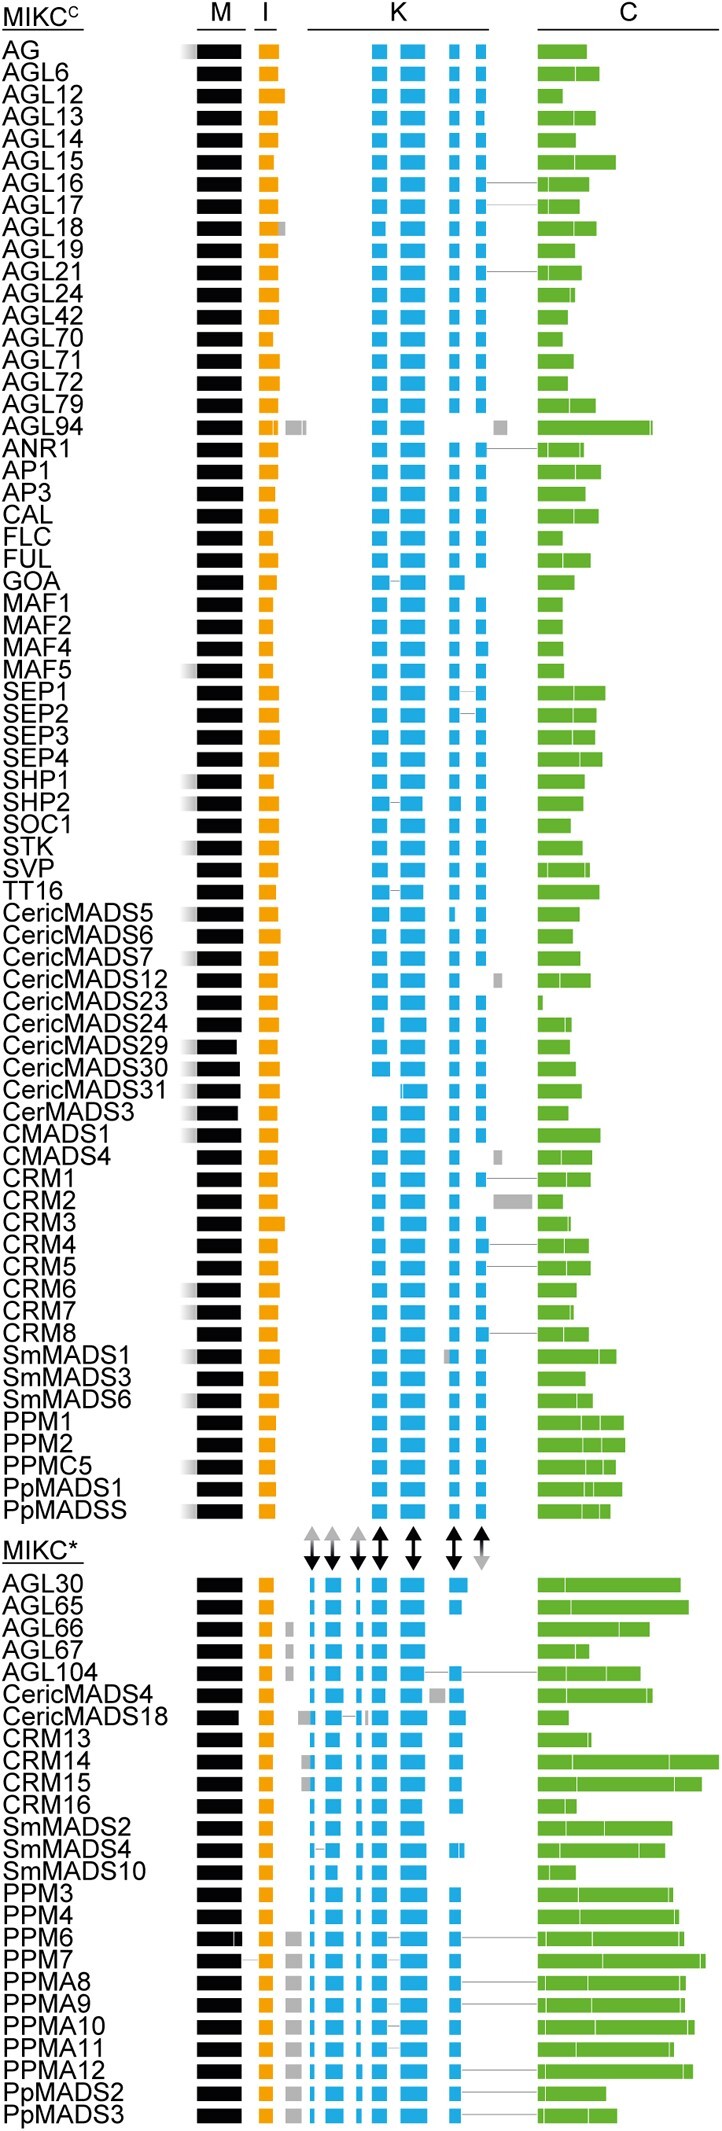
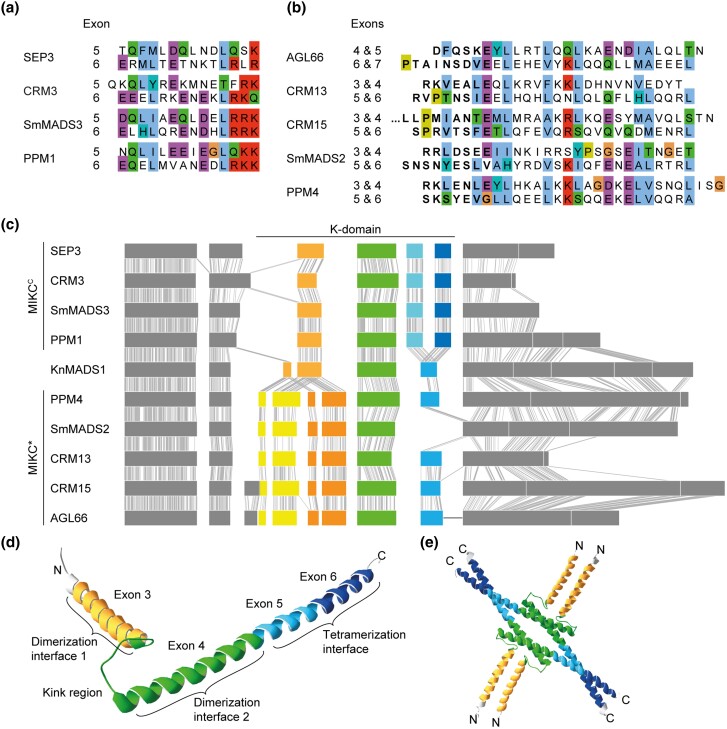
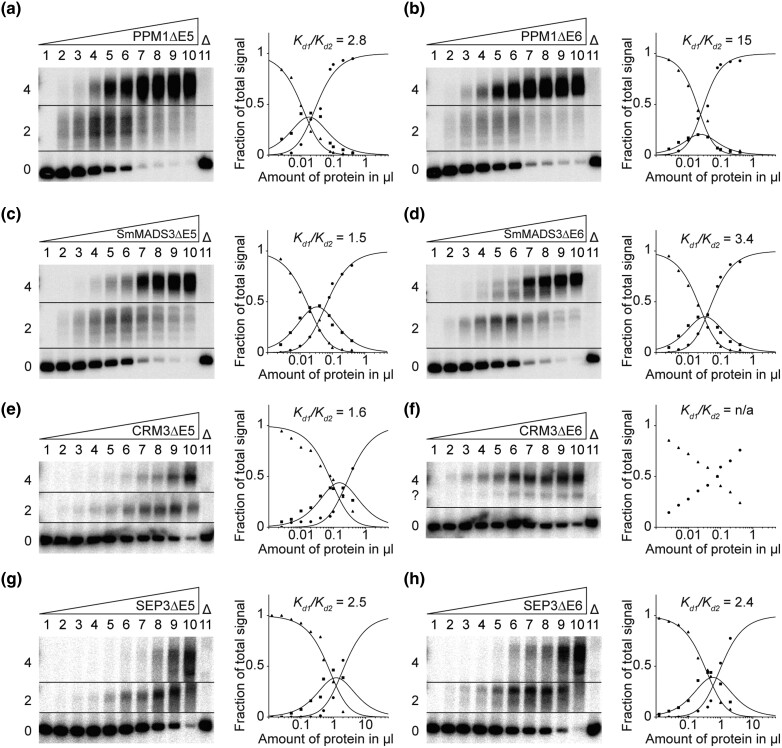
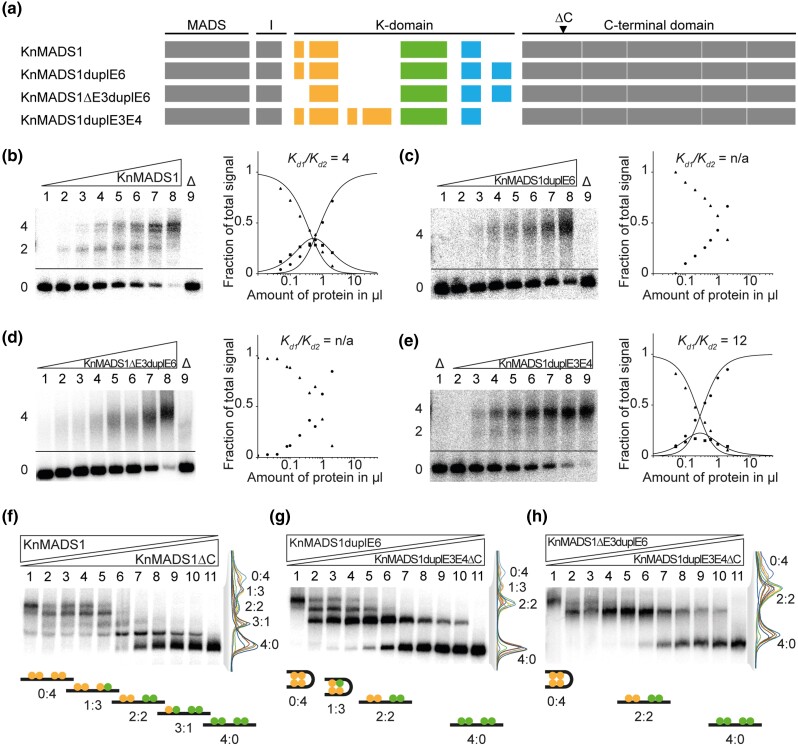
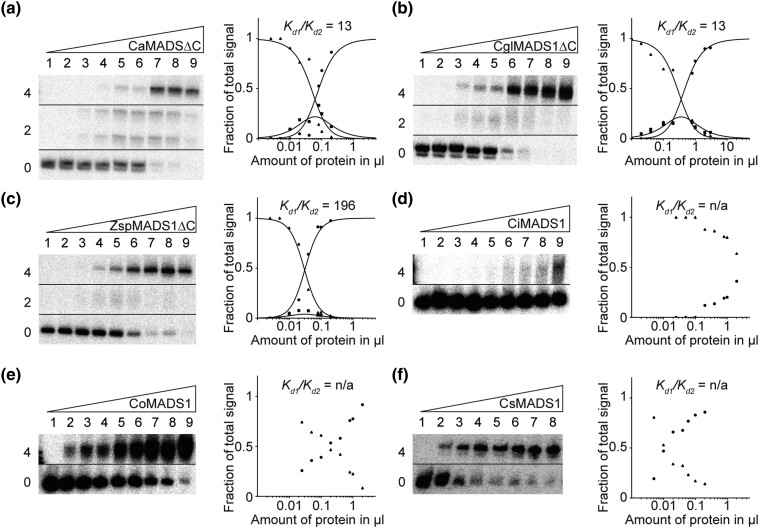
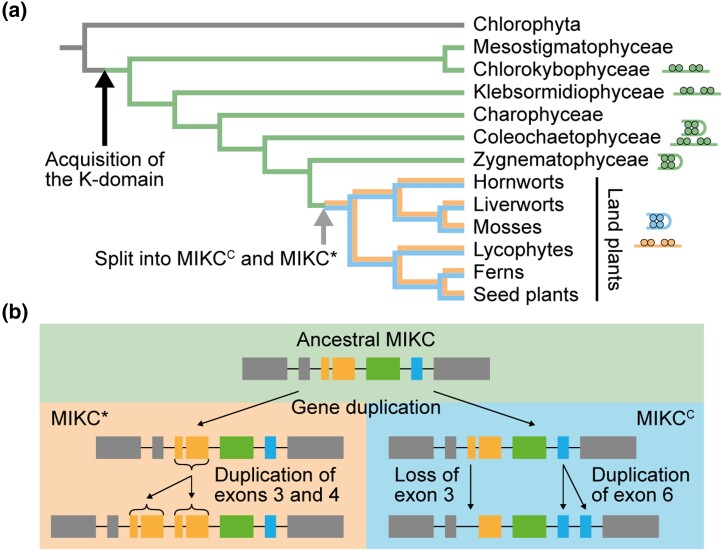
During development of flowering plants, some MIKC-type MADS-domain transcription factors (MTFs) exert their regulatory function as heterotetrameric complexes bound to two sites on the DNA of target genes. This way they constitute "floral quartets" or related "floral quartet-like complexes" (FQCs), involving a unique multimeric system of paralogous protein interactions. Tetramerization of MTFs is brought about mainly by interactions of keratin-like (K) domains. The K-domain associated with the more ancient DNA-binding MADS-domain during evolution in the stem group of extant streptophytes (charophyte green algae + land plants). However, whether this was sufficient for MTF tetramerization and FQC formation to occur, remains unknown. Here, we provide biophysical and bioinformatic data indicating that FQC formation likely originated in the stem group of land plants in a sublineage of MIKC-type genes termed MIKCC-type genes. In the stem group of this gene lineage, the duplication of the most downstream exon encoding the K-domain led to a C-terminal elongation of the second K-domain helix, thus, generating the tetramerization interface found in extant MIKCC-type proteins. In the stem group of the sister lineage of the MIKCC-type genes, termed MIKC*-type genes, the duplication of two other K-domain exons occurred, extending the K-domain at its N-terminal end. Our data indicate that this structural change prevents heterodimerization between MIKCC-type and MIKC*-type proteins. This way, two largely independent gene regulatory networks could be established, featuring MIKCC-type or MIKC*-type proteins, respectively, that control different aspects of plant development.

Keywords: MADS-box gene; MIKC-type MADS-domain transcription factor; cooperative DNA binding; floral quartet; keratin-like domain; protein–protein interaction.


Conflict of interest statement

Conflict of Interest statement. The authors declare no conflict of interest.

Figures

Fig. 1.
Fig. 1.
FQC formation capabilities of MIKCC- and MIKC*-type MADS-TFs from Physcomitrium patens, Selaginella moellendorffii, Ceratopteris richardii, and Arabidopsis thaliana. (a, c, e) Increasing amounts of in vitro transcribed/translated (a) PPM1, (c) SmMADS3, and (e) CRM3 protein, respectively, were coincubated together with constant amounts of radioactively labeled DNA probe 1. Two fractions of different electrophoretic mobility occur—a fraction of high electrophoretic mobility, constituting unbound DNA probe (labeled with “0” on the left of the gel picture), and a retarded fraction constituting a DNA probe bound by four proteins (“4”). (b, d, f) To determine the stoichiometry of the protein-DNA complexes observed in a, c, and e, (b) PPM1, (d) SmMADS3, and (f) CRM3 wild-type proteins were coexpressed at different ratios with PPM1ΔC, SmMADS3-GFP, and CRM3-GFP, respectively, and coincubated together with constant amounts of DNA probe 1. An overlay of measured signal intensities of the individual lanes is shown on the right. Each peak of the graph is labeled according to the ratio of wild-type and truncated/elongated protein of the corresponding fraction. (g-l) Increasing amounts of in vitro transcribed/translated (g) PPM4, (h) SmMADS2, (i) CRM14 + CRM16, (j) CRM13 + CRM15, (k) AGL66, and (l) AGL104 was coincubated together with constant amounts of radioactively labeled DNA probe 2. Three fractions of different electrophoretic mobility occur—a fraction of high electrophoretic mobility constituting unbound DNA probe (labeled with “0”), a fraction of intermediate electrophoretic mobility constituting a DNA probe bound by a single protein dimer (“2”) and a fraction of low electrophoretic mobility constituting a DNA probe bound by four proteins (“4”). Signal intensities of different fractions were measured and plotted against the amount of applied protein (triangles, free DNA; squares, DNA probe bound by two proteins; circles, DNA probe bound by four proteins). Graphs were fitted according to equations (1)–(3) described in Materials and Methods to eventually quantify and express FQC formation capabilities by Kd1/Kd2. In case of (g) PPM4, a double band was observed for the fraction of intermediate electrophoretic mobility, likely caused by different conformations of the DNA-bound protein dimer. As negative control, 2 µl of in vitro transcription/translation mixture loaded with the empty pTNT plasmid were added to the binding reaction (“Δ”). (a, c, e, gl) Applied amounts of in vitro transcription/translation products were (lanes 1–8) 0, 0.05, 0.1, 0.2, 0.4, 0.6, 1, and 2 µl, whereby CRM3, PPM4, SmMADS2, CRM14 + CRM16, and CRM13 + CRM15 were prediluted 1:10 and PPM1 and SmMADS3 were prediluted 1:20 with BSA (10 mg/ml). (b, d, f) 3 µl of in vitro transcription/translation product were applied to each lane. Ratios of both template plasmids used for in vitro transcription/translation were (lanes 1–11): 0:1, 1:9, 1:7, 1:5, 1:3, 1:1, 3:1, 5:1, 7:1, 9:1, 1:0.
Fig. 2.
Fig. 2.
Exon homology of MIKCC- and MIKC*-type genes from Arabidopsis thaliana, Ceratopteris richardii, Selaginella moellendorffii, and Physcomitrium patens. Colored boxes represent coding exons of all MIKCC- and MIKC*-type genes from A. thaliana, C. richardii, S. moellendorffii, and P. patens. Introns and noncoding exons are not shown. Exons encoding for the MADS-domain, the intervening domain (I-domain), the keratin-like domain (K-domain), and the C-terminal domain (C-domain) are labeled on top and are additionally color coded in black, yellow, blue, and green, respectively. Exons with uncertain homology assignment are color-coded in gray. Exons encoding for MADS-, I-, and K-domain were aligned according their homology based on a multiple sequence alignment of the encoded proteins back translated into a codon alignment (for details, see Materials and Methods). Fused exons are connected by horizontal black lines. Two-headed arrows between MIKCC- and MIKC*-type genes illustrate presence (black) or absence (gray arrowhead) of homologous exons in either of the two subfamilies.
Fig. 3.
Fig. 3.
Similarity of K-domain exons hypothesized to be duplicated. (a, b) Multiple sequence alignment of the amino acids encoded by (a) exons 5 and 6 of the MIKCC-type genes SEP3, CRM3, SmMADS3, and PPM1 and (b) exons 4–7 of the MIKC*-type gene AGL66 and exons 3–6 of CRM13, CRM15, SmMADS2, and PPM4, respectively. (c) Exon–intron structure of the MIKCC- and MIKC*-type genes shown in a and b, respectively, together with the exon–intron structure of the charophyte MIKC-type gene KnMADS1. Homologous exons were aligned and identical nucleotide positions of neighboring sequences are connected with solid gray lines to illustrate homology. K-domain exons shared by MIKCC-, MIKC*-, and charophyte MIKC-type genes are color-coded in green, hypothetically duplicated K-domain exons of MIKCC- and MIKC*-type genes are color-coded in different shades of blue and yellow/orange, respectively. (d) X-ray crystal structure of the MIKCC-type protein SEP3 (PDB-ID: 4OX0). Subdomains encoded by exons 3, 4, 5, and 6, as indicated, are color-coded in yellow, green, light blue, and dark blue, respectively. (e) Tetramer of four SEP3 K-domains following the same color-coding as in d. Protein structure images were generated with Swiss-PdbViewer (Guex and Peitsch 1997).
Fig. 4.
Fig. 4.
FQC formation capabilities of exon deletion mutants of the MIKCC-type proteins PPM1, SmMADS3, CRM3, and SEP3. Increasing amounts of in vitro transcribed/translated (a) PPM1ΔE5, (b) PPM1ΔE6, (c) SmMADS3ΔE5, (d) SmMADS3ΔE6, (e) CRM3ΔE5, (f) CRM3ΔE6, (g) SEP3ΔE5, and (h) SEP3ΔE6 were coincubated together with constant amounts of DNA probe 1. For details, see legend of figure 1. (f) Because CRM3ΔE6 produced no signal of intermediate electrophoretic mobility constituting a DNA probe bound by a single protein dimer, Kd1/Kd2 cannot be determined. Applied amounts of in vitro transcription/translation products were (lanes 1–10) 0, 0.0125, 0.025, 0.05, 0.1, 0.2, 0.4, 0.5, 1, and 2 µl, whereby PPM1ΔE5, PPM1ΔE6, SmMADS3ΔE5, SmMADS3ΔE6, CRM3ΔE5, and CRM3ΔE6 were prediluted 1:5 with BSA (10 mg/ml).
Fig. 5.
Fig. 5.
FQC formation capabilities of exon duplication and deletion mutants of the charophyte MIKC-type protein KnMADS1. (a) Exon–intron structure of KnMADS1 wild type and the mutated version KnMADS1duplE6, KnMADS1ΔE3duplE6, and KnMADS1duplE3E4. K-domain exons are color coded according to figure 3c. Black triangle highlights the position at which the coding sequence was terminated to generate C-terminally truncated versions of KnMADS1 and KnMADS1duplE3E4. (b-e) Increasing amounts of in vitro transcribed/translated (b) KnMADS1, (c) KnMADS1duplE6, (d) KnMADS1ΔE3duplE6, and (e) KnMADS1duplE3E4 was coincubated together with constant amounts of DNA probe 1. For details, see legend of figure 1. Because (c) KnMADS1duplE6 and (d) KnMADS1ΔE3duplE6 produced no signals of intermediate electrophoretic mobility constituting a DNA probe bound by a single protein dimer, Kd1/Kd2 cannot be determined. (f) KnMADS1 wild-type protein was coexpressed at different ratios with KnMADS1ΔC and coincubated together with constant amounts of DNA probe 1. An overlay of measured signal intensities of the individual lanes is shown on the right. Each peak of the graph is labeled according to the ratio of full-length and truncated protein of the corresponding fraction. The cartoons below the gel illustrate the composition of the different fractions with full-length and truncated proteins shown in yellow and green, respectively. (g, h) To test for heteromeric interaction capabilities between KnMADS1duplE6, KnMADS1ΔE3duplE6, and KnMADS1duplE3E4, the same assay as in f was conducted using (g) KnMADS1duplE6 together with KnMADS1duplE3E4ΔC and (h) KnMADS1ΔE3duplE6 together with KnMADS1duplE3E4ΔC, respectively. (be) Applied amounts of in vitro transcription/translation products were (lanes 1–8) 0, 0.05, 0.1, 0.2, 0.4, 0.6, 1, and 2 µl. (fh) 3 µl of in vitro transcription/translation product were applied to each lane. Ratios of both template plasmids used for in vitro transcription/translation were (lanes 1–11): 0:1, 1:9, 1:7, 1:5, 1:3, 1:1, 3:1, 5:1, 7:1, 9:1, 1:0.
Fig. 6.
Fig. 6.
FQC formation capabilities of the charophyte MIKC-type proteins CaMADS1, CglMADS1, ZspMADS1, CiMADS1, CoMADS1, and CsMADS1. Increasing amounts of in vitro transcribed/translated (a) CaMADS1ΔC, (b) CglMADS1ΔC, (c) ZspMADS1ΔC, (d) CiMADS1, (e) CoMADS1, and (f) CsMADS1, were coincubated together with constant amounts of DNA probe 1. For details see legend of figure 1. Because (d) CiMADS1, (e) CoMADS1, and (f) CsMADS1 produced no signal of intermediate electrophoretic mobility constituting a DNA probe bound by a single protein dimer, Kd1/Kd2 cannot be determined. In case of (a) CaMADS1, a double band was observed for the fraction of intermediate electrophoretic mobility, likely caused by different conformations of the DNA-bound protein dimer. Because CaMADS1, CglMADS1, and ZspMADS1 full-length proteins comprise very long C-terminal domains, resulting in low DNA-binding affinities and blurry bands, C-terminally truncated mutants were used instead. Applied amounts of in vitro transcription/translation products were (a, ce) (lanes 1–9) 0, 0.025, 0.05, 0.1, 0.2, 0.4, 0.8, 1, and 2 µl, whereby CaMADS1ΔC and ZspMADS1ΔC were prediluted 1:10 with BSA (10 mg/ml), (b) (lanes 1–9) 0.02, 0.04, 0.1, 0.2, 0.4, 0.8, 1, 2, and 3 µl, (f) (lanes 1–8) 0, 0.005, 0.01, 0.02, 0.04, 0.06, 0.1, and 0.2 µl.
Fig. 7.
Fig. 7.
Hypothesized mode of MTF evolution. (a) Simplified phylogenetic tree of green plants with highlighted major evolutionary changes of Type II MADS-box genes (branching according to Wickett et al. [2014]). In the stem group of extant streptophytes (charophytes + land plants), an ancestral type II MADS-box gene (illustrated by gray branch color) acquired the K-domain, giving rise to the eponymous “MIKC” domain architecture of the encoded MTFs. In the stem group of extant land plants, a gene duplication of an ancestral MIKC-type gene (illustrated by green branch color) gave rise to the two, land plant–specific, MTF subfamilies MIKCC (blue branch color) and MIKC* (orange branch color). Gray arrow depicts the time point, when the evolutionary changes shown in b occurred. Cartoons of FQCs and DNA-bound MTF dimers indicate presence or absence, respectively, of FQC formation capabilities of MTFs in the respective plant lineages. (b) Following the gene duplication of an ancestral MIKC-type gene (upper part, green background), the first two K-domain exons got duplicated in the gene lineage of MIKC*-type genes (left part, orange background), whereas the first K-domain exon got lost and the last K-domain exon got duplicated in the gene lineage of MIKCC-type genes (right part, blue background).

Similar articles

Cited by

References

    1. Amoutzias GD, Robertson DL, Van de Peer Y, Oliver SG. 2008. Choose your partners: dimerization in eukaryotic transcription factors. Trends Biochem Sci. 33:220–229. - PubMed
    1. de Folter S, Immink RGH, Kieffer M, Parenicova L, Henz SR, Weigel D, Busscher M, Kooiker M, Colombo L, Kater MM, et al. . 2005. Comprehensive interaction map of the Arabidopsis MADS box transcription factors. Plant Cell. 17:1424–1433. - PMC - PubMed
    1. Derelle E, Ferraz C, Rombauts S, Rouze P, Worden AZ, Robbens S, Partensky F, Degroeve S, Echeynie S, Cooke R, et al. . 2006. Genome analysis of the smallest free-living eukaryote Ostreococcus tauri unveils many unique features. Proc Natl Acad Sci U S A. 103:11647–11652. - PMC - PubMed
    1. Egea-Cortines M, Saedler H, Sommer H. 1999. Ternary complex formation between the MADS-box proteins SQUAMOSA, DEFICIENS and GLOBOSA is involved in the control of floral architecture in Antirrhinum majus. EMBO J. 18:5370–5379. - PMC - PubMed
    1. Espinosa-Soto C, Immink RGH, Angenent GC, Alvarez-Buylla ER, de Folter S. 2014. Tetramer formation in Arabidopsis MADS domain proteins: analysis of a protein-protein interaction network. BMC Syst Biol. 8:9. - PMC - PubMed

Publication types