. 2023 Apr 18;120(16):e2211755120.
doi: 10.1073/pnas.2211755120. Epub 2023 Apr 12.

Contextual modifiers of healthspan, lifespan, and epigenome in mice under chronic social stress

Affiliations

Contextual modifiers of healthspan, lifespan, and epigenome in mice under chronic social stress

Maria Razzoli et al. Proc Natl Acad Sci U S A. .

Abstract

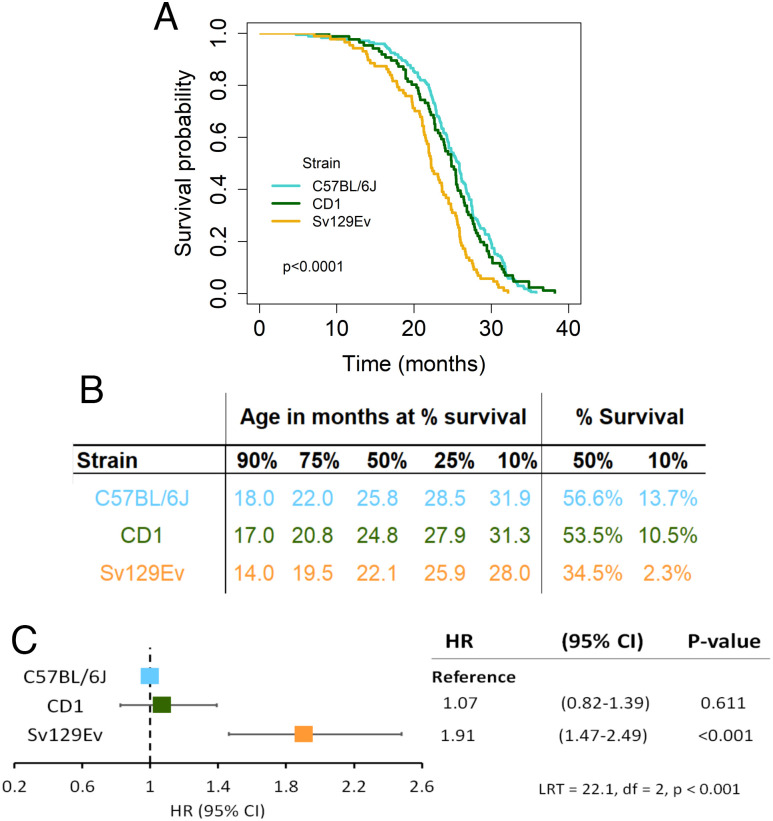
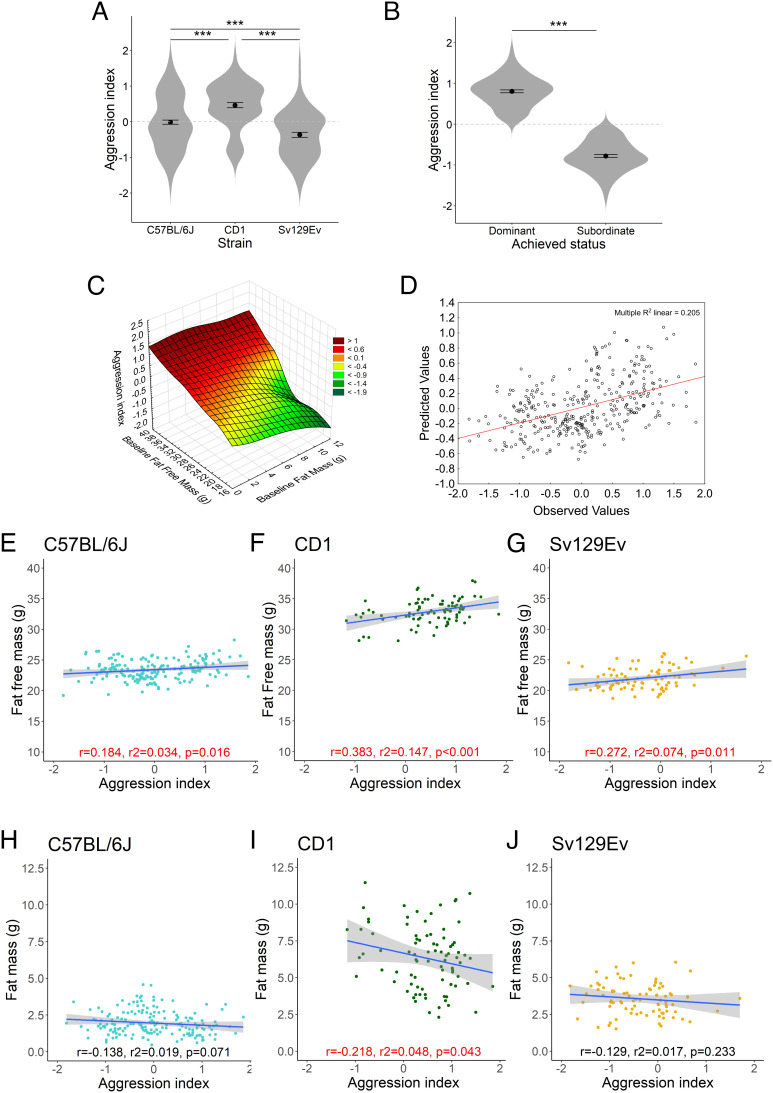
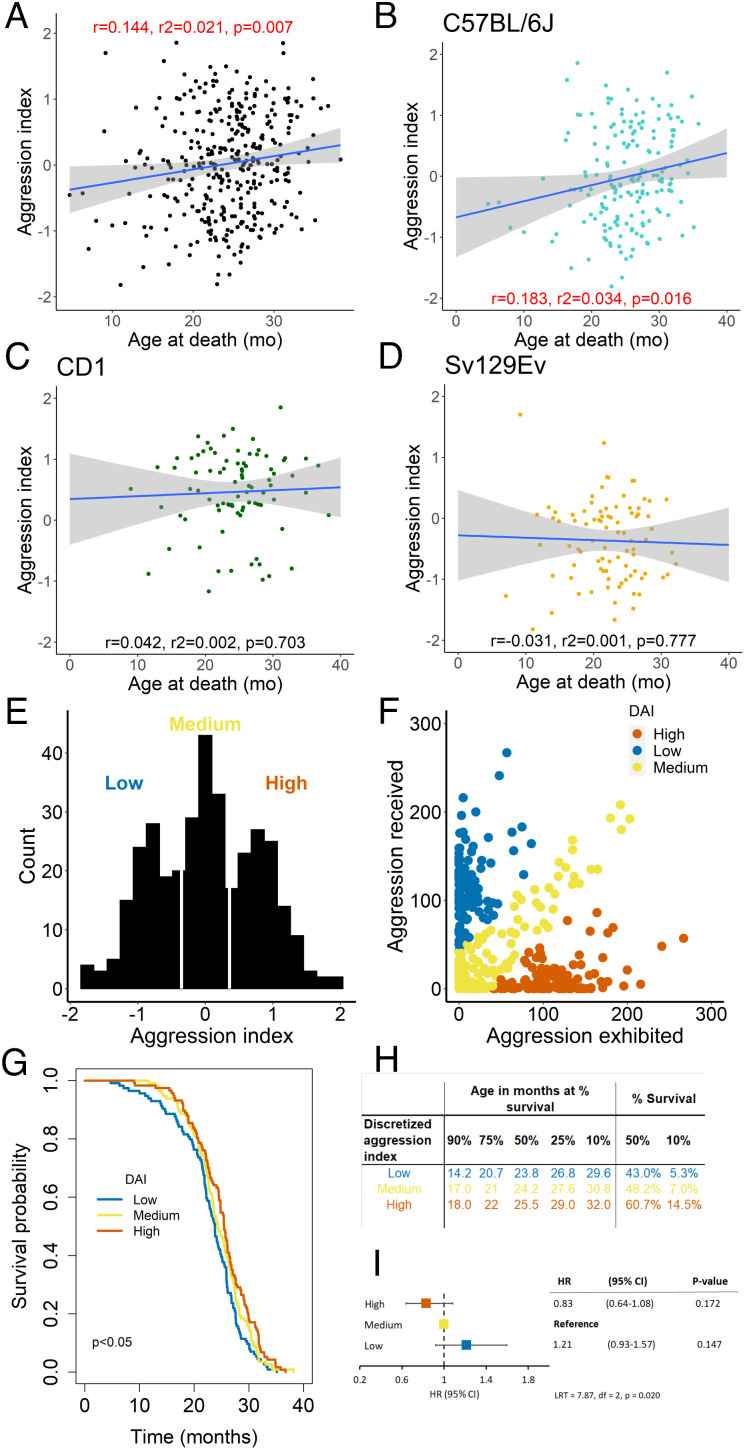
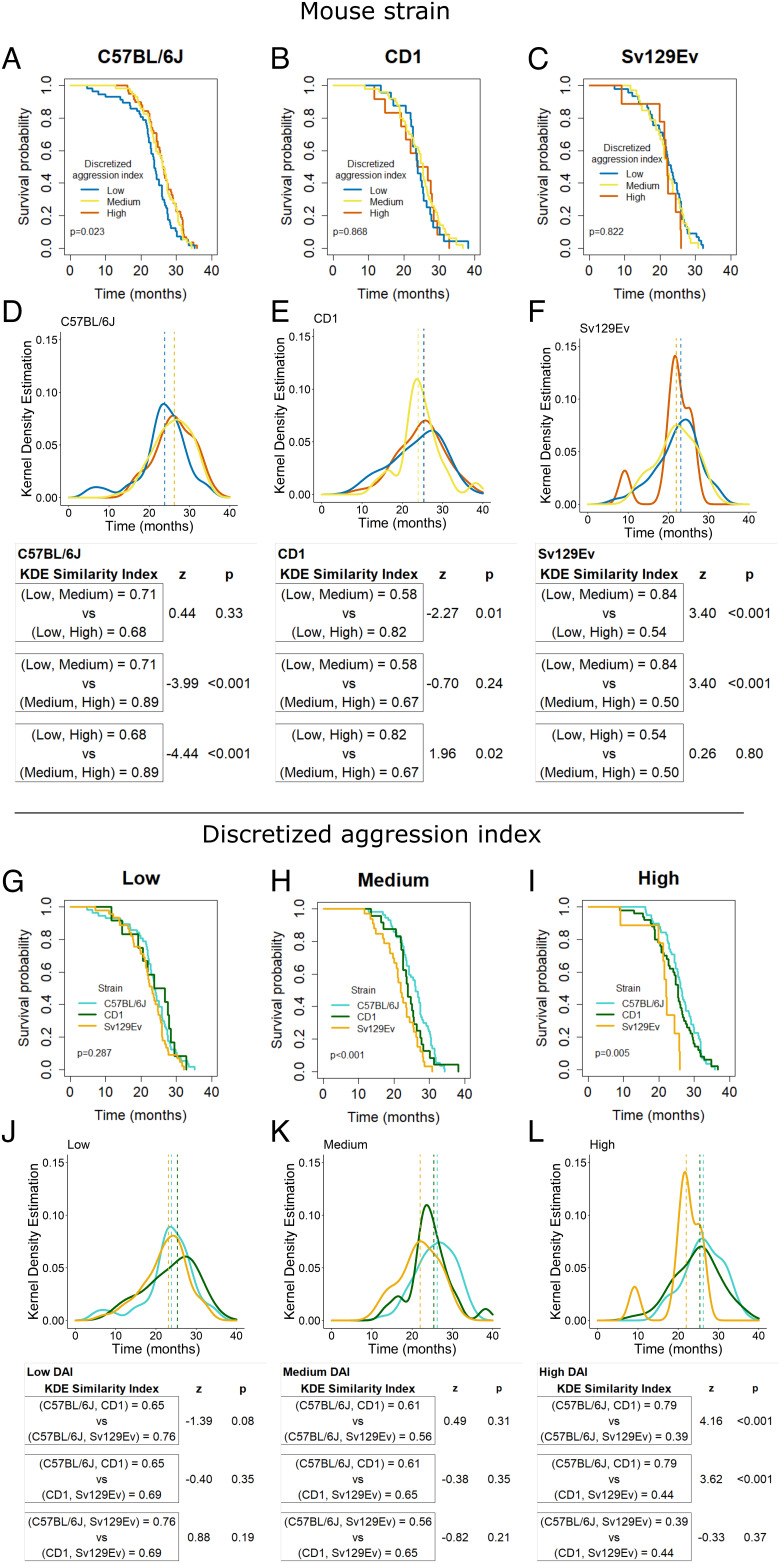
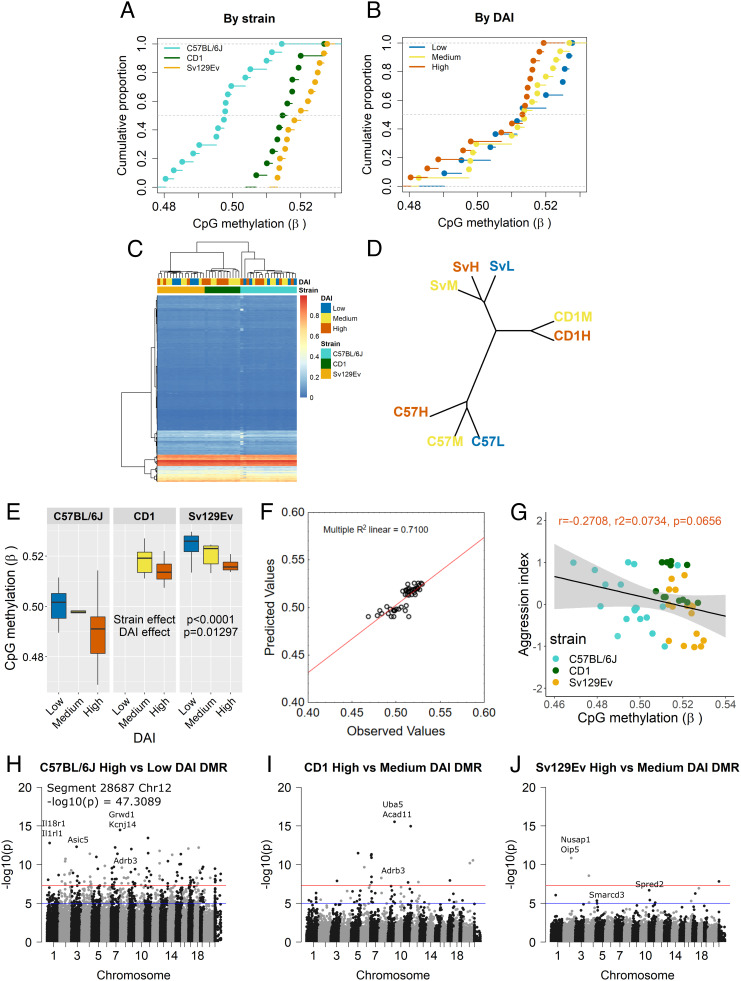
Sustained life stress and low socioeconomic status are among the major causes of aging-related diseases and decreased life expectancy. Experimental rodent models can help to identify the underlying mechanisms, yet very few studies address the long-term consequences of social stress on aging. We conducted a randomized study involving more than 300 male mice of commonly used laboratory strains (C57BL/6J, CD1, and Sv129Ev) chosen for the spontaneous aggression gradient and stress-vulnerability. Mice were exposed to a lifelong chronic psychosocial stress protocol to model social gradients in aging and disease vulnerability. Low social rank, inferred based on a discretized aggression index, was found to negatively impact lifespan in our study population. However, social rank interacted with genetic background in that low-ranking C57BL/6J, high-ranking Sv129Ev, and middle-ranking CD1 mice had lower survival, respectively, implying a cost of maintaining a given social rank that varies across strains. Machine learning linear discriminant analysis identified baseline fat-free mass as the most important predictor of mouse genetic background and social rank in the present dataset. Finally, strain and social rank differences were significantly associated with epigenetic changes, most significantly in Sv129Ev mice and in high-ranking compared to lower ranking subjects. Overall, we identified genetic background and social rank as critical contextual modifiers of aging and lifespan in an ethologically relevant rodent model of social stress, thereby providing a preclinical experimental paradigm to study the impact of social determinants of health disparities and accelerated aging.

Keywords: aging; epigenetic; social determinants of health; social status; strain differences.


Conflict of interest statement

B.H.C. is a full-time employee of FOXO Technologies Inc., which seeks to commercialize epigenetic technologies in the life insurance industry. B.H.C. owns stock in Illumina Inc., the manufacturer of the DNA methylation arrays used in this study. B.H.C. is listed as a co-inventor in filed patents on commercial applications of epigenetic prediction models. The other authors declare no competing interest.

Figures

Fig. 1.
Fig. 1.
Mouse genetic strain affects survival in the LPCS protocol. (A) Survival probability as a function of mouse strain is found to be significantly decreased in Sv129Ev (χ2 = 25.1 with 2 degree of freedom, P < 0.001, d = 0.560; Pairwise comparisons: log-rank test C57BL/6J vs. CD1, ns P > 0.999; C57BL/6J vs. Sv129Ev, P < 0.001; CD1 vs. Sv129Ev, P = 0.009, after Bonferroni adjustment for three comparisons). (B) Age (in months) when mice of the three strains reached respectively 90%, 75%, 50%, 25%, or 10% survivorship within each population (Left); % strain composition of overall surviving population both at median and maximum (10%) survival of the general population (Right). (C) Cox regression model examining the contribution of strain to the hazard of experiencing death (HR, hazard ratio; CI, confidence interval; LRT, likelihood ratio test).
Fig. 2.
Fig. 2.
Aggression index characterization. (A) Strains differed considerably for the level of aggression index with CD1 exhibiting higher levels than C57BL/6J and Sv129Ev; Sv129Ev expressed the lowest level [F(2,342) = 29.221, P < 0.001, ηp2 = 0.105, obs. power = 0.999]. (B) Achieved social status was associated with significantly different aggression index values where dominant mouse had a significantly higher aggression index than subordinate mouse [F(1,231) = 1073, P < 0.001, ηp2 = 0.072, obs. power = 0.997]. (C) 3D scatter plot of aggression index in relationship to initial values of fat and fat-free mass exhibited by mice. (D) Multiple regression scatterplot of observed and predicted aggression index values based on fat and fat-free mass predictors. (EG) Scatterplot of the correlation between fat-free mass and aggression index in each strain. (HJ) Scatterplots of the correlation between fat mass and aggression index in each strain. Data represent group mean ± SEM in A and B. Asterisks represent significant differences from ANOVA with pairwise comparisons tested with Tukey’s honestly significant difference (HSD). In figures E through n, P < 0.05 are noted in red.
Fig. 3.
Fig. 3.
Aggression index and mouse survival. Scatterplot of the correlation between aggression index and age at death for the general population (A), the C57BL/6J (B), CD1 (C), or Sv129Ev (D) strain. (E) Frequency distribution of aggression index with cutoffs identifying low, medium, and high groups. (F) Scatterplot of aggression exhibited and received identifying individuals within each DAI group. (G) Survival probability as a function of DAI is found to be impaired in the low-DAI group (Log-rank χ2 = 8.1 with 2 degrees of freedom, P = 0.020, d = 0.310; Pairwise comparisons for log-rank test low vs. medium, ns; low vs. high, P = 0.015 (significant at Bonferroni adjustment alpha 0.05/3 = 0.017); medium vs. high, ns). (H) Age (in months) when mice of within each of the three DAI categories reached respectively 90%, 75%, 50%, 25%, or 10% survivorship within each population (Left); % DAI composition of overall surviving population both at median and maximum (10%) survival of the general population (Right). (I) Cox regression model examining the contribution of DAI to the hazard of experiencing death (HR, hazard ratio; CI, confidence interval; LRT, likelihood ratio test).
Fig. 4.
Fig. 4.
(AC) Survival probability as a function of DAI category within each of the three strains showing lower survivorship in low C57BL/6J DAI mice (A) (χ2 = 7.72 with 2 degrees of freedom, P = 0.023, d = 0.532), but no effect seen in either CD1 (B) or Sv129Ev mice (C). (DF) distribution of death rates due to DAI smoothed through the KDE for each of the three strains; dashed lines indicate median values for each group and associated similarity index calculated for each of the three strains (see Materials and Methods and Results for details). (Gl) Survival probability as a function of mouse strain within each of the DAI categories showing that within low DAI (50% C57BL/6J, 10.5% CD1, 39.5% Sv129Ev) genetic background has no effect on survival (G), whereas the association with strain is still discernible in both medium (H) (χ2 = 13.6 with 2 degrees of freedom, P < 0.001, d = 0.736; 50% C57BL/6J, 21% cd1, 29% Sv129Ev) and High (I) (χ2 = 10.5 with 2 degrees of freedom, P = 0.005, d = 0.637; 50% C57BL/6J, 43% CD1, 7% Sv129Ev) DAI groups. (JL) Distribution of death rates due to strain smoothed through the KDE for each of the three DAI groups; dashed lines indicate median values for each group and associated similarity indexes calculated for each of the three DAI groups comparing the three strains (see Materials and Methods and Results for details). * denotes significant differences after Bonferroni correction for multiple comparisons across groups (alpha 0.05/3 = 0.017 per test).
Fig. 5.
Fig. 5.
(A and B) Empirical cumulative distribution function of the CpG loci methylation level (expressed as β value) in consideration of either strain (A) or DAI (B) in which horizontal lines represent that the same cumulative probability applies within the same β interval. (C and D) unsupervised cluster analysis of global DNA methylation shows grouping by strain and DAI: (C) Heatmap limited for clarity to 30370 CpG islands. Highlighted are strain and DAI; CpG islands were clustered in an unsupervised manner utilizing Euclidean distance and Ward.D2 clustering method. (D) Phyloepigenetic tree constructed from the methylation level of individual CpG loci, highlighting unsupervised clusters due to strain and to DAI within strain. (E) Tukey box-and-whisker plot of the average level of CpG loci methylation in consideration of the main effect of both strain and DAI. Due to the post hoc sample selection, no samples matched the low-DAI category of the CD1 harvested at 17 mo for the tissue bank. Box plot shows median, upper, and lower quartiles, minimum and maximum values. (F) Multiple regression scatterplot of observed and predicted average global CpG methylation levels based on strain and aggression index predictors. (G) Scatterplot of the correlation between global CpG methylation level and aggression index in the general population. (HJ) Features of DMRs. Each point in the Manhattan plot represents the location of a CpG region (x axis: autosomal chromosomes 1 to 19, chromosome X as 20 and chromosome Y as 21), defined by CpG loci grouped by Euclidean distance, and the association –log10p (y axis) for the effect of DAI within each of the three strains (H) C57BL/6J (segment 28687 was included in the plot not in scale for aesthetical reasons), (I) CD1, and (J) Sv129Ev. The genome-wide significant threshold is set at –log10(5e-08) (red line) and the suggestive line threshold at –log10(1e-05) (blue line).

Similar articles

Cited by

References

    1. Olshansky S. J., From lifespan to healthspan. JAMA – J. Am. Med. Assoc. 320, 1323–1324 (2018). - PubMed
    1. Epel E. S., The geroscience agenda: Toxic stress, hormetic stress, and the rate of aging. Ageing Res. Rev. 63, 101167 (2020). - PMC - PubMed
    1. Kivimäki M., Bartolomucci A., Kawachi I., The multiple roles of life stress in metabolic disorders. Nat. Rev. Endocrinol. 2022, 1–18 (2022). - PMC - PubMed
    1. Snyder-Mackler N., et al. , Social determinants of health and survival in humans and other animals. Science (1979) 368, eaax9553 (2020). - PMC - PubMed
    1. Crimmins E. M., Social hallmarks of aging: Suggestions for geroscience research. Ageing Res. Rev. 63, 101136 (2020). - PMC - PubMed

Publication types