. 2023 Apr 12;15(691):eadd8280.
doi: 10.1126/scitranslmed.add8280. Epub 2023 Apr 12.

Antisense oligonucleotide therapy for H3.3K27M diffuse midline glioma

Affiliations

Antisense oligonucleotide therapy for H3.3K27M diffuse midline glioma

Qian Zhang et al. Sci Transl Med. .

Abstract

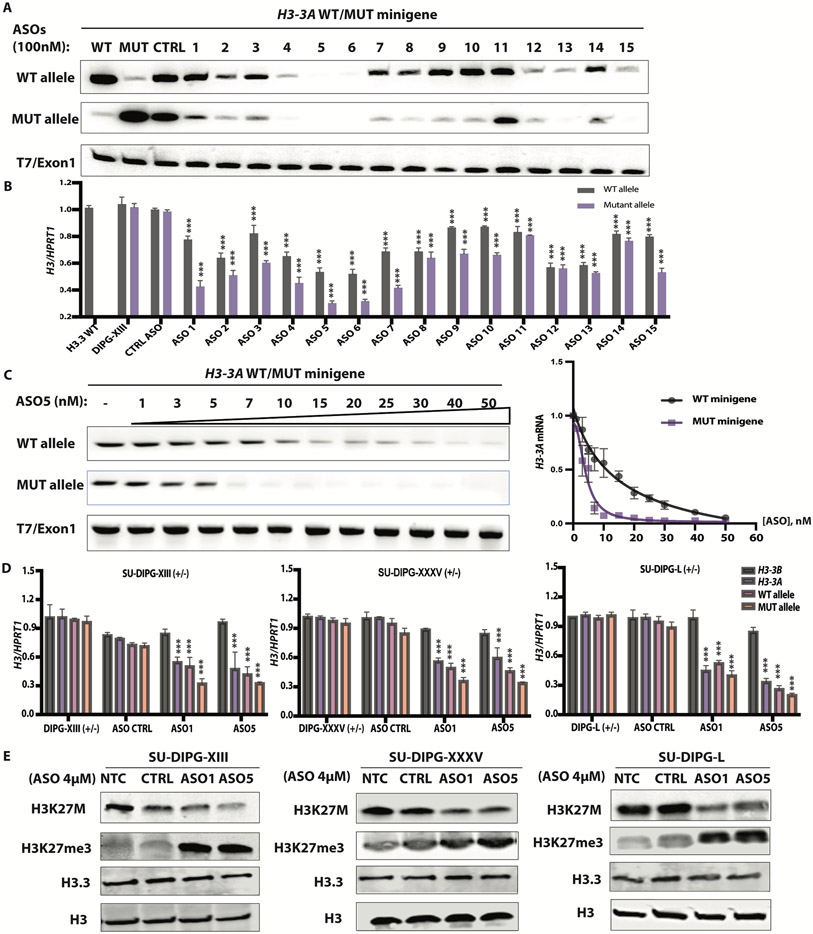
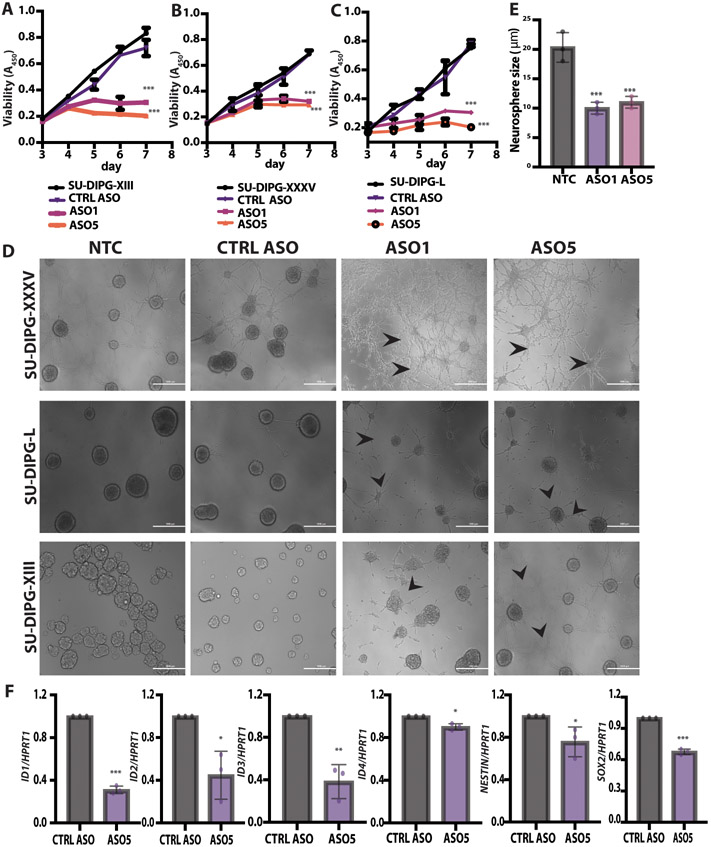
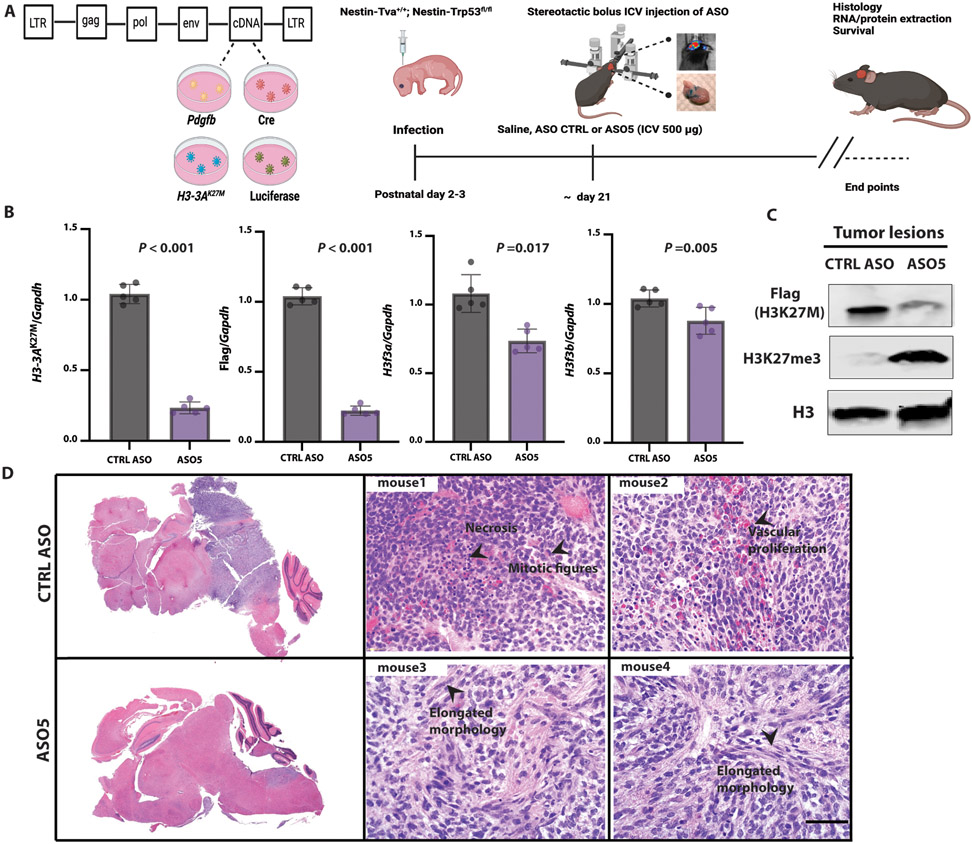
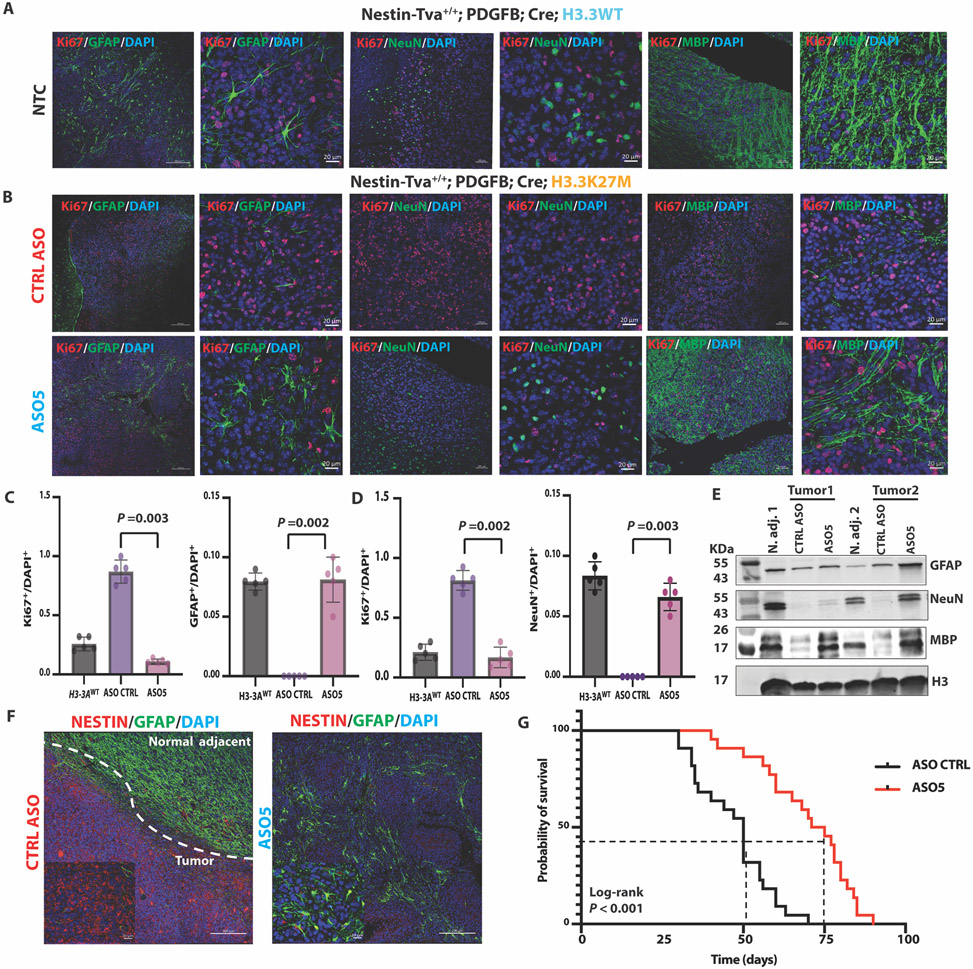
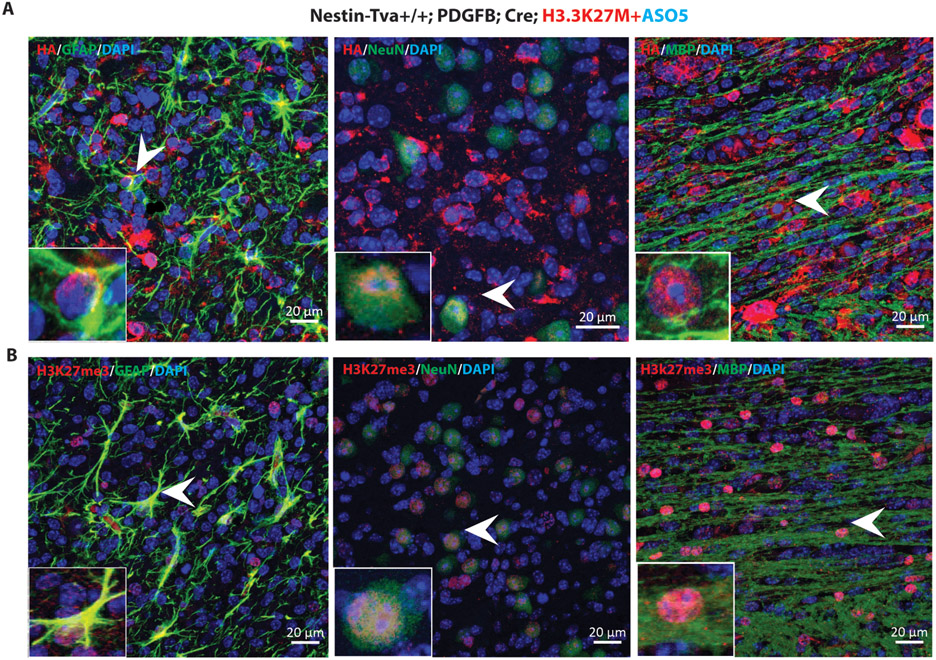
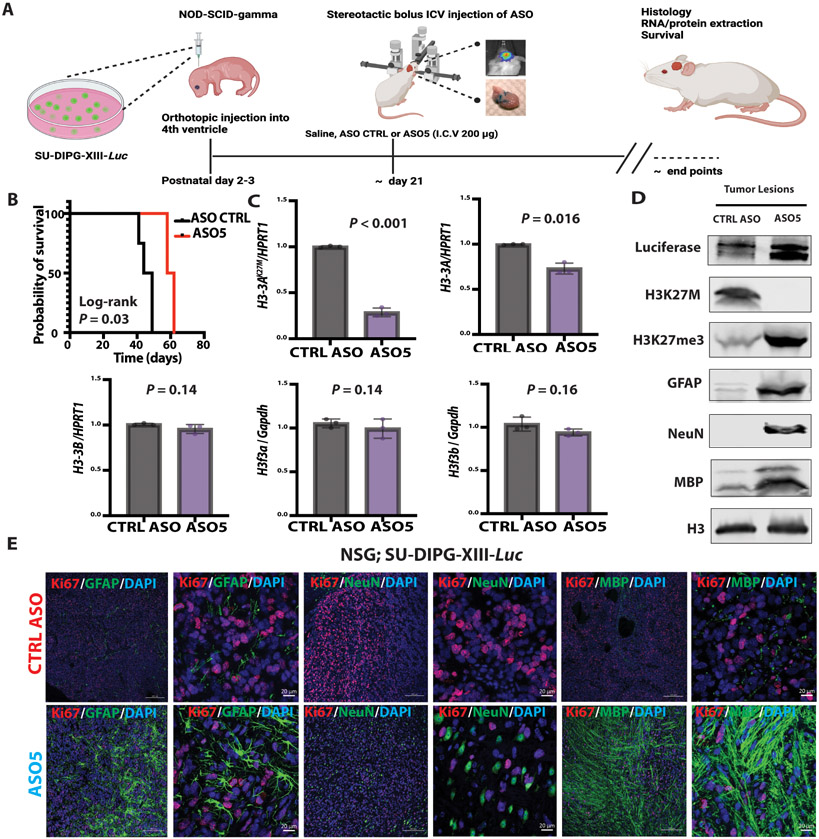
Diffuse midline gliomas (DMGs) are pediatric high-grade brain tumors in the thalamus, midbrain, or pons; the latter subgroup are termed diffuse intrinsic pontine gliomas (DIPG). The brain stem location of these tumors limits the clinical management of DIPG, resulting in poor outcomes for patients. A heterozygous, somatic point mutation in one of two genes coding for the noncanonical histone H3.3 is present in most DIPG tumors. This dominant mutation in the H3-3A gene results in replacement of lysine 27 with methionine (K27M) and causes a global reduction of trimethylation on K27 of all wild-type histone H3 proteins, which is thought to be a driving event in gliomagenesis. In this study, we designed and systematically screened 2'-O-methoxyethyl phosphorothioate antisense oligonucleotides (ASOs) that direct RNase H-mediated knockdown of H3-3A mRNA. We identified a lead ASO that effectively reduced H3-3A mRNA and H3.3K27M protein and restored global H3K27 trimethylation in patient-derived neurospheres. We then tested the lead ASO in two mouse models of DIPG: an immunocompetent mouse model using transduced mutant human H3-3A cDNA and an orthotopic xenograft with patient-derived cells. In both models, ASO treatment restored K27 trimethylation of histone H3 proteins and reduced tumor growth, promoted neural stem cell differentiation into astrocytes, neurons, and oligodendrocytes, and increased survival. These results demonstrate the involvement of the H3.3K27M oncohistone in tumor maintenance, confirm the reversibility of the aberrant epigenetic changes it promotes, and provide preclinical proof of concept for DMG antisense therapy.


Figures

Fig. 1.
Fig. 1.. ASO-mediated H3.3K27M depletion restored global H3K27me3.
(A) ASO screen using H3-3AWT and H3-3AK27M minigenes. HeLa cells were co-transfected with the minigenes, along with individual 20-mer PS-MOE ASOs, using Lipofectamine 2000; two days later, the extent of knockdown was quantified by radioactive RT-PCR with allele-specific primers; band intensities are shown below each band (N = 3); (B) Summary data for ASO screen by free uptake in patient-derived (SU-DIPG-XIII) neurosphere cultures, using RT-qPCR of total RNA extracted after 5 days (n = 3); (C) Dose-response experiment with co-transfected minigenes in HeLa cells, with representative RT-PCR gel on the left, and quantification on the right (N = 3); (D) Decrease of H3-3A mRNA measured by RT-qPCR (n = 3) in three patient-derived cell lines, detected with allele-specific primers to distinguish mutant and wild-type alleles (N = 3); (E) Immunoblot of acid-extracted histones from each patient cell line, with quantification of band intensities shown below each band. For RT-qPCR experiments, Welch’s two-sample t-test was used to compare two groups. For more than two groups, the measurements for each experimental group/treatment were analyzed by ANOVA, followed by pairwise comparisons using Welch’s two-sample t-tests. Family-wise error rate was adjusted using the Bonferroni-Holm method. Data are presented as means ± SEM. WT, wild type; mut, mutant. ***P < 0.0001
Fig. 2.
Fig. 2.. ASO-mediated H3.3K27M depletion delayed neurosphere growth and changed cell morphology.
(A) Shown are cell-viability assays at each time point for the SU-DIPG-XIII H3.3K27M cell line (N = 3); (B) Shown are cell-viability assays at each time point for SU-DIPG-XXXV cell line; (C) Shown are cell-viability assays at each time point for SU-DIPG-L cell line; (D) Representative images of SU-DIPG-XIII, SU-DIPG-XXXV, and SU-DIPG-L patient cells treated with ASO1, ASO5, or control Scramble ASO by free uptake for 5 days. Arrowheads indicate neurite-like processes. Scale bars, 1000 μm; (E) Quantification of average neurosphere size (in μm) from the images in (D) (n = 3 random fields); (F) Real time RT-PCR (n = 3) of genes implicated in developmental processes in ASO-5 treated SU-DIPG-XIII cells, relative to expression of control HPRT1. For viability assays, P-values were adjusted for multiple comparisons by controlling family-wise error rate using the single-step method. For neurosphere size, the measurements for each experimental group/treatment were analyzed by ANOVA, followed by pairwise comparisons using two-sample t-tests. Data are presented as means ± SEM. ***P < 0.001, **P < 0.01, *P < 0.05.
Fig. 3.
Fig. 3.. ICV administration of ASO at the time of tumor onset in the RCAS-Tva mouse model.
(A) Diagram of RCAS plasmids; 105 RCAS-Pdgfb, RCAS-Cre, and RCAS-H3-3AK27M cDNA-expressing producer chicken cells (DF1) were injected into the brainstem of Nestin-Tva; P53fl/fl mice at postnatal day 3 (P3); a single dose (500 μg) of lead ASO or CTRL ASO in saline was stereotactically injected ICV at P21; RNA, protein, and histology samples were collected at the end points when the mice were symptomatic, including an enlarged head, ataxia, or >25% weight loss; (B) Summary data of mRNA expression of H3-3AK27M allele, flag tag, endogenous murine H3f3a and H3f3b as compared to Gapdh (N = 5); (C) Immunoblot of acid-extracted histones from two representative mice; quantification of average band intensities is shown below each band; (D) Representative H&E-stained tumors confirming their location in the midline region of the brain (top left, CTRL ASO-treated; bottom left, ASO5-treated); representative H&E-stained high-grade tumors from control-ASO-treated mice (top, middle and right) and lower-grade tumors with elongated morphology from ASO5-treated mice (bottom, middle and right); scale bar, 500 μm (N = 5). For RT-qPCR experiments, the measurements for each experimental group/treatment were analyzed by Welch’s two-sample t-test to compare the H3-3AK27M expression normalized to the Gapdh loading control between CTRL ASO and ASO5 treatments. Data are presented as means ± SEM.
Fig. 4.
Fig. 4.. ASO-mediated H3.3K27M depletion induced astrocyte, neuron, and oligodendrocyte differentiation, decreased tumor cell proliferation and the NESTIN+ cell population, and extended the latency of tumor growth in the Nestin-Tva mouse model.
(A) Representative IF images of no-treatment control (NTC) tumors stained for markers of differentiation (GFAP, NeuN, MBP; green) or proliferation (Ki67; red), and for nuclei with DAPI (blue) in Nestin-Tva mice transduced with H3-3AWT cDNA; (low-magnification images: scale bar, 200 μm; high-magnification images: scale bar, 20 μm); (B) Representative IF images of tumor sections from control (CTRL) ASO-treated (top panels) and ASO5-treated (bottom panels) mice; IF and DAPI staining, and magnification bars are as in (A); (C) Summary data from (A) and (B) of Ki67+ and GFAP+ cell numbers normalized to DAPI+ nuclei for each treatment group (n = 5 random fields); (D) Same as (C) but for Ki67+ and NeuN+ cells; (E) Immunoblot of differentiation markers (GFAP, NeuN, and MBP) in samples prepared from normal adjacent tissue and tumor lesions for each treatment group of mice; (F) Representative IF images showing NESTIN+ cells (red) and GFAP+ cells (green) in CTRL ASO-treated tumor and normal-adjacent tissue (left) and ASO5-treated tumor lesion (right); DAPI staining shows nuclei (blue); magnification-scale bars are as in (A); (G) Kaplan-Meier survival analysis of mouse cohorts following CTRL ASO treatment (N = 22) or ASO5 treatment (N = 21). Cell counts were analyzed by ANOVA, followed by t-tests for the pairwise comparisons, and data are presented as means ± SEM. Probability of survival was compared using log-rank survival estimate.
Fig. 5.
Fig. 5.. ASO5 treatment promoted differentiation of tumor cells in the RCAS-Tva model.
(A) Representative tumor sections were co-stained with HA-tagged antibody (red for PDGFB and Cre), either GFAP, NeuN, or MBP antibodies (green), and DAPI for nuclei (blue). Arrowheads point to representative cells with co-localization of the green and red signals; (B) Representative tumor sections co-stained with H3K27me3 (red) and either GFAP, NeuN or MBP (green), plus DAPI (blue). Scale bars, 20 μm.
Fig. 6.
Fig. 6.. ICV administration of ASO at the time of tumor onset induced human-specific astrocyte, neuron, and oligodendrocyte differentiation, decreased tumor cell proliferation, and extended the latency of tumor growth in a patient-derived xenograft mouse model.
(A) A single dose (200 μg) of lead ASO or CTRL ASO in saline was stereotactically injected ICV at the time of tumor onset (~day 21) in SU-DIPG-XIII-Luc xenografted mice; (B) Kaplan-Meier survival analysis after CTRL ASO (N = 5) or ASO5 (N = 5) treatment; (C) Summary of data of mRNA expression detected by RT-qPCR (n = 3) of H3-3AK27M allele, total H3-3A, and H3-3B, normalized to HPRT1, and of endogenous murine H3f3a and H3f3b normalized to Gapdh expression (N = 3 mice per group); (D) Immunoblot for histones, transduced luciferase, and differentiation markers (GFAP, NeuN, and MBP) in tissue samples prepared from CTRL ASO-treated or ASO5-treated tumor lesions; (E) Representative IF images showing GFAP+, NeuN+ and MBP+ cells (green) and proliferation by Ki67 staining (red) after CTRL ASO (top row) or ASO5 treatment (bottom row); DAPI staining shows nuclei (blue) (low-magnification images: scale bar, 200 μm; high-magnification images: scale bar, 20 μm). For RT-qPCR experiments, the measurements for each experimental group/treatment were analyzed by Welch’s two-sample t-test, and data are presented as means ± SEM. Probability of survival was compared using log-rank survival estimate.

Comment in

References

    1. Phillips RE, Soshnev AA, Allis CD, Epigenomic reprogramming as a driver of malignant glioma. Cancer Cell 38, 647–660 (2020). - PMC - PubMed
    1. http://www.danafarberbostonchildrens.org/conditions/brain-tumor/diffuse-... .
    1. Lewis PW, Müller MM, Koletsky MS, Cordero F, Lin S, Banaszynski LA, Garcia BA, Muir TW, Becher OJ, Allis CD, Inhibition of PRC2 activity by a gain-of-function H3 mutation found in pediatric glioblastoma. Science 340, 857–861 (2013). - PMC - PubMed
    1. Herz HM, Morgan M, Gao X, Jackson J, Rickels R, Swanson SK, Florens L, Washburn MP, Eissenberg JC, Shilatifard A, Histone H3 lysine-to-methionine mutants as a paradigm to study chromatin signaling. Science 345, 1065–1070 (2014). - PMC - PubMed
    1. Harutyunyan AS, Krug B, Chen H, Papillon-Cavanagh S, Zeinieh M, De Jay N, Deshmukh S, Chen CCL, Belle J, Mikael LG, Marchione DM, Li R, Nikbakht H, Hu B, Cagnone G, Cheung WA, Mohammadnia A, Bechet D, Faury D, McConechy MK, Pathania M, Jain SU, Ellezam B, Weil AG, Montpetit A, Salomoni P, Pastinen T, Lu C, Lewis PW, Garcia BA, Kleinman CL, Jabado N, Majewski J, H3K27M induces defective chromatin spread of PRC2-mediated repressive H3K27me2/me3 and is essential for glioma tumorigenesis. Nat. Commun 10, 1262 (2019) - PMC - PubMed

Publication types