. 2023 Jun 5;155(6):e202213255.
doi: 10.1085/jgp.202213255. Epub 2023 Apr 12.

PI(4,5)P2 regulates the gating of NaV1.4 channels

Affiliations

PI(4,5)P2 regulates the gating of NaV1.4 channels

Kirin D Gada et al. J Gen Physiol. .

Abstract

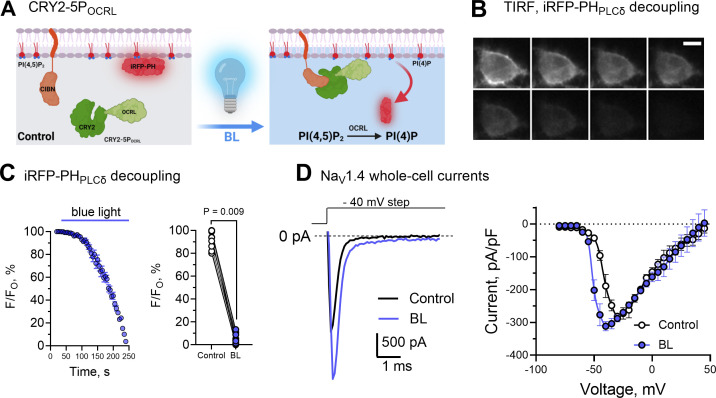
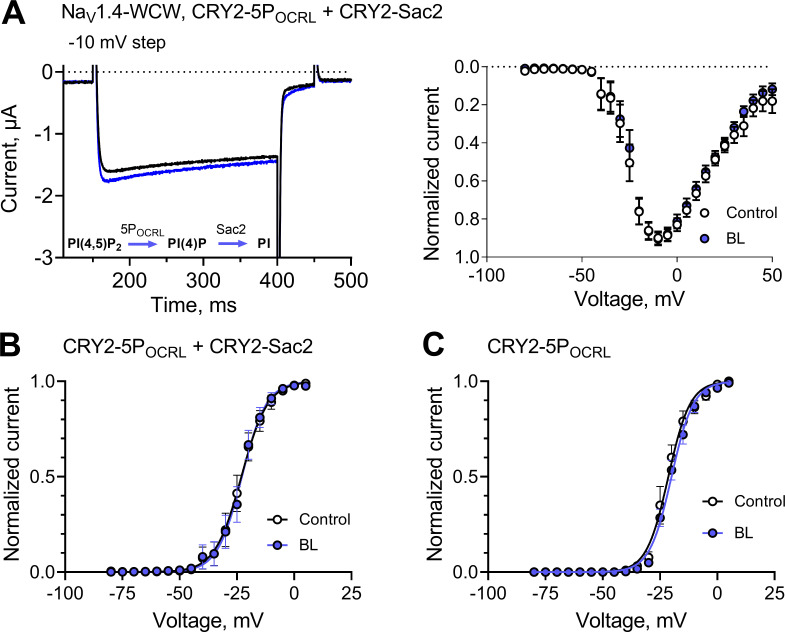
Voltage-gated sodium (NaV) channels are densely expressed in most excitable cells and activate in response to depolarization, causing a rapid influx of Na+ ions that initiates the action potential. The voltage-dependent activation of NaV channels is followed almost instantaneously by fast inactivation, setting the refractory period of excitable tissues. The gating cycle of NaV channels is subject to tight regulation, with perturbations leading to a range of pathophysiological states. The gating properties of most ion channels are regulated by the membrane phospholipid, phosphatidylinositol (4,5) bisphosphate (PI(4,5)P2). However, it is not known whether PI(4,5)P2 modulates the activity of NaV channels. Here, we utilize optogenetics to activate specific, membrane-associated phosphoinositide (PI)-phosphatases that dephosphorylate PI(4,5)P2 while simultaneously recording NaV1.4 channel currents. We show that dephosphorylating PI(4,5)P2 left-shifts the voltage-dependent gating of NaV1.4 to more hyperpolarized membrane potentials, augments the late current that persists after fast inactivation, and speeds the rate at which channels recover from fast inactivation. These effects are opposed by exogenous diC8PI(4,5)P2. We provide evidence that PI(4,5)P2 is a negative regulator that tunes the gating behavior of NaV1.4 channels.


Conflict of interest statement

Disclosures: The authors declare no competing interests exist.

Figures

Figure 1.
Figure 1.
Dephosphorylation of PI(4,5)P2 augments NaV1.4 currents. HEK293T cells were transfected to express CRY2-tagged pseudojanin (CRY2-PJ) and CIBN-CAAX with the PI(4,5)P2 biosensor, iRFP-PHPLCδ for TIRFM imaging or rNaV1.4 and NaVβ1 for whole cell patch clamp studies. CRY2-PJ is the 5-phosphatase inositol polyphosphate 5-phosphatase E (INPP5E) fused to the 4-phosphatase Sac1. TIRF data are mean, normalized fluorescence values ± SEM for 30 membrane-delimited regions of interest identified from eight cells. Patch-clamp data are paired before and after at least 3 min of BL photoactivation for 18 cells per group obtained from three independent biological replicates of the experiment. Statistical significance was determined using a Student’s paired t test. (A) Schematic showing that CRY2-PJ is targeted to the membrane by BL, where it dephosphorylates PI(4,5)P2 to PI(4)P and, subsequently, PI. (B) A montage of TIRF fluorescent micrographs showing decoupling of the PI(4,5)P2 biosensor iRFP-PHPLCδ1 from the membrane in response to photoactivation of CRY2-PJ. The images are every 40 s and the scale bar = 10 µm. (C) Left: A representative time course of normalized iRFP-PHPLCδ fluorescence showing loss of the biosensor from the membrane following BL-activation of CRY2-PJ. Right: Summary data showing that >80% of iRFP-PHPLCδ is decoupled from the membrane after 200 s by BL-activation of CRY2-PJ. (D) Left: Representative traces of NaV1.4 currents evoked by a test pulse to −40 mV, before (black) and after (blue) dephosphorylation of PI(4,5)P2 by CRY2-PJ. Right: Mean I–V relationships for NaV1.4 channels recorded before (black) and after (blue) dephosphorylation of PI(4,5)P2 by CRY2-PJ.
Figure 2.
Figure 2.
PI(4,5)P2 tunes the voltage-dependence of NaV1.4 channels. Whole-cell currents for rNaV1.4 + NaVβ1 were recorded as per Fig. 1 with 200 µM diC8PI(4,5)P2 in the patch pipette where indicated. The voltage dependence of activation (G/Gmax) and SSI (I/Imax) were determined as described in the Materials and methods using fits with Boltzmann functions for data obtained before and at least 3 min after BL activation of CRY2-PJ. The data are for 18 cells per group obtained from three independent biological replicates of the experiment. Statistical significance was determined using a Student’s paired t test. (A) Left: Mean activation (circle) and SSI (square) curves for NaV1.4 before (black) and after BL photoactivation of CRY2-PJ (BL, blue). The window current is inset. Right: Summary of the change in the act and SSI following photoactivation of CRY2-PJ (BL). (B) Left: Mean activation (circle) and SSI (square) curves for NaV1.4 in the presence of 200 µM diC8PI(4,5)P2 before (green) and after BL photoactivation of CRY2-PJ (BL, red). The window current is inset. Right: Summary of the change in the act and SSI following photoactivation of CRY2-PJ (BL). (C) Left: The activation and SSI curves from above to show the full excursion in the activation and SSI curves for cells with high levels of diC8PI(4,5)P2 (green, from B), and fully dephosphorylated endogenous PI(4,5)P2 (blue, from A). The control condition is black, from A. The window current is inset. Right: Unpaired data to show the differences in act and SSI described by the Boltzmann functions.
Figure 3.
Figure 3.
NaV1.4 currents are augmented by CRY2-5POCRL dephosphorylation of PI(4,5)P2. HEK293T cells were transfected to express CRY2-tagged 5-phosphatase OCRL (CRY2-5POCRL), and CIBN-CAAX with the PI(4,5)P2 biosensor, iRFP-PHPLCδ for TIRFM imaging or rNaV1.4 and NaVβ1 for whole cell patch clamp studies. TIRF data are from 30 membrane-delimited regions from eight cells. Patch-clamp data are paired before and after at least 3 min of BL photoactivation for 12 cells per group obtained from three independent biological replicates of the experiment. Statistical significance was determined using a Student’s paired t test. (A) Schematic showing that CRY2-5POCRL is targeted to the membrane by BL where it dephosphorylates PI(4,5)P2 to PI(4)P. (B) A montage of TIRF fluorescent micrographs showing decoupling of the PI(4,5)P2 biosensor iRFP-PHPLCδ1 from the membrane following photoactivation of CRY2-5POCRL. The images are every 40 s; scale bar = 10 µm. (C) Left: A representative time course of normalized iRFP-PHPLCδ fluorescence showing the decrease in membrane association of the biosensor following BL activation of CRY2-5POCRL. Right: Summary data showing that >80% of iRFP-PHPLCδ is decoupled from the membrane 200 s after BL activation of CRY2-5POCRL. (D) Left: Representative traces of NaV1.4 currents evoked by a test pulse to −40 mV, before (black) and after (blue) dephosphorylation of PI(4,5)P2 by CRY2-5POCRL. Right: Mean I–V relationships for NaV1.4 channels recorded before (black) and after (blue) dephosphorylation of PI(4,5)P2 by CRY2-5POCRL.
Figure 4.
Figure 4.
5-dephosphorylation of PI(4,5)P2 tunes the voltage-dependence of NaV1.4 channels. Whole-cell currents for rNaV1.4 + NaVβ1 were recorded as per Fig. 3 with 200 µM diC8PI(4,5)P2 in the patch pipette where indicated. The voltage-dependence of activation (G/Gmax) and SSI (I/Imax) were determined as described in the Materials and methods using fits with Boltzmann functions for data obtained before and at least 3 min after activation of CRY2-5POCRL by BL. The data are from 12 cells per group obtained from three independent biological replicates of the experiment. Statistical significance was determined using a Student’s paired t test. (A) Left: Mean activation (circle) and SSI (square) curves for NaV1.4 before (black) and after BL photoactivation of CRY2-5POCRL (BL, blue). The window current is inset. Right: Summary of the change in the act and SSI following photoactivation of CRY2-5POCRL (BL). (B) Left: Mean activation (circle) and SSI (square) curves for NaV1.4 in the presence of 200 µM diC8PI(4,5)P2 before (green), and after BL photoactivation of CRY2-5POCRL (BL, red). The window current is inset. Right: Summary of the change in the act and SSI following photoactivation of CRY2-5POCRL (BL). (C) Left: The activation and SSI curves from above to show the full excursion in the activation and SSI curves for cells with high levels of diC8PI(4,5)P2 (green, from B), and fully dephosphorylated endogenous PI(4,5)P2 (blue, from A). The control condition is black, from A. The window current is inset. Right: Unpaired data to show the differences in act and SSI described by the Boltzmann functions.
Figure 5.
Figure 5.
Dephosphorylating PI(4,5)P2 speeds the recovery of NaV1.4 channels from fast inactivation. (A–D) Recovery from fast inactivation at −30 mV in HEK293T cells transfected with rNaV1.4, NaVβ1, CIBN-CAAX, and CRY2-PJ (A and B) or CRY2-5POCRL (C and D) were tested in whole-cell patch clamp experiments according to the protocol described in the Material and methods. Normalized data are fit with an exponential function to get the time-constant, τ. The data are paired before and after at least 3 min of BL photoactivation for eight cells per group obtained from two independent biological replicates of the experiment. Statistical significance was determined using a Student’s paired t test. (A) Left: Time course of recovery from fast inactivation in response to a paired-pulse protocol before (black) and after activation of CRY2-PJ with BL. Right: Paired τ values. (B) Left: Photoactivation of CRY2-PJ (red) did not speed τ when 200 µM diC8PI(4,5)P2 was included in the patch-pipette (green). (C) Left: τ was also speeded following activation of CRY2-5POCRL with BL. Right: Paired τ values. (D) Left: Photoactivation of CRY2-5POCRL (red) did not speed τ when 200 µM diC8PI(4,5)P2 was included in the patch-pipette (green).
Figure 6.
Figure 6.
Dephosphorylating PI(4,5)P2 augments the late sodium current. (A–E) HEK293T cells transfected with rNaV1.4, NaVβ1, CIBN-CAAX, and CRY2-PJ (A–C) or CRY2-5POCRL (D and E) were studied by a 400 ms pulse to −20 mV before and at least 3 min after illumination with BL. ILATE is expressed as a percent of IPEAK. The time course for fast inactivation is determined by an exponential fit and is expressed as τ. The data are for 10–15 cells per group obtained from three independent biological replicates of the experiment. Statistical significance was determined using a Student’s paired t test. (A) Representative late current traces before (black) and after BL activation of CRY2-PJ (blue). The scale bars are 50 pA (vertical) and 50 ms (horizontal). Inset: A zoomed-in view of the late current. (B) ILATE is increased eightfold by BL activation of CRY2-PJ (blue); the effect is precluded when 200 μM diC8PI(4,5)P2 is included in the patch pipette. (C) τ is slowed by activation of CRY2-PJ (blue) in control cells but does not change with 200 μM diC8PI(4,5)P2 in the patch pipette. (D) ILATE increases eightfold following BL activation of CRY2-5POCRL (blue) in control cells but not when 200 μM diC8PI(4,5)P2 (green) is included in the patch pipette. (E) τ is slowed by activation of CRY2-5POCRL (blue) in control cells but does not change with 200 μM diC8PI(4,5)P2 in the patch pipette.
Figure 7.
Figure 7.
PI(4,5)P2-dependent tuning of V½-activation requires the fast inactivation process. Xenopus oocytes were injected with cRNA for NaV1.4-WCW, NaVβ1, CIBN-CAAX, and the CRY2-fused phosphatases indicated and studied 48 h later by two-electrode voltage clamp experiments. Currents were evoked by a step protocol before (black), and 3 min after sustained photoactivation with BL (blue). The voltage-dependence of activation was determined as described in the Materials and methods using fits with Boltzmann functions. Data are mean whole-oocyte currents ± SEM for 15–18 cells per condition obtained from three independent biological replicates of the experiment. (A) Left: Representative traces evoked by a step to −10 mV from oocytes expressing CRY2-5POCRL and CRY2-Sac2 before (black) and after (blue) photoactivation. Right: A normalized I–V relationship for the same experiment. (B) Normalized G–V relationships for data in A show no change act before (−23 ± 4 mV) and after (−23 ± 3 mV) BL. (C) Normalized G–V relationships for oocytes expressing CRY2-5POCRL show no change act before (−22 ± 5 mV) and after (−21 ± 5 mV) BL.

Comment in

References

    1. Aldrich, R.W., Corey D.P., and Stevens C.F.. 1983. A reinterpretation of mammalian sodium channel gating based on single channel recording. Nature. 306:436–441. 10.1038/306436a0 - DOI - PubMed
    1. Aldrich, R.W., and Stevens C.F.. 1983. Inactivation of open and closed sodium channels determined separately. Cold Spring Harb. Symp. Quant. Biol. 48:147–153. 10.1101/SQB.1983.048.01.017 - DOI - PubMed
    1. Alexander, S.P.H., Mathie A., Peters J.A., Veale E.L., Striessnig J., Kelly E., Armstrong J.F., Faccenda E., Harding S.D., Pawson A.J., et al. . 2019. The concise guide to pharmacology 2019/20: Ion channels. Br. J. Pharmacol. 176:S142–S228. 10.1111/bph.14749 - DOI - PMC - PubMed
    1. Balla, T. 2013. Phosphoinositides: Tiny lipids with giant impact on cell regulation. Physiol. Rev. 93:1019–1137. 10.1152/physrev.00028.2012 - DOI - PMC - PubMed
    1. Cannon, S.C. 2015. Channelopathies of skeletal muscle excitability. Compr. Physiol. 5:761–790. 10.1002/cphy.c140062 - DOI - PMC - PubMed

Publication types

MeSH terms