. 2023 Apr 14;9(15):eade3422.
doi: 10.1126/sciadv.ade3422. Epub 2023 Apr 12.

Targeting BRD3 eradicates nuclear TYRO3-induced colorectal cancer metastasis

Affiliations

Targeting BRD3 eradicates nuclear TYRO3-induced colorectal cancer metastasis

Pei-Ling Hsu et al. Sci Adv. .

Erratum in

Abstract

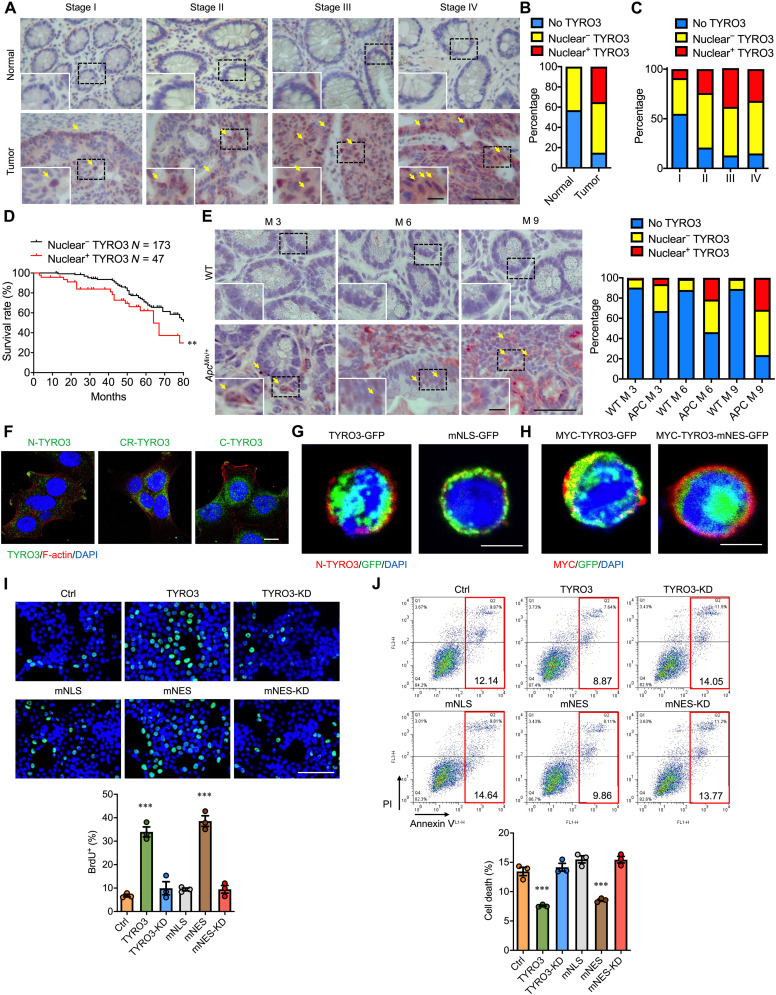
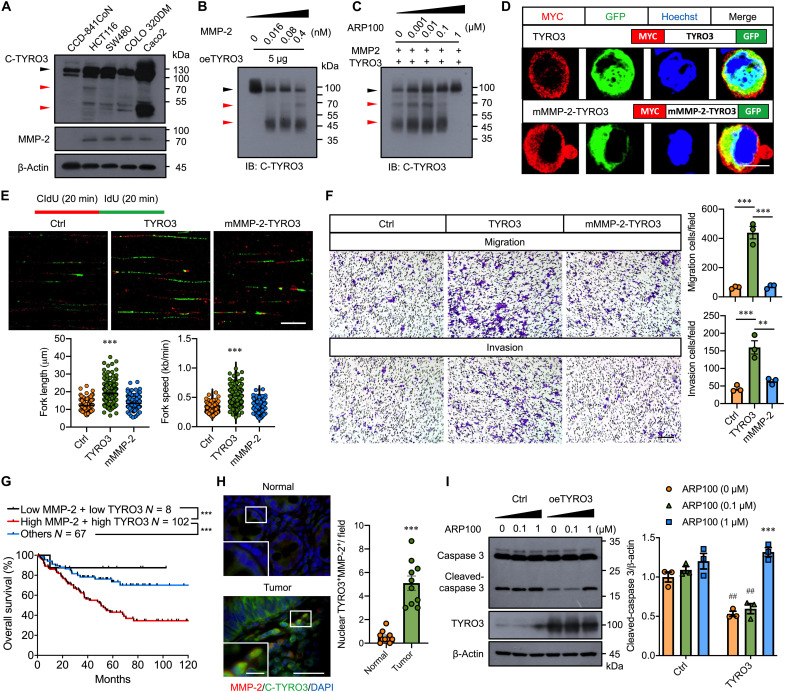
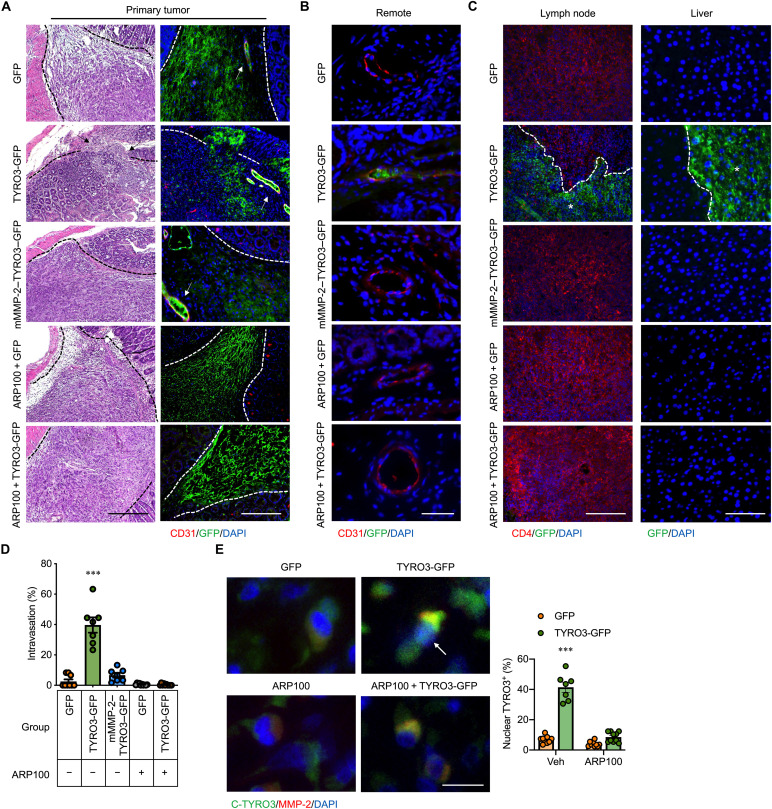
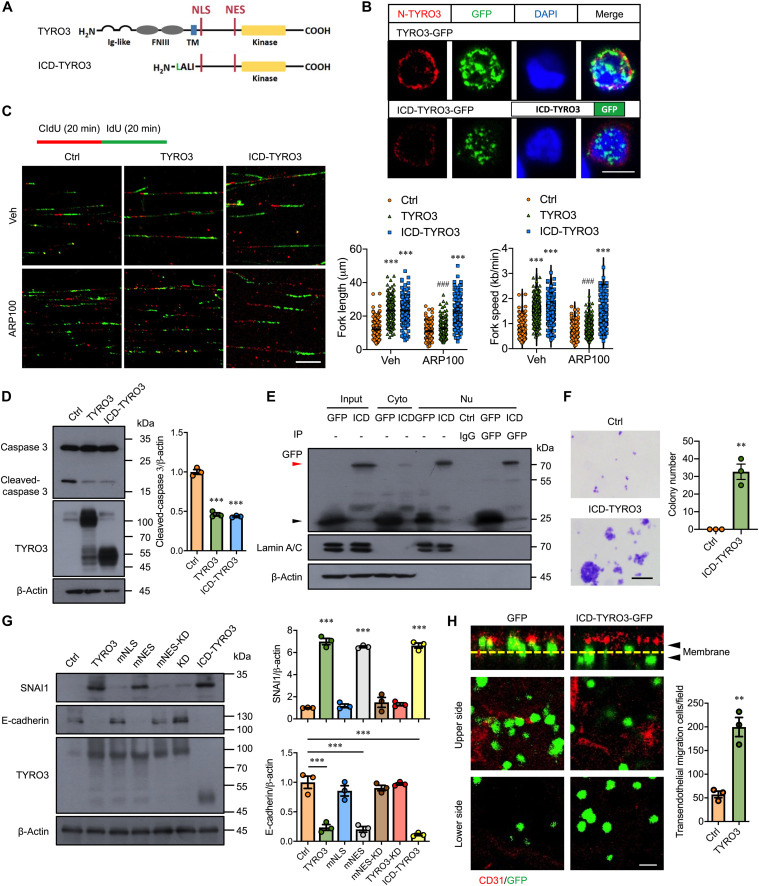
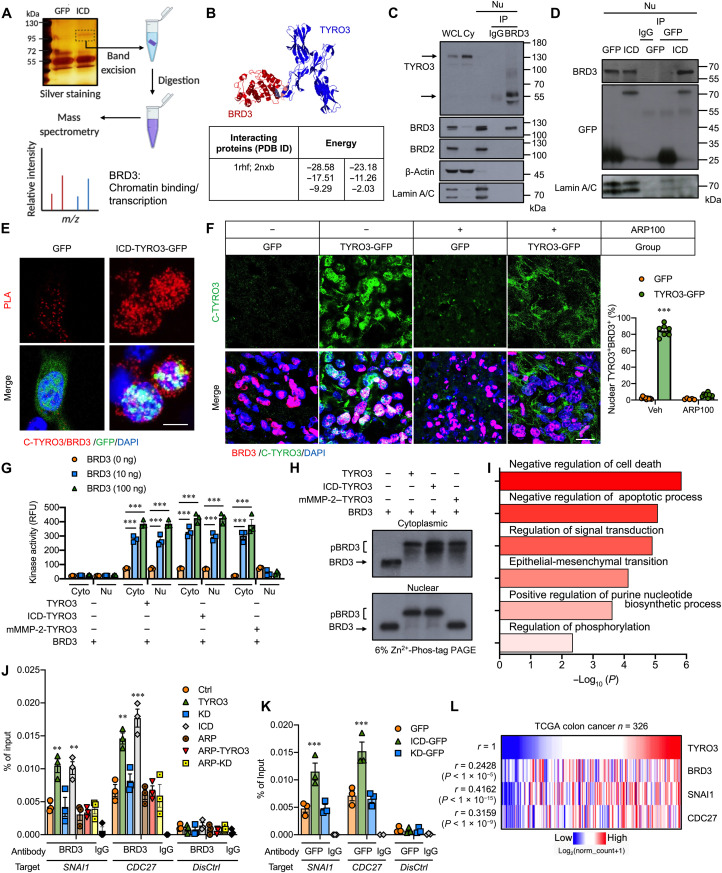
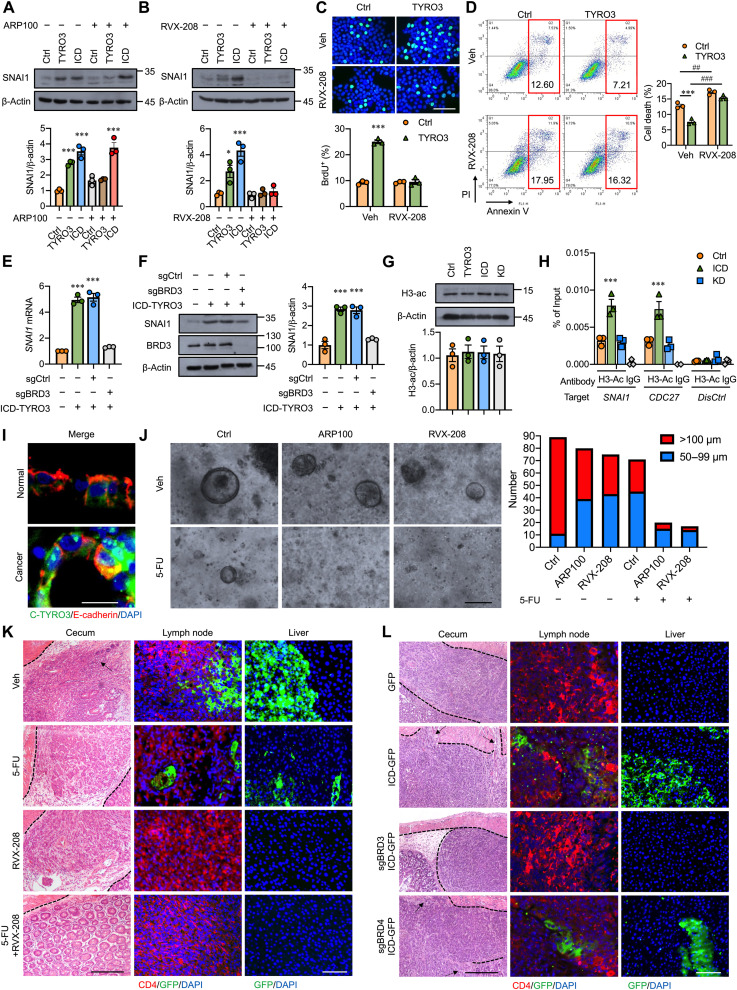
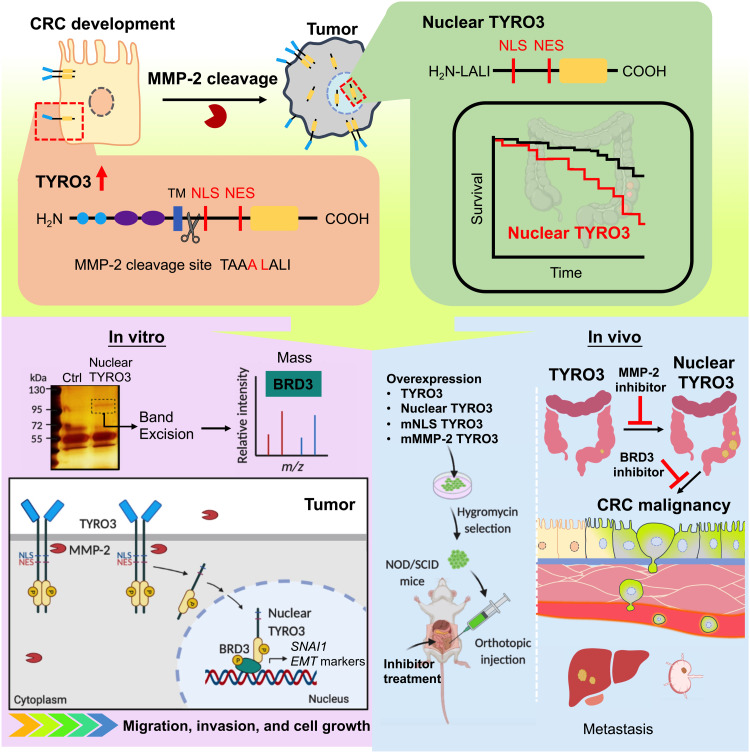
Metastasis is the main cause of death in many cancers including colorectal cancer (CRC); however, the underlying mechanisms responsible for metastatic progression remain largely unknown. We found that nuclear TYRO3 receptor tyrosine kinase is a strong predictor of poor overall survival in patients with CRC. The metastasis-promoting function of nuclear TYRO3 requires its kinase activity and matrix metalloproteinase-2 (MMP-2)-mediated cleavage but is independent of ligand binding. Using proteomic analysis, we identified bromodomain-containing protein 3 (BRD3), an acetyl-lysine reading epigenetic regulator, as one of nuclear TYRO3's substrates. Chromatin immunoprecipitation-sequencing data reveal that TYRO3-phosphorylated BRD3 regulates genes involved in anti-apoptosis and epithelial-mesenchymal transition. Inhibition of MMP-2 or BRD3 activity by selective inhibitors abrogates nuclear TYRO3-induced drug resistance and metastasis in organoid culture and in orthotopic mouse models. These data demonstrate that MMP-2/TYRO3/BRD3 axis promotes the metastasis of CRC, and blocking this signaling cascade is a promising approach to ameliorate CRC malignancy.


Figures

Fig. 1.
Fig. 1.. Nuclear TYRO3 expression correlates with malignancy of CRC and promotes procancerous functions.
(A) Tissue sections from paired normal and CRC were subjected to IHC staining of TYRO3 (red). Arrows indicate TYRO3+ in nucleus. Scale bar, 50 μm. Inset scale bar, 10 μm. (B) Accumulated percentage of TYRO3 staining in normal and cancer tissues. (C) Accumulated percentage of TYRO3 subcellular localization in different stages of cancer (stage I = 11, stage II = 29, stage III = 191, stage IV = 34). (D) Kaplan-Meier plot of survival rates in CRC patients with nuclear TYRO3 negative (n = 173) and nuclear TYRO3 positive (n = 47). (E) Colon tissue sections collected from wild-type (WT) and ApcMin/+ mice (n = 6 mice per group) were processed for TYRO3 IHC staining (red). Scale bar, 50 μm. Inset scale bar, 10 μm. Quantitative data are shown. Arrows indicate TYRO3+ in nucleus. (F) Subcellular distribution of TYRO3 was detected by immunofluorescence (IF) staining (N-TYRO3, anti–N-terminal TYRO3; CR-TYRO3, anti-central region TYRO3; C-TYRO3, anti–C-terminal TYRO3). Scale bar, 10 μm. (G) IF staining images showed location of N-terminal TYRO3 (red) and C-terminal TYRO3 (GFP) in HCT116 cells. Scale bar, 10 μm. (H) Images showed locations of N terminus (red, MYC) and C terminus (GFP) of TYRO3. Scale bar, 10 μm. (I) Representative images (top) and quantified result (bottom) of bromodeoxyuridine (BrdU) incorporation assay. Scale bar, 100 μm. (J) The percentages of cell death were analyzed from both annexin V–fluorescein isothiocyanate (FITC+)/propidium iodide (PI) and annexin V-FITC+/PI+ by flow cytometry (n = 3). **P < 0.01 and ***P < 0.001.
Fig. 2.
Fig. 2.. MMP-2 cleaves TYRO3 to promote nuclear translocation and cancer progression.
(A) Representative Western blots showed the expression of C-TYRO3, MMP-2, and β-actin in normal colon cell line (CCD-841CoN) and CRC cell lines. (B) Representative Western blots of TYRO3 in lysates of TYRO3-overexpressed HCT116 cells incubated with different amounts of recombinant MMP-2. Black arrowhead, full-length TYRO3; red arrowhead, cleaved TYRO3. (C) Representative Western blots showed TYRO3 in lysates and MMP-2 (0.4 nM) incubated with different amounts of MMP-2 inhibitor, APR100. Black arrowhead, full-length TYRO3; red arrowhead, cleaved TYRO3. IB, immunoblot. (D) Confocal images showed subcellular location of N-terminal TYRO3 (red) and C-terminal TYRO3 (GFP). Scale bar, 10 μm. (E) Representative images showed DNA fibers and quantification of replication forks (n = 150). Scale bar, 10 μm. (F) Transwell migration and invasion assays were performed after transfection. Representative images and quantification are shown. Scale bar, 200 μm. (G) The impact of MMP-2 and TYRO3 expression on overall survival (177 patients with CRC) in GSE17536 cohort (downloaded from Gene Expression Omnibus data). (H) Representative images and quantified show results of tissue sections from normal and tumor (n = 10) immunostained for MMP-2 (red) and C-TYRO3 (green). Scale bar, 200 μm. Inset scale bar, 50 μm. (I) Representative Western blots and quantified data showed the levels of caspase 3, TYRO3, and β-actin in HCT116 cells transfected with the indicated plasmids. Asterisks indicate statistical differences in intragroup comparison, and pound signs indicate statistical differences in intergroup comparison. ** and ##P < 0.01, ***P < 0.001.
Fig. 3.
Fig. 3.. TYRO3 promotes CRC metastasis through MMP-2–dependent nuclear translocation.
HCT116 cells stably express different constructs were injected into the cecal wall of NOD/SCID mice. ARP100 (5 mg/kg per day) or vehicle control (dimethyl sulfoxide) was delivered through osmotic pumps immediately after orthotopic injection for 1 month. (A) The representative pictures show the lesion in the cecum after 1 month by hematoxylin and eosin and IF staining (GFP, n = 9; TYRO3-GFP, n = 7; mMMP-2–GFP, n = 7; ARP100 + GFP, n = 10; ARP100 + TYRO3-GFP, n = 10). Arrows indicate the invasive cancer (left). Scale bar, 100 μm. Dashed lines delineate the boundaries segregating cancer and normal tissues. Arrows indicate cancer cells in the lumen of blood vessels (right). (B) Remote area (over 100 μm away from tumor) sections were stained with anti-GFP antibody (green) for cancer cells, anti-CD31 antibody (red) for endothelial cells, and DAPI for nucleus. Scale bar, 100 μm. (C) Lymph nodes were stained with anti-GFP antibody (green) for cancer cells, anti-CD4 antibody (red) for lymphocytes, and DAPI for nucleus. Scale bar, 100 μm. Liver tissue sections were stained with anti-GFP antibody (green) and counterstained with DAPI. Scale bar, 50 μm. Dashed lines delineate the boundaries segregating cancer and normal tissues. White stars indicate the cancers. (D) Percentage of mice with intravasated cancer cells at remote area. (E) Representative pictures show orthotopic tumor tissue sections stained with anti–C-TYRO3 antibody (green), anti–MMP-2 antibody (red), and DAPI (left). Arrow indicates the nuclear translocation of TYRO3. Scale bar, 10 μm. Right shows the percentage of mice with nuclear TYRO3 cancer cells. ***P < 0.001.
Fig. 4.
Fig. 4.. ICD-TYRO3 promotes normal colon cell transformation and CRC malignancy.
(A) Schematic drawing shows the sequence of TYRO3 and ICD-TYRO3. The ICD-TYRO3 starts from the MMP-2 cleavage site. Ig, immunoglobulin; TM, transmembrane domain. (B) Representative confocal images showed anti-N terminus of TYRO3 (red) and GFP signal detection in HCT116 cells after transfection. Scale bar, 10 μm. (C) Lengths and speed of nascent replication tracts labeled with CldU (red) and IdU (green) were measured (n = 150) after treatment. Scale bar, 10 μm. Asterisks indicate statistical differences in intragroup comparison and pound signs indicate statistical differences in intergroup comparison. (D) Representative Western blots and quantified data showed the levels of caspase 3, TYRO3, and β-actin in HCT116 cells transfected with the indicated plasmids. (E) Representative Western blots showed the expression of ICD-TYRO3 (ICD) in the nucleus of CCD-841CoN cells after transfection. Cyto, cytosolic fraction; Nu, nuclear fraction; Ctrl, control IgG; red arrowhead, ICD-TYRO3-GFP; black arrowhead, GFP. (F) Colony formation assay was performed for 21 days after transfection of CCD-841CoN with control (Ctrl) or ICD-TYRO3 plasmid. Left, representative images; right, quantification analysis. Scale bar, 100 μm. (G) Representative Western blots and quantified data showed the levels of SNAI1, E-cadherin, TYRO3, and β-actin in HCT116 cells transfected with the indicated plasmids. (H) Representative confocal images and quantified data showed the HCT116 transendothelial migration. CD31, endothelial cells (red); Yellow dashed lines, transwell filters; arrowheads, top and bottom sides of the filters. Scale bar, 10 μm. **P < 0.01; ### and ***P < 0.001.
Fig. 5.
Fig. 5.. Nuclear TYRO3 phosphorylates BRD3 to promote CRC malignancy.
(A) Schematic drawing shows the flow chart of identifying BRD3 as ICD-TYRO3 nuclear partner by mass spectrometry from CCD-841CoN cells. (B) The interaction between TYRO3 (1rhf) and BRD3 (2nxb) and binding energies predicted by Structural Matching software. (C and D) Representative Western blots show the binding of endogenous TYRO3 and BRD3 in the nucleus of HCT116 cells (C) and ICD-TYRO3 and BRD3 in CCD-841CoN cells transiently transfected with GFP or ICD-TYRO3-GFP (D). Lamin A/C, loading control; WCL, whole cell lysate; Cy, cytosolic fraction; Nu, nuclear fraction; IgG, control. (E) Representative images show the binding of TYRO3 and BRD3 by in situ PLA. Scale bar, 5 μm. (F) Representative images and quantified data of nuclear TYRO3+/BRD3+ cells in orthotopic colon cancers (GFP, n = 9; TYRO3-GFP, n = 7; ARP100 + GFP, n = 10; ARP100 + TYRO3-GFP, n = 10). Scale bar, 10 μm. (G) The kinase activity of TYRO3 in phosphorylating BRD3. RFU, relative fluorescence units. (H) Representative Western blots show phosphorylated BRD3 (pBRD3) and unphosphorylated BRD3. The proteins were separated by 6% Zn2+-Phos-tag SDS–polyacrylamide gel electrophoresis (PAGE). (I) Biological processes associated with genes bound by BRD3 in nuclear TYRO3-overexpressing cells. (J) Results of ChIP-qPCR show the occupancies of BRD3 at the promoters of targeted genes. Distal primers were used as a quality control. (K) Results of ChIP-qPCR show the occupancies of TYRO3 at the promoters of SNAI1 and CDC27. Lysates from HCT-116 cells stably transfected with different constructs were immunoprecipitated using anti-GFP antibody and subjected for PCR amplification. (L) Heatmap shows the correlation of TYRO3 level with BRD3, SNAI1, and CDC27 by analyzing TCGA colon cancer dataset. **P < 0.01 and ***P < 0.001. m/z, mass/charge ratio.
Fig. 6.
Fig. 6.. Inhibition of BRD3 eradicates TYRO3-induced CRC metastasis in mice.
(A) Representative Western blots and quantified result show SNAI1 in cells transfected with indicated plasmids in the presence (+) or absence (−) of MMP-2 inhibitor, ARP100 (1 μM). (B) Representative Western blots and quantified result show the levels of SNAI1 in HCT116 cells treated with (+) or without (−) BRD3 inhibitor, RVX-208 (10 μM). (C and D) Representative images and quantified results show BrdU+ (C) and annexin V+/PI+ (D) cells treated with or without BRD3 inhibitor. Scale bar, 50 μm. (E) Real-time reverse transcription–qRCR shows the expression of SNAI1. (F) Representative Western blot and quantified result show SNAI1 in ICD-TYRO3–overexpressed HCT116 cells with or without BRD3 knockout. (G) Representative Western blot and quantified result show global acetylation of histone H3 in HCT116 cells. (H) Potential target genes of BRD3 were analyzed by ChIP-qPCR. (I) Representative images show location of C-TYRO3, E-cadherin, and DAPI in colon organoids. Scale bar, 10 μm. (J) Representative images and quantified result of organoids (n = 3, 30 organoids per subject) treated with or without inhibitors were shown. Scale bar, 100 μm. (K) Representative images show local invasion and metastasis of cancer cells with or without different drug treatments. Arrows indicate the invasive cancer. Scale bar: 100 μm (left column); 50 μm (middle and right columns). (L) Representative images show local invasion and metastasis of cancer cells with or without BRD3 (sgBRD3) or BRD4 (sgBRD4) knockout. Arrows indicate the invasive cancer. Scale bars, 100 μm (left) and 50 μm (right). *P < 0.05, ##P < 0.01, ### and ***P < 0.001.
Fig. 7.
Fig. 7.. Model of nuclear TYRO3 contributing to CRC malignancy.
We identified that MMP-2 releases ICD-TYRO3 to reduce survival rate and promote CRC migration, invasion, and cell growth through BRD3. TYRO3-induced CRC progression and metastasis are reversed by MMP-2 selective inhibitor in orthotopic mouse models.

Similar articles

Cited by

References

    1. Erreni M., Mantovani A., Allavena P., Tumor-associated macrophages (TAM) and inflammation in colorectal cancer. Cancer Microenviron. 4, 141–154 (2011). - PMC - PubMed
    1. Huth E. J., Case K., Annals of internal medicine at age 75: Reflections on the past 25 years. Ann. Intern. Med. 137, 34–45 (2002). - PubMed
    1. Fearon E. R., Vogelstein B., A genetic model for colorectal tumorigenesis. Cell 61, 759–767 (1990). - PubMed
    1. Lin S. C., Chien C. W., Lee J. C., Yeh Y. C., Hsu K. F., Lai Y. Y., Lin S. C., Tsai S. J., Suppression of dual-specificity phosphatase-2 by hypoxia increases chemoresistance and malignancy in human cancer cells. J. Clin. Invest. 121, 1905–1916 (2011). - PMC - PubMed
    1. Zhang X., Li C. F., Zhang L., Wu C. Y., Han L., Jin G., Rezaeian A. H., Han F., Liu C., Xu C., Xu X., Huang C. Y., Tsai F. J., Tsai C. H., Watabe K., Lin H. K., TRAF6 restricts p53 mitochondrial translocation, apoptosis, and tumor suppression. Mol. Cell 64, 803–814 (2016). - PMC - PubMed