Multicenter Study
. 2023 Apr 27;388(17):1559-1571.
doi: 10.1056/NEJMoa2209046. Epub 2023 Apr 12.

Genomic Diagnosis of Rare Pediatric Disease in the United Kingdom and Ireland

Collaborators, Affiliations
Multicenter Study

Genomic Diagnosis of Rare Pediatric Disease in the United Kingdom and Ireland

Caroline F Wright et al. N Engl J Med. .

Abstract

Background: Pediatric disorders include a range of highly penetrant, genetically heterogeneous conditions amenable to genomewide diagnostic approaches. Finding a molecular diagnosis is challenging but can have profound lifelong benefits.

Methods: We conducted a large-scale sequencing study involving more than 13,500 families with probands with severe, probably monogenic, difficult-to-diagnose developmental disorders from 24 regional genetics services in the United Kingdom and Ireland. Standardized phenotypic data were collected, and exome sequencing and microarray analyses were performed to investigate novel genetic causes. We developed an iterative variant analysis pipeline and reported candidate variants to clinical teams for validation and diagnostic interpretation to inform communication with families. Multiple regression analyses were performed to evaluate factors affecting the probability of diagnosis.

Results: A total of 13,449 probands were included in the analyses. On average, we reported 1.0 candidate variant per parent-offspring trio and 2.5 variants per singleton proband. Using clinical and computational approaches to variant classification, we made a diagnosis in approximately 41% of probands (5502 of 13,449). Of 3599 probands in trios who received a diagnosis by clinical assertion, approximately 76% had a pathogenic de novo variant. Another 22% of probands (2997 of 13,449) had variants of uncertain significance in genes that were strongly linked to monogenic developmental disorders. Recruitment in a parent-offspring trio had the largest effect on the probability of diagnosis (odds ratio, 4.70; 95% confidence interval [CI], 4.16 to 5.31). Probands were less likely to receive a diagnosis if they were born extremely prematurely (i.e., 22 to 27 weeks' gestation; odds ratio, 0.39; 95% CI, 0.22 to 0.68), had in utero exposure to antiepileptic medications (odds ratio, 0.44; 95% CI, 0.29 to 0.67), had mothers with diabetes (odds ratio, 0.52; 95% CI, 0.41 to 0.67), or were of African ancestry (odds ratio, 0.51; 95% CI, 0.31 to 0.78).

Conclusions: Among probands with severe, probably monogenic, difficult-to-diagnose developmental disorders, multimodal analysis of genomewide data had good diagnostic power, even after previous attempts at diagnosis. (Funded by the Health Innovation Challenge Fund and Wellcome Sanger Institute.).


Figures

Figure 1
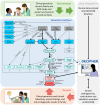
Figure 1. Overview of DDD variant detection and filtering pipelines.
Physician-patient interactions within the DDD study were supported by the DECIPHER database, including recruitment, barcoded sample collection and phenotyping at the start, and variant reporting, diagnostic interpretation and discussion of results at the end. Genomic assays are shown in grey boxes, variants in blue boxes, variant subsets in light blue circles, and reported and diagnostic variants in red boxes; variant callers and analytical processes are annotated on arrows (further detail and references in Supplementary Information). Once candidate variants were deposited into DECIPHER, clinical judgement was used to assess whether a patient’s phenotype fitted with the genotype prior to returning confirmed diagnoses to families. Diagrams were taken from www.ddduk.org. aCGH = array comparative genomic hybridisation; CNVs = copy number variants; DDG2P = Developmental Disorders Gene2Phenotype database; indels = insertions/deletions; MAF = minor allele frequency; MEI = mobile element insertion; OMIM = Online Mendelian Inheritance in Man database; P/LP = pathogenic/likely pathogenic (variants in the ClinVar database); SNP = single nucleotide polymorphism; SNVs = single nucleotide variants; SVs = structural variants; UPD = uniparental disomy; uORFs = upstream open reading frames; VEP = Variant Effect Predictor; VCFs = variant call files.
Figure 2
Figure 2. Summary of DDD variant deposition into DECIPHER.
(a) Variant classes reported into DECIPHER. Sequence variants were detected using ES and included variants <100bp in DDG2P genes; structural variants range from >100bp to whole chromosomes and were detected using microarrays and ES. (b) Changes in DDG2P and number of variants reported and annotated as pathogenic/likely pathogenic with time. Gene-disease entities were added to the DDG2P database following curation of the literature by consultant clinical geneticists or burden analyses within the DDD study. Participants were sequenced and analysed in batches based on recruitment date, sample receipt and family trio status. Variant filtering was repeated over the course of the study to enable evaluation of novel variants and variants in newly included genes. As a result of this iterative variant filtering strategy, some probands were evaluated up to six times and all were evaluated at least twice (see Figure S3). Following evaluation, variants were deposited into DECIPHER, usually in batches, for evaluation by clinical teams. Clinical annotation of pathogenicity was not immediate up deposition, but once annotated, the vast majority (97%) of variants did not change their annotation. Blue bars = cumulative number of reportable DDG2P genes; red dotted line = cumulative number of total DDD variants deposited into DECIPHER; red continuous line = cumulative number of clinically annotated pathogenic/likely pathogenic DDD variants in DECIPHER.
Figure 3
Figure 3. Summary of diagnoses in the DDD study.
(a) Venn diagram showing overlap of diagnoses based on clinical assertion (white) versus predicted ACMG/ACGS variant classifications (grey), augmented with phenotype-based IMPROVE-DD gene-disease models (blue); figure created using eulerr. (b) Diagnostic ranges in trios and singleton probands, based on clinical and/or predicted variant classifications. (c) Example of computational Bayesian variant classification, incorporating genotypic and phenotypic data in a DDD proband: only PM2 could be applied to the missense variant, resulting in an uncertain classification, but the proband’s phenotype was consistent with the IMPROVE-DD model for NSD1, allowing the variant to be upgraded to likely pathogenic; additional data (e.g. epigenomic profiling) was used to further increase the robustness of the diagnosis of Sotos syndrome.
Figure 4
Figure 4. Factors influencing the probability of being diagnosed.
Odds associated with being fully or partially diagnosed by the DDD study (based on clinician assertions of variant pathogenicity) are shown for covariates included in a multivariable logistic regression, adjusted for recruitment centre and number of variants reported in DECIPHER. Odds ratios are presented for binary and categorical variables. For quantitative variables (italics), odds change per one unit of measure of increase are presented. P-values and 95% confidence intervals are also shown; underline in variable column = outcome variable plotted, with N referring to the number of probands in this group. See Supplementary Information for further analysis of the number of affected first-degree relatives (Figure S6) and ancestry (Figure S7 and S8

Similar articles

Cited by

References

    1. 100,000 Genomes Project Pilot Investigators. Smedley D, Smith KR, et al. 100,000 Genomes Pilot on Rare-Disease Diagnosis in Health Care - Preliminary Report. N Engl J Med. 2021;385(20):1868–80. - PMC - PubMed
    1. Adams DR, Eng CM. Next-Generation Sequencing to Diagnose Suspected Genetic Disorders. N Engl J Med. 2018;379(14):1353–62. - PubMed
    1. Lalonde E, Rentas S, Lin F, Dulik MC, Skraban CM, Spinner NB. Genomic diagnosis for pediatric disorders: revolution and evolution. Front Pediatr. 2020;8:373. - PMC - PubMed
    1. Bennett CA, Petrovski S, Oliver KL, Berkovic SF. ExACtly zero or once: A clinically helpful guide to assessing genetic variants in mild epilepsies. Neurol Genet. 2017;3(4):e163. - PMC - PubMed
    1. Kaplanis J, Samocha KE, Wiel L, et al. Evidence for 28 genetic disorders discovered by combining healthcare and research data. Nature. 2020;586(7831):757–62. - PMC - PubMed

Publication types

MeSH terms