. 2023 May 4;83(9):1429-1445.e8.
doi: 10.1016/j.molcel.2023.03.017. Epub 2023 Apr 11.

The APE2 nuclease is essential for DNA double-strand break repair by microhomology-mediated end joining

Affiliations

The APE2 nuclease is essential for DNA double-strand break repair by microhomology-mediated end joining

Hubert Fleury et al. Mol Cell. .

Abstract

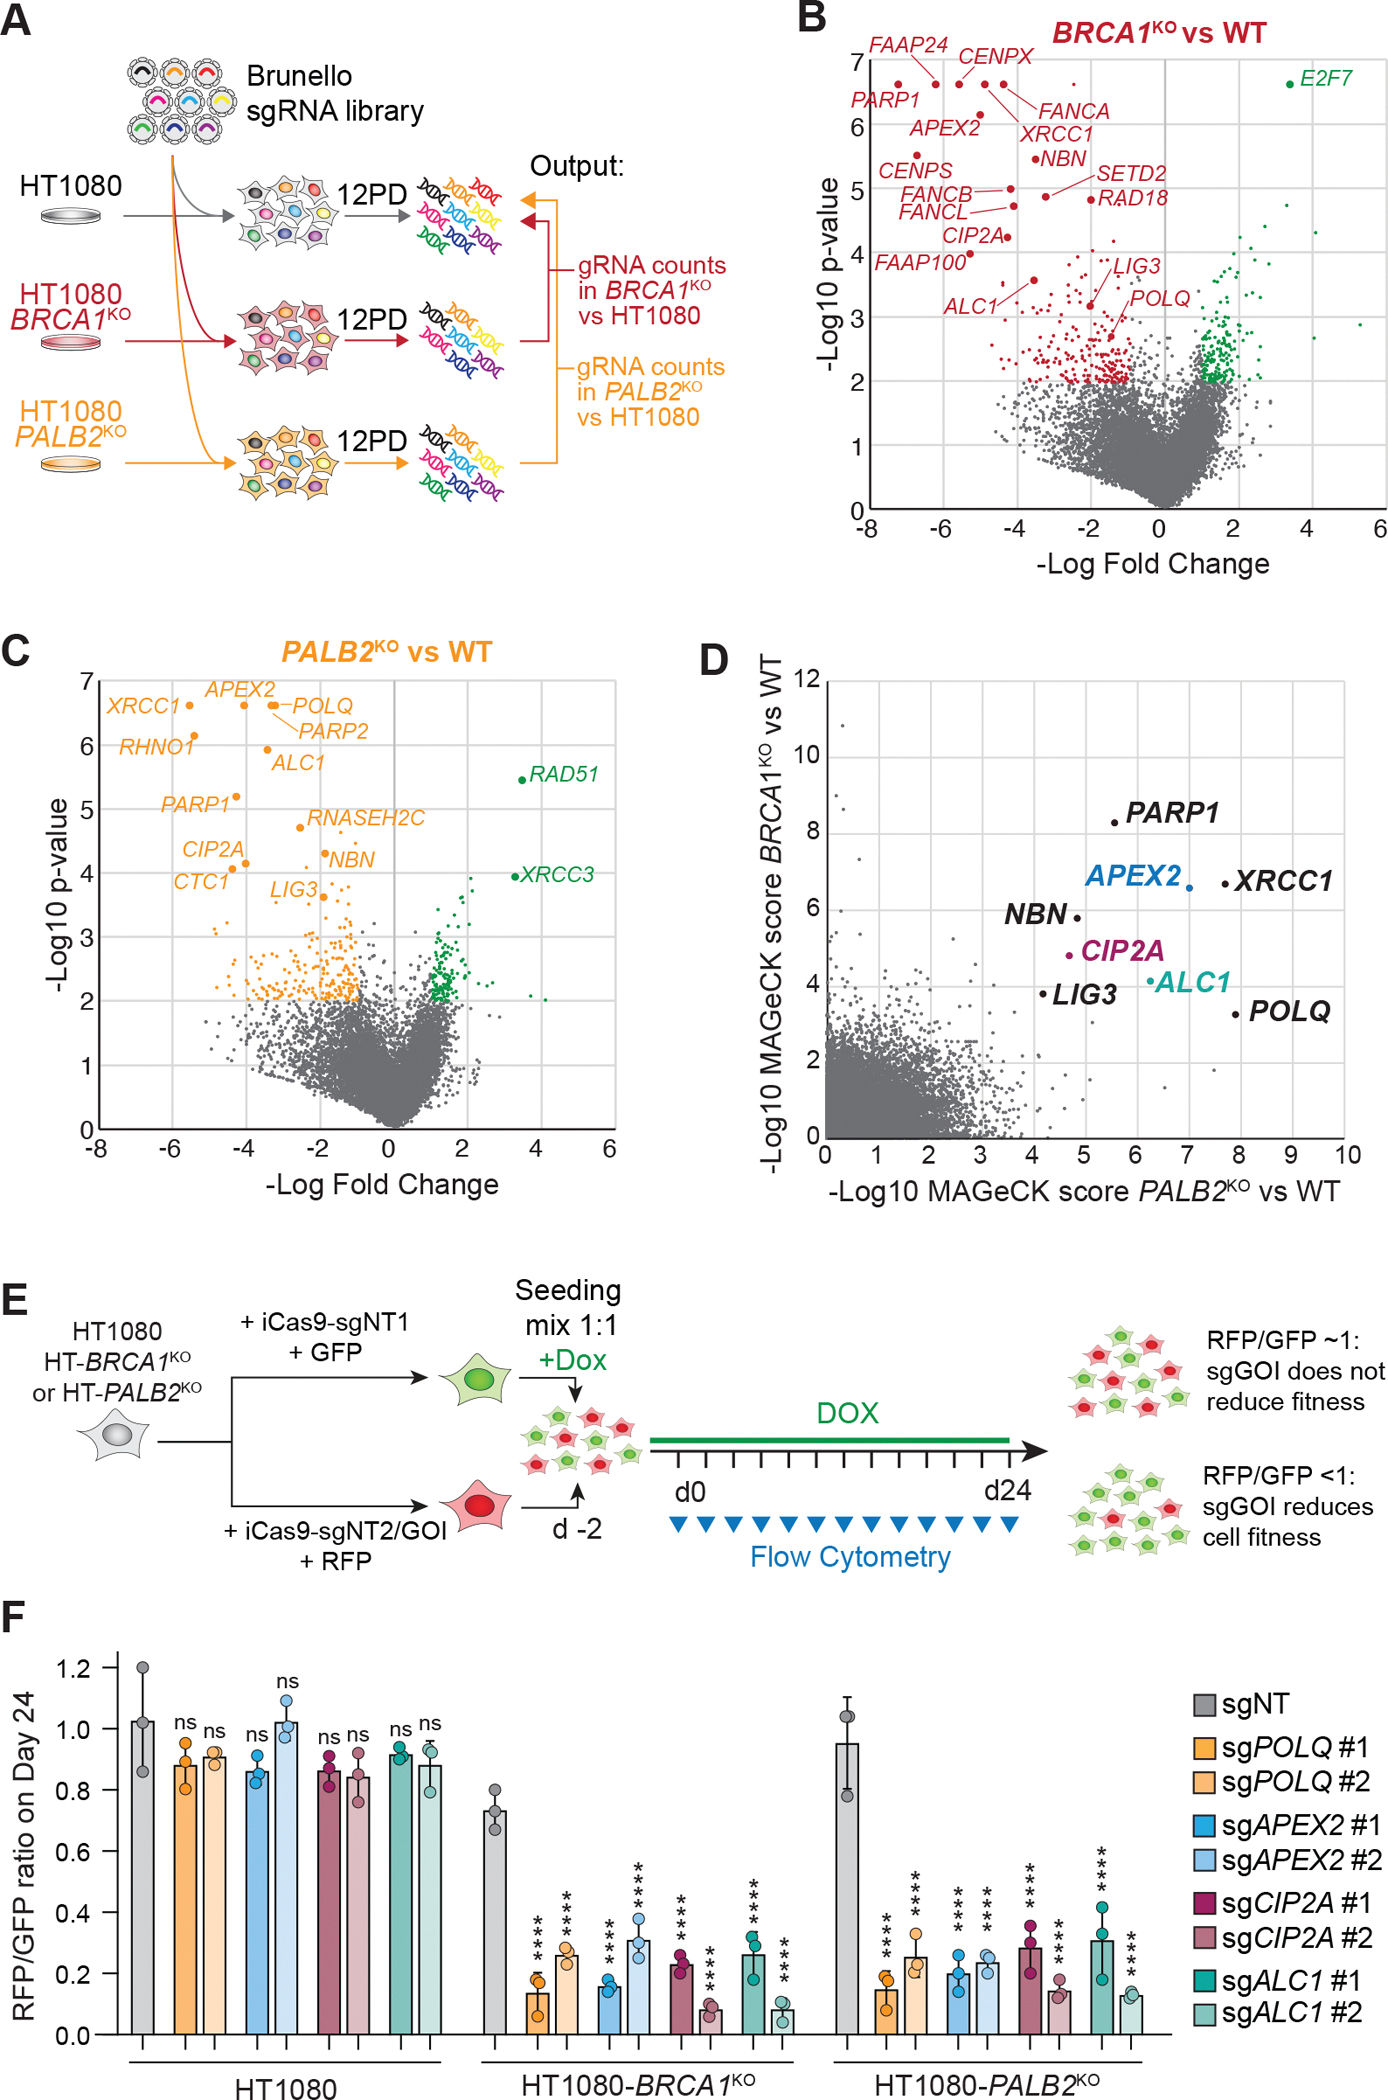
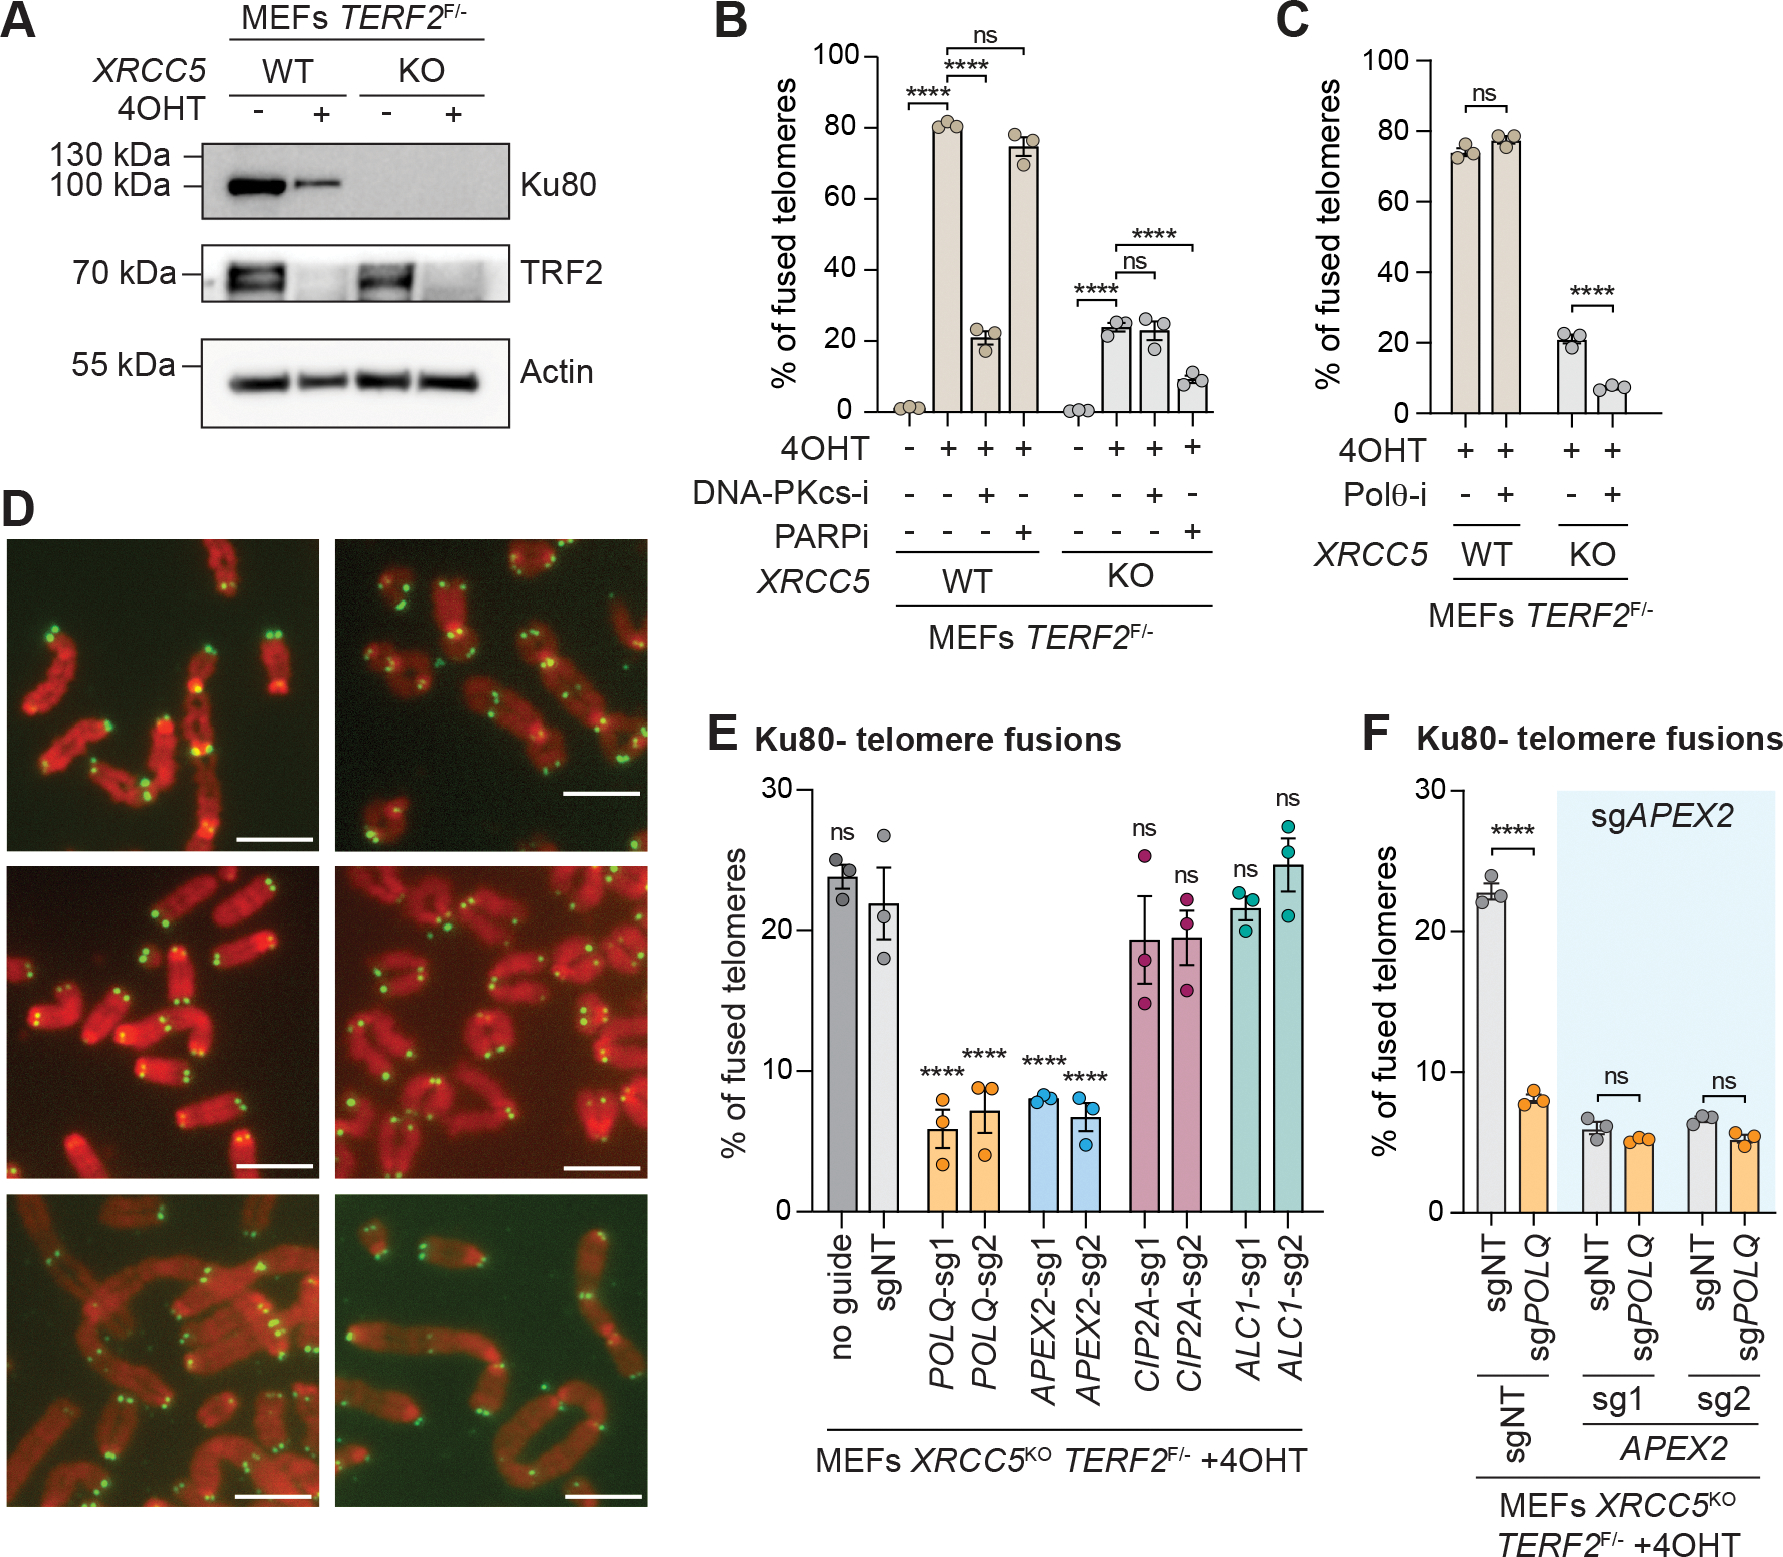
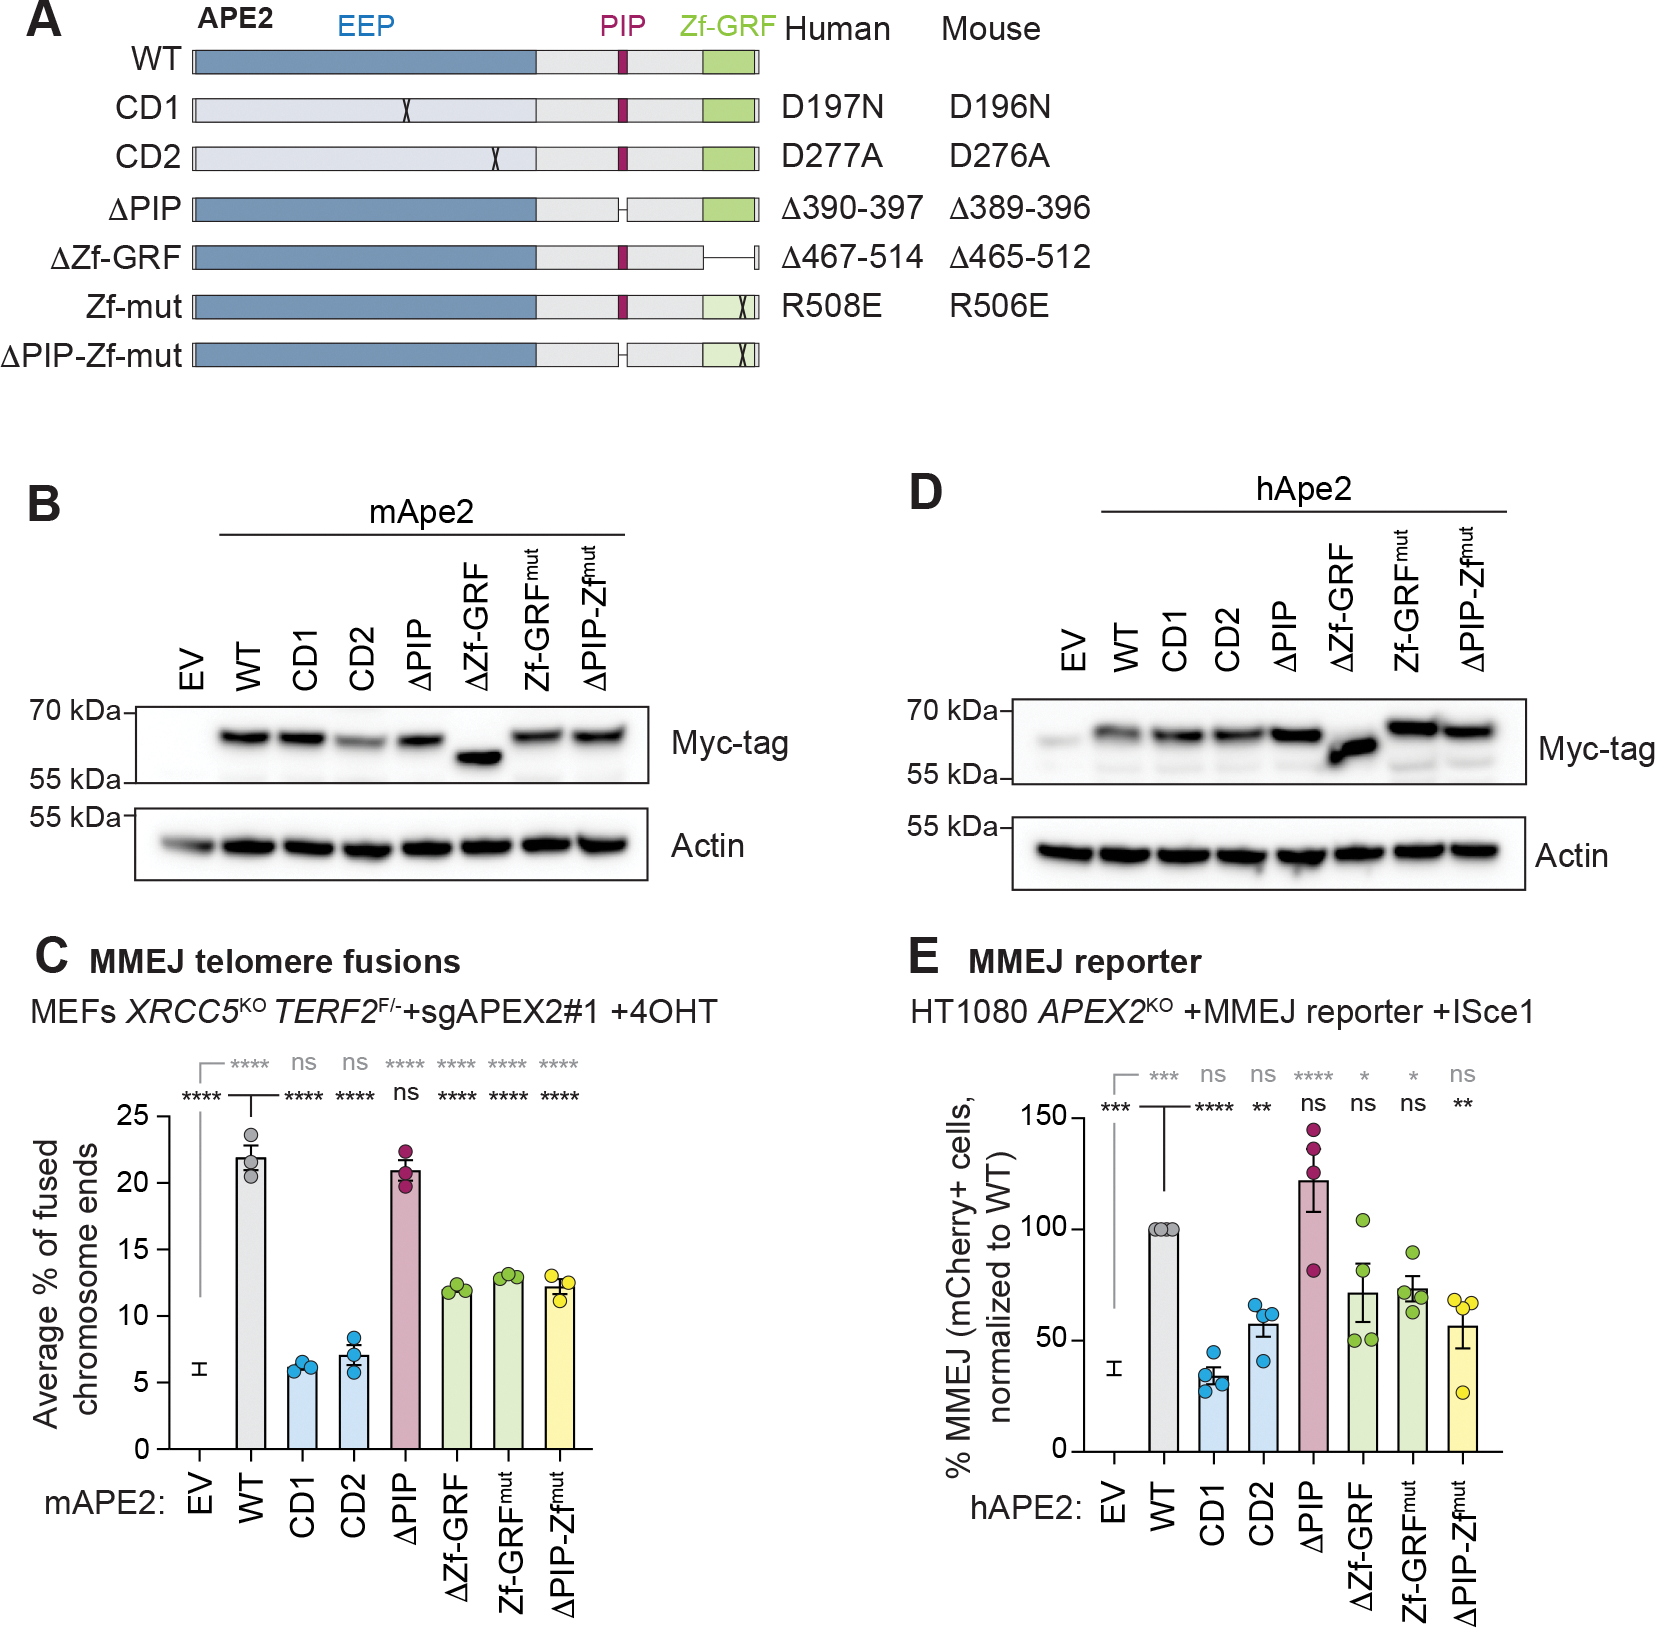
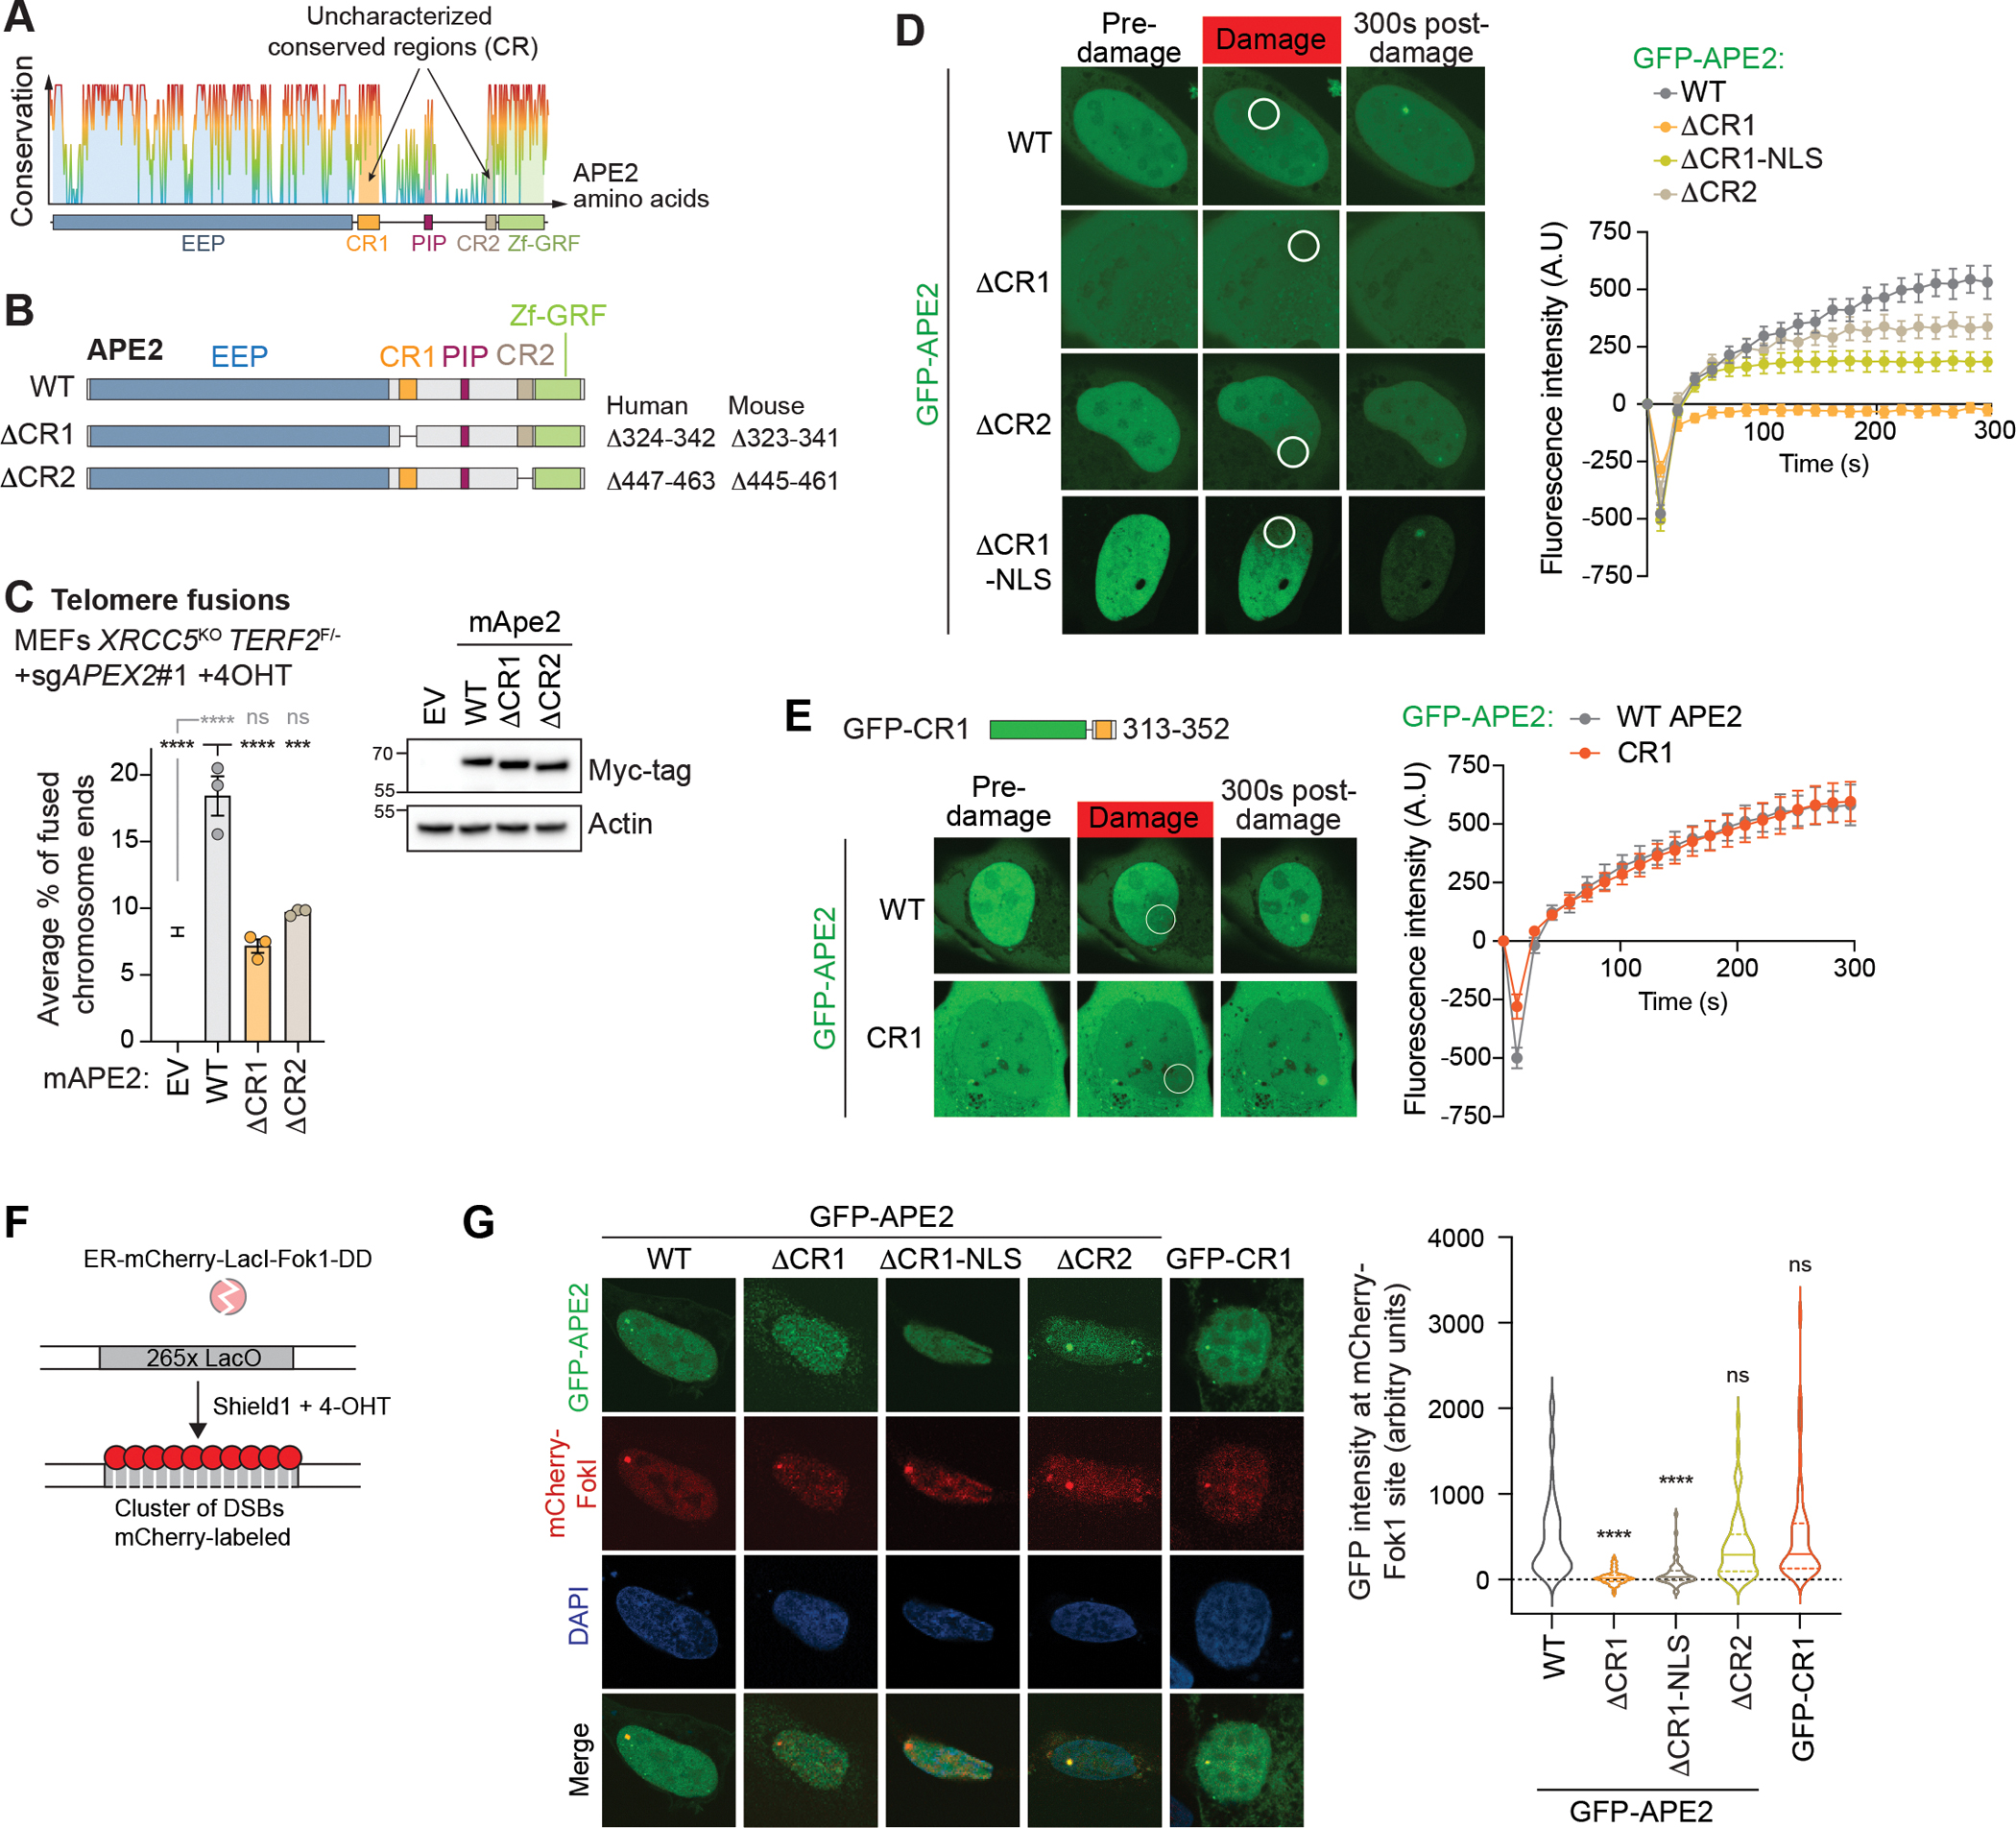
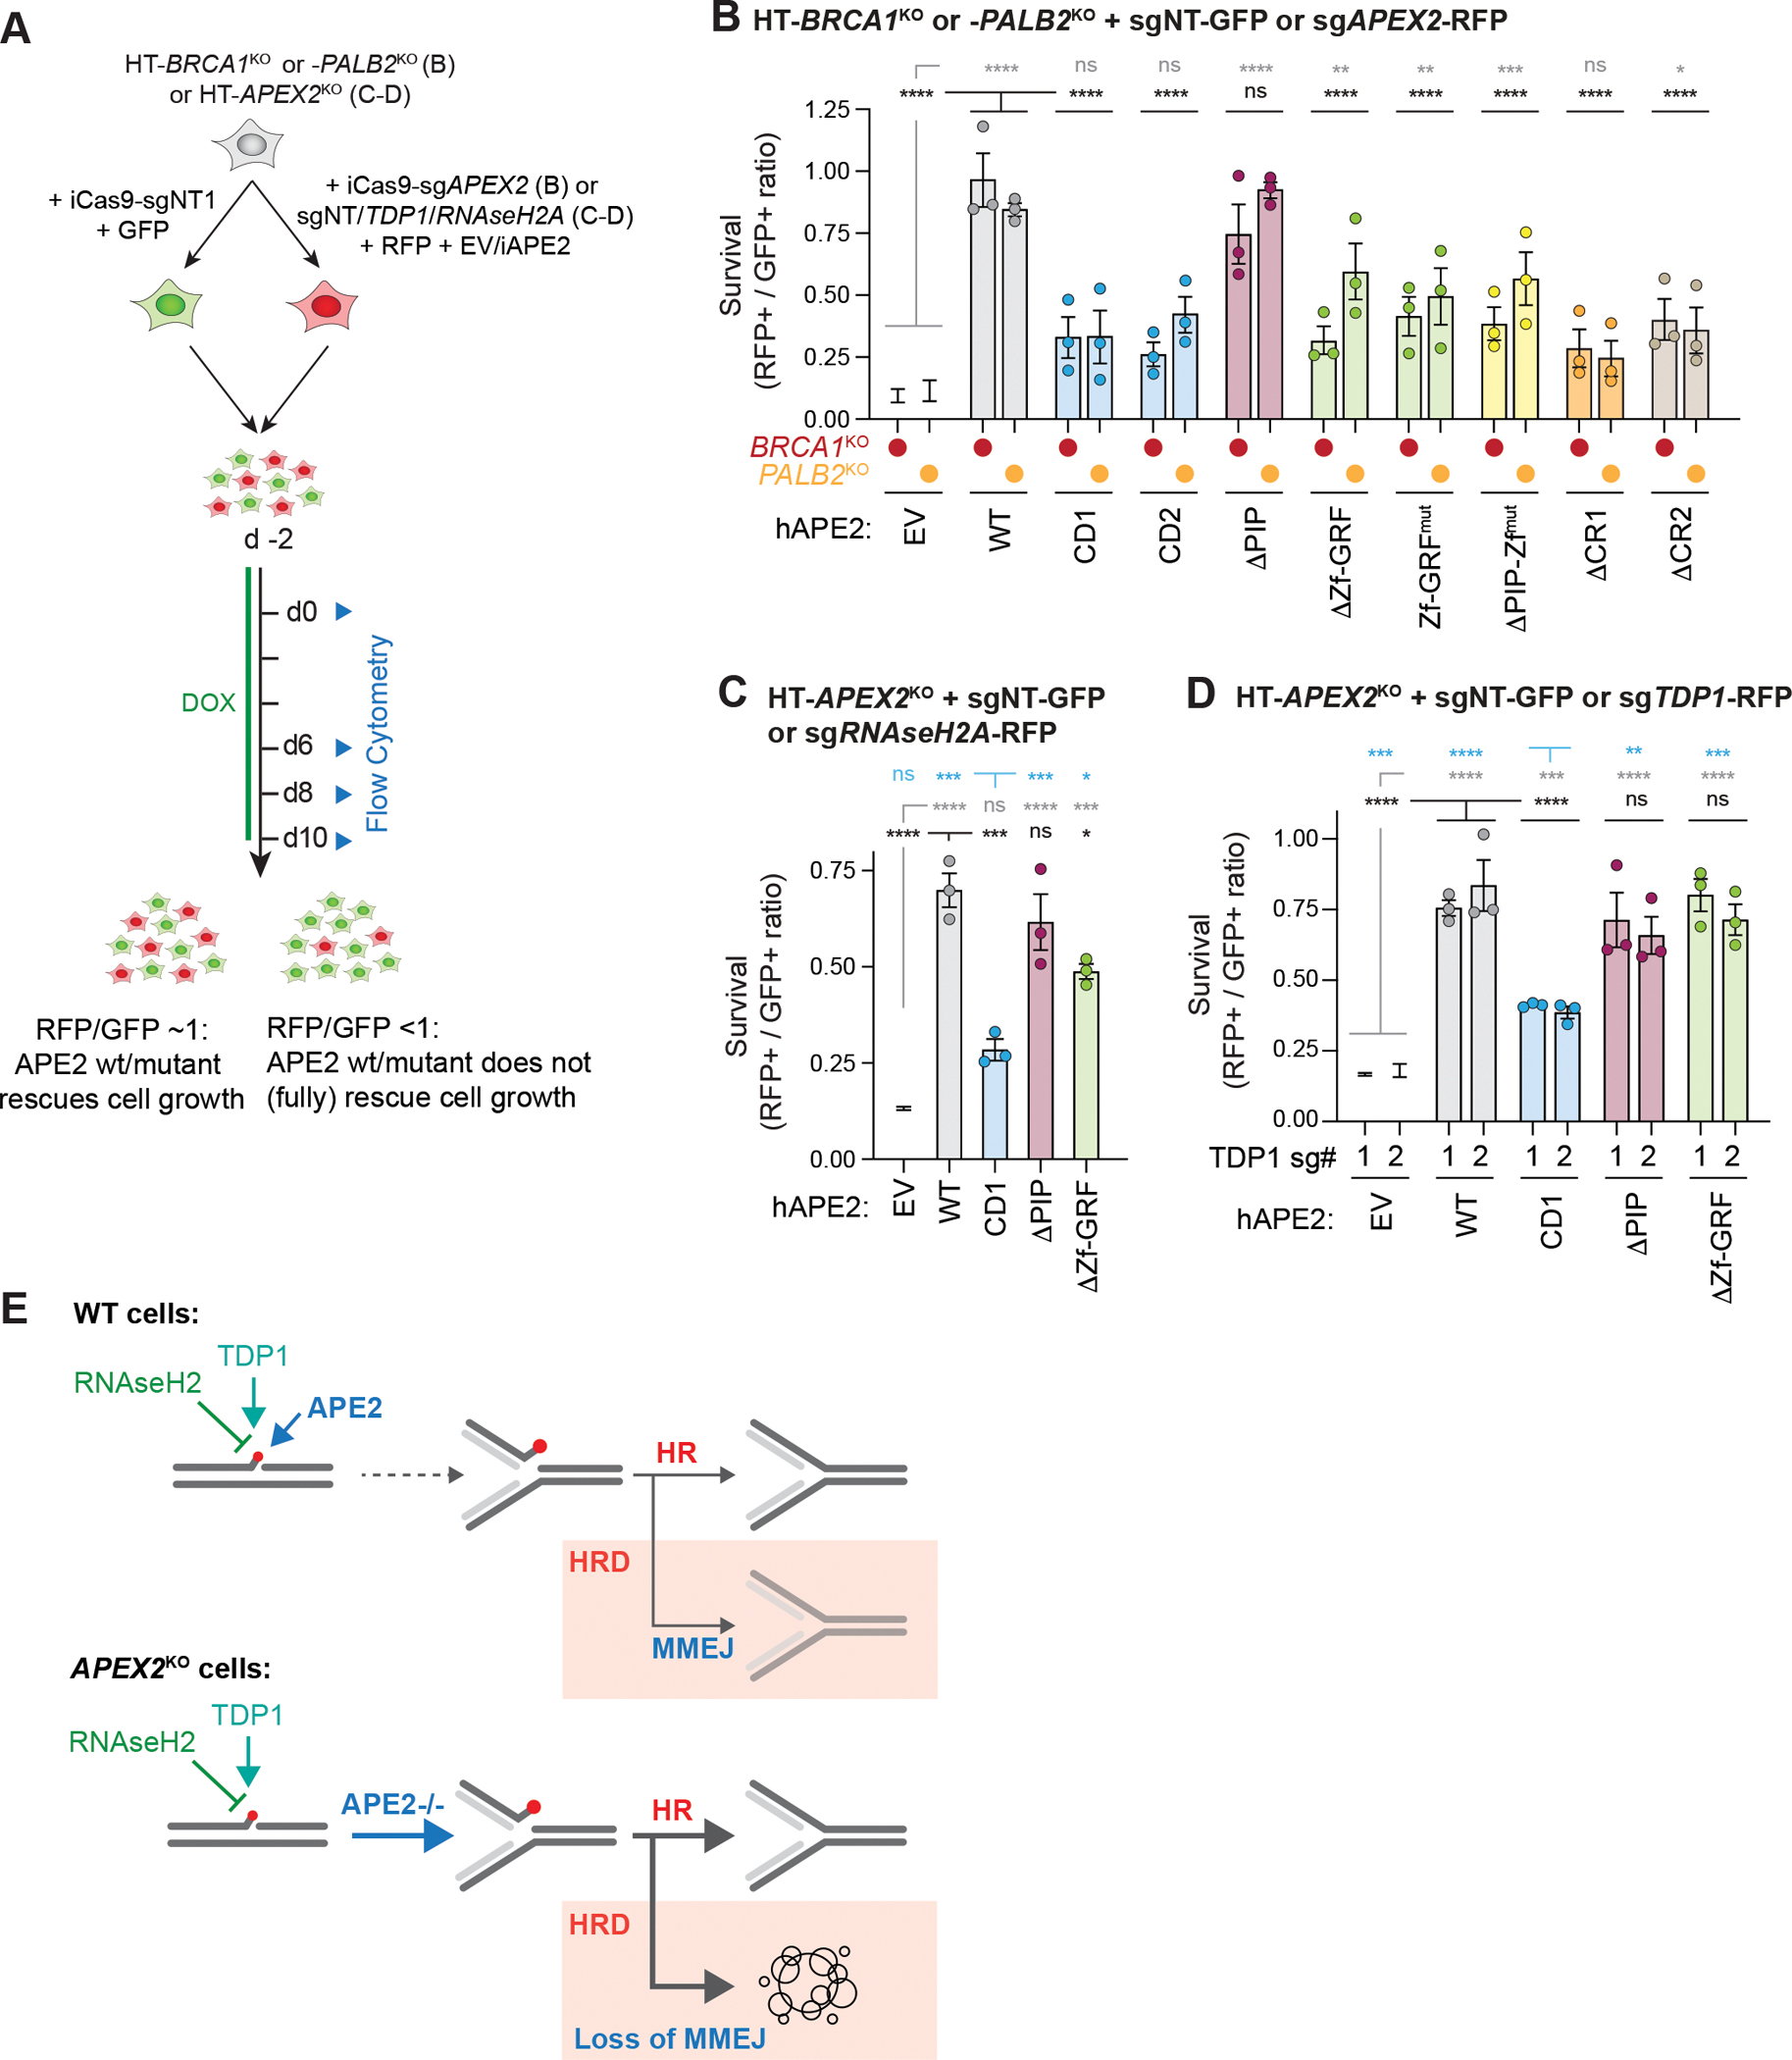
Microhomology-mediated end joining (MMEJ) is an intrinsically mutagenic pathway of DNA double-strand break (DSB) repair essential for proliferation of homologous recombination (HR)-deficient tumors. Although targeting MMEJ has emerged as a powerful strategy to eliminate HR-deficient (HRD) cancers, this is limited by an incomplete understanding of the mechanism and factors required for MMEJ repair. Here, we identify the APE2 nuclease as an MMEJ effector. We show that loss of APE2 inhibits MMEJ at deprotected telomeres and at intra-chromosomal DSBs and is epistatic with Pol Theta for MMEJ activity. Mechanistically, we demonstrate that APE2 possesses intrinsic flap-cleaving activity, that its MMEJ function in cells depends on its nuclease activity, and further identify an uncharacterized domain required for its recruitment to DSBs. We conclude that this previously unappreciated role of APE2 in MMEJ contributes to the addiction of HRD cells to APE2, which could be exploited in the treatment of cancer.

Keywords: APE2; APEX2; DNA repair; HR-deficient; Homologous Recombination; MMEJ; PARP; cancer; synthetic lethality.


Conflict of interest statement

Declaration of interests S.J.B. is co-founder and VP Science Strategy at Artios Pharma Ltd.

Figures

Figure 1:
Figure 1:. A dual synthetic lethal CRISPR-Cas9 screen identifies MMEJ genes and APEX2, CIP2A and ALC1.
A. Schematic of the dual CRISPR-Cas9 screen. Genome-wide dropout screens were performed in isogenic HT1080, HT1080-BRCA1KO and HT1080-PALB2KO cells. B-C. Result of the BRCA1 (B) and PALB2 (C) synthetic lethality screens. Log fold changes and p values are calculated based on guide RNA representation in the BRCA1KO (B) or PALB2KO (C) cells compared to parental HT1080 cells. Most significant genes (−Log Fold change>1 or −1, −Log10 p value >2) are colored in red/orange (Log Fold change>−1) or green (Log Fold change>1). D. Plot of the MAGeCK −Log10 depletion scores of BRCA2KO vs PALB2KO. E. Schematic and timeline of the growth competition assay used in F. F. Result of the growth competition assay at day 24. Values are % of RFP+ cells / % of GFP+ cells, normalized to day 0. 3 biological replicates. Data are mean ± s.d. See also Figure S1 and Table S1.
Figure 2.
Figure 2.. APE2 is required for Polθ-mediated fusions of deprotected telomeres.
A. Western Blot of Ku80, TRF2 and Actin in parental and XRCC5KO TERF2F/ upon treatment with 4OHT (1μM). B-C. Percentage of fused telomeres in XRCC5WT and XRCC5KO TERF2F/− MEFs upon treatment with tamoxifen (4OHT, 1μM), DNA-PKcs-inhibitor (NU7441, 1μM) and PARP inhibitor (Olaparib, 20μM) (B) or Polθ inhibitor (ART558, 1μM). Data are mean ± s.e.m. D. Representative images of metaphase spreads analyzed in e. Red: DNA (DAPI), Green: telomere FISH. Scale bar: 5μm. E-F. Quantification of telomere fusions in XRCC5KO TERF2F/− MEFs transduced with iCas9 and the indicated sgRNAs (sgNT: non-targeting sgRNA) and treated with doxycycline (1μg/ml) and 4OHT (1μM). Statistical analysis for B, C, E and F: Data show three independent experiments. n=20 (B), n=25 (C), n=22 (E-F) metaphases counted in each condition, each replica. Data are mean ± s.e.m. One-way ANOVA. Ns: non-significant, ****p<0.0001. See also Figure S2.
Figure 3.
Figure 3.. APE2 is a key effector of Polθ-mediated end-joining at intra-chromosomal DSBs.
A. Schematic of the MMEJ repair reporter used in 3C, 3E, 5G, and 6E. Upon induction of a DSB by ISce1 and repair using annealing of the indicated microhomologies, the mCherry cassette is reconstituted. B-C-D. MMEJ quantification using the DNA reporter in: (B) parental HT1080 and indicated APEX2KO and POLQKO clones, (C) parental HT1080 and APEX2KO clones complemented with empty vector (EV) or hAPE2, and (D) parental HT1080 and APEX2KO clones with iCas9 and sgNT (non-targeting gRNA) or sgPOLQ. mCherry+ cells (MMEJ+) were scored in the BFP+ population (I-Sce1+). Values are normalized to WT (B), WT+EV (C) or WT+sgNT (D). Three (B,D) or five (C) independent experiments. Data are mean ± s.e.m. E. Schematic of the MMEJ sequence. F. Depiction of the most frequent repair outcomes obtained upon DSB induction with Cas9 followed by amplicon sequencing of the MMEJ sequence. G. Quantification of the most frequent repair outcomes in parental HT1080 (WT) or APEX2KO clones untreated or treated with Polθ inhibitor (ART558, 1μM). Data represent % of total edited sequences. Three biological replicates were performed with parental cells, while APEX2KO replicates were obtained from four different clones (A29, A37, A42 and A46). Data are mean ± s.e.m. Statistical analysis for B, C, D and G: One-way ANOVA. *p<0.05, **p<0.01, ****p<0.0001. See also Figures S3, S4 and Tables S2 and S3.
Figure 4.
Figure 4.. The PIP and Zf-GRF motifs of APE2 are dispensable for MMEJ.
A. Schematic of wild type and mutants APE2. Amino acids mutated or deleted are indicated for both human and mouse APE2. B. Western Blot of Myc-tag (mAPE2) and Actin for the indicated MEFs used in D. C. Quantification of telomere fusion in XRCC5KO TERF2F/− MEFs transduced with iCas9, sgAPEX2#1, and the indicated mAPE2 construct, and treated with doxycycline (1μg/ml) and 4OHT (1μM). EV: empty vector. 3 independent experiments. 26 metaphases were counted in each condition, each replica. Data are mean ± s.e.m. D. Western Blot of Myc-tag (hAPE2) and Actin for the indicated HT1080s used in G. E. MMEJ quantification using the reporter from 2A in HT1080-APEX2KO clone A2.4 complemented with indicated hAPE2. mCherry+ cells (MMEJ+) were scored in the BFP+ population (I-Sce1+). Values are normalized to WT. Four independent experiments. Data are mean ± s.e.m. Statistical analysis for C and E: One-way ANOVA. Grey: vs empty vector, Black: vs WT. ns: non-significant, *p<0.05, **p<0.01, ***p<0.001, ****p<0.0001. See also Figure S5.
Figure 5.
Figure 5.. An uncharacterized conserved region of APE2 promotes its recruitment to DSBs and repair by MMEJ.
A. Schematic of hAPE2 amino acid conservation. Two uncharacterized conserved regions are indicated. B. Schematic of APE2 CR1 and CR2 deletion mutants. C. Left: Quantification of telomere fusion in XRCC5KO TERF2F/− MEFs transduced with iCas9, sgAPEX2#1, and the indicated mAPE2 construct, and treated with doxycycline (1μg/ml) and 4OHT (1μM). EV = empty vector. Three independent experiments. 23 metaphases in each condition, each replica. Data are mean ± s.e.m. Right: Western blot showing expression of the mAPE2 constructs. D-E. Recruitment of GFP-hAPE2 to sites of laser micro-irradiation (405 nm, 60% power) upon treatment with BrdU (10μM, 20h) in U2OS cells transfected with the indicated constructs. Data show mean of all cells analyzed over three independent experiments. In D, N=26 (WT, ΔCR1-NLS), 24 (ΔCR1), or 29 (ΔCR2) cells. In E, N=21 (WT) or 20 (CR1) cells. F. Schematic of the mCherry-LacI-Fok1 system. G. Representative images (left) and quantification (right) of the 265x LacO U2OS cells transfected with the indicated GFP-APE2 constructs. Data represents quantification of GFP intensity at the mCherry locus. 48 cells per sample were analyzed over two independent experiments. Statistical analysis for C and G: One-way ANOVA. Grey: vs empty vector, Black: vs WT. ns: nonsignificant, ***p<0.001, ****p<0.0001. See also Figure S6.
Figure 6.
Figure 6.. The survival response of HRD cells depends on the APE2 motifs that regulate MMEJ and 3’ block removal.
A. Schematic and experimental timeline for the growth competition assays used in B, C and D. B. Growth competition assay in HT1080-BRCA1KO and HT1080-PALB2KO cells. Values are % of RFP+ cells / % of GFP+ cells, averaged on days 6, 8 and 10 and normalized to day 0. Three independent experiments. Data are mean ± s.e.m. C-D. Growth competition assay in HT1080-APEX2KO (clone A29) cells with sgRNAseH2A (C) or sgTDP1 (D). Values are % of RFP+ cells / % of GFP+ cells, averaged on days 6, 8 and 10 and normalized to day 0. Three independent experiments. Data are mean ± s.e.m. E. Model explaining the synthetic lethal interaction between HR-deficiency and APEX2 knockout. Loss of APE2 leads to accumulation of 3’ blocking lesions that are lethal in the absence of HR and MMEJ. Statistical analyses for B, C, D: One-way ANOVA. Grey: vs empty vector, Black: vs WT, blue: vs CD. ns: nonsignificant, *p<0.05, **p<0.01, ***p<0.001, ****p<0.0001.
Figure 7:
Figure 7:. Human APE2 possesses intrinsic 3’ flap cleavage activity.
A. Schematic of the MMEJ repair pathway. Depending on the length of resected DNA relative to microhomologies, 3’ flaps or Y structures (the strand opposite the flap is single stranded) can form upon microhomology annealing. B-C. Representative gels (15% polyacrylamide denaturing urea gel) of the 3’ flap and Y structure cleavage by APE2. APE2 (B) or APE2 and PCNA (C) at the indicated concentrations were incubated with 25 nM of the indicated DNA substrates in presence of 1mM Mg2+ and 1mM Mn2+. The asterisk indicates the position of the fluorescein isothiocyanate (FITC) labeling at the 5’ or 3’ end of the oligo. PTO indicates the presence of 5 phosphorothioate bonds at the 3’ end of complementary short oligo in 3’ flap. PTO bonds make DNA refractory to nuclease cleavage. See also Figure S7.

Similar articles

Cited by

References

    1. Knoch J, Kamenisch Y, Kubisch C, and Berneburg M (2012). Rare hereditary diseases with defects in DNA-repair. Eur J Dermatol 22, 443–455. 10.1684/ejd.2012.1654. - DOI - PubMed
    1. O’Driscoll M (2012). Diseases associated with defective responses to DNA damage. Cold Spring Harb Perspect Biol 4. 10.1101/cshperspect.a012773. - DOI - PMC - PubMed
    1. Taylor AMR, Rothblum-Oviatt C, Ellis NA, Hickson ID, Meyer S, Crawford TO, Smogorzewska A, Pietrucha B, Weemaes C, and Stewart GS (2019). Chromosome instability syndromes. Nat Rev Dis Primers 5, 64. 10.1038/s41572-019-0113-0. - DOI - PMC - PubMed
    1. Chae YK, Anker JF, Carneiro BA, Chandra S, Kaplan J, Kalyan A, Santa-Maria CA, Platanias LC, and Giles FJ (2016). Genomic landscape of DNA repair genes in cancer. Oncotarget 7, 23312–23321. 10.18632/oncotarget.8196. - DOI - PMC - PubMed
    1. Ma J, Setton J, Lee NY, Riaz N, and Powell SN (2018). The therapeutic significance of mutational signatures from DNA repair deficiency in cancer. Nat Commun 9, 3292. 10.1038/s41467-018-05228-y. - DOI - PMC - PubMed

Publication types