. 2023 Jun 1:468:116513.
doi: 10.1016/j.taap.2023.116513. Epub 2023 Apr 11.

Application of Cell Painting for chemical hazard evaluation in support of screening-level chemical assessments

Affiliations

Application of Cell Painting for chemical hazard evaluation in support of screening-level chemical assessments

Jo Nyffeler et al. Toxicol Appl Pharmacol. .

Abstract

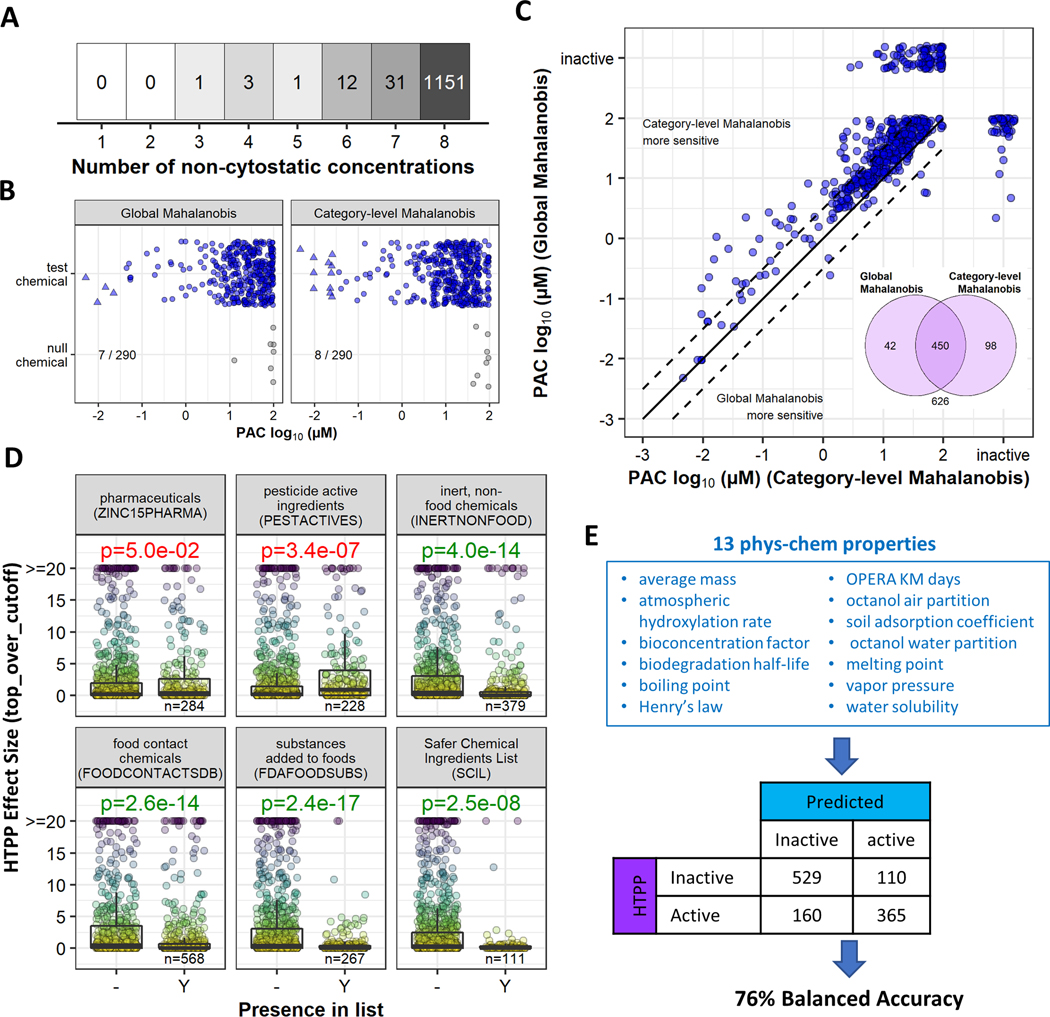
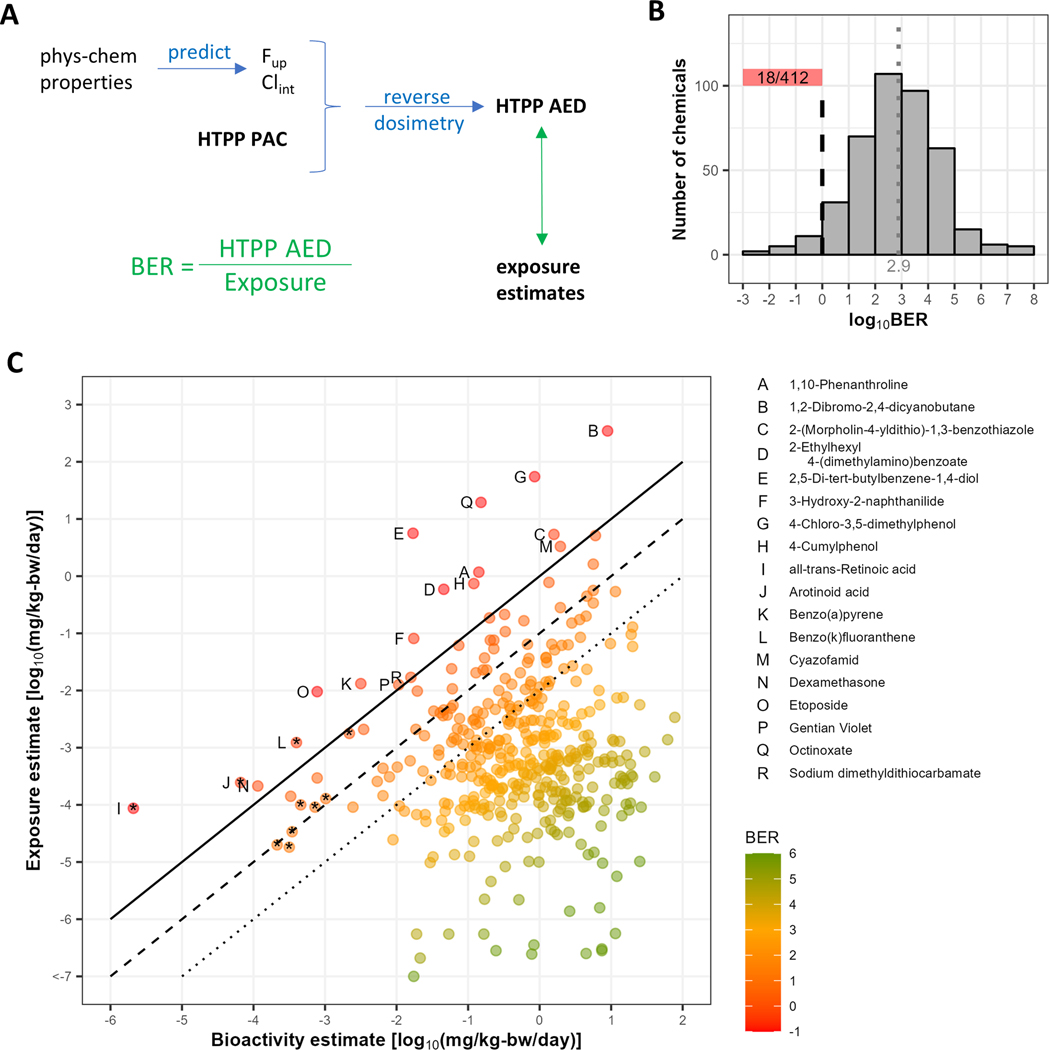
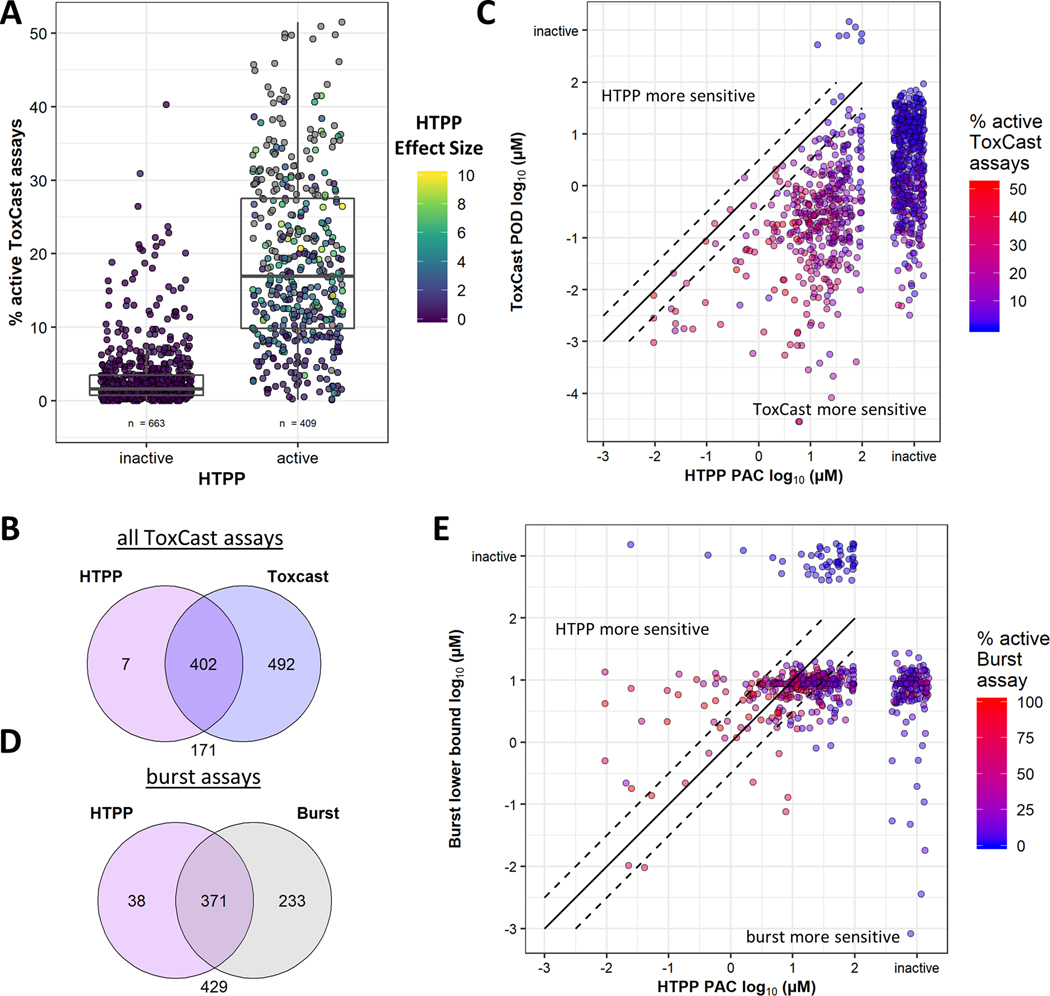
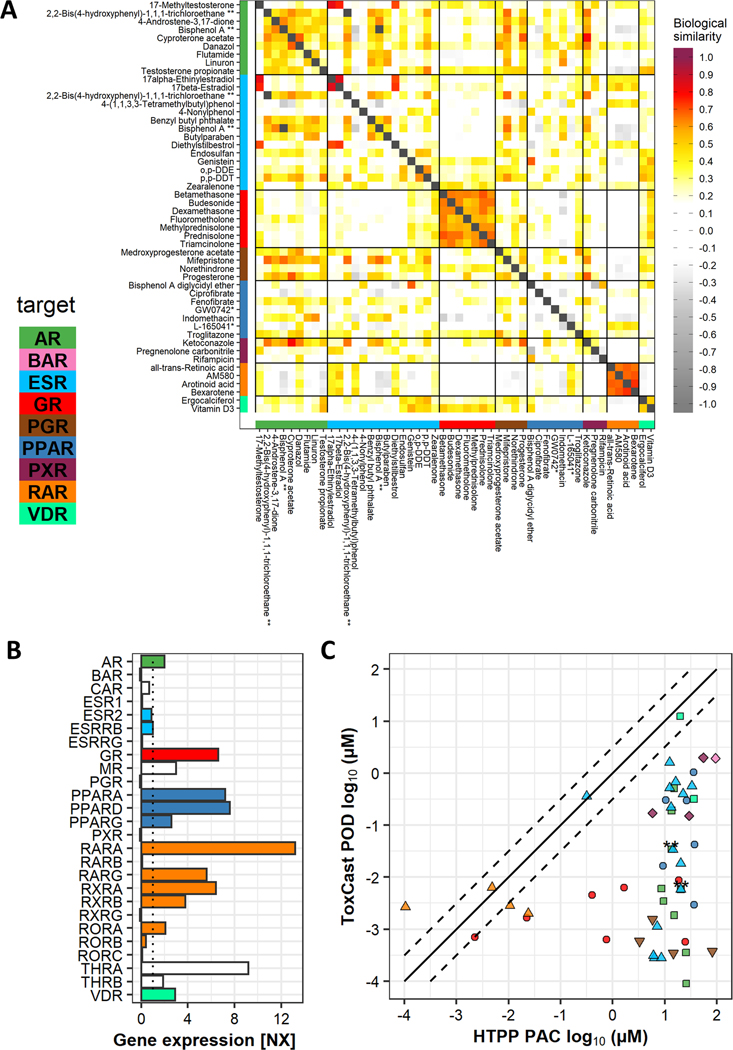
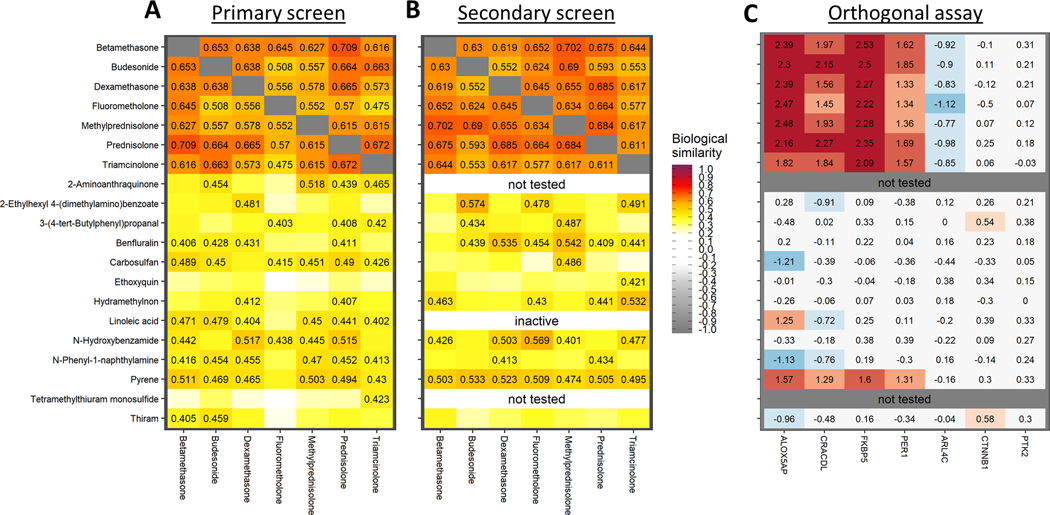
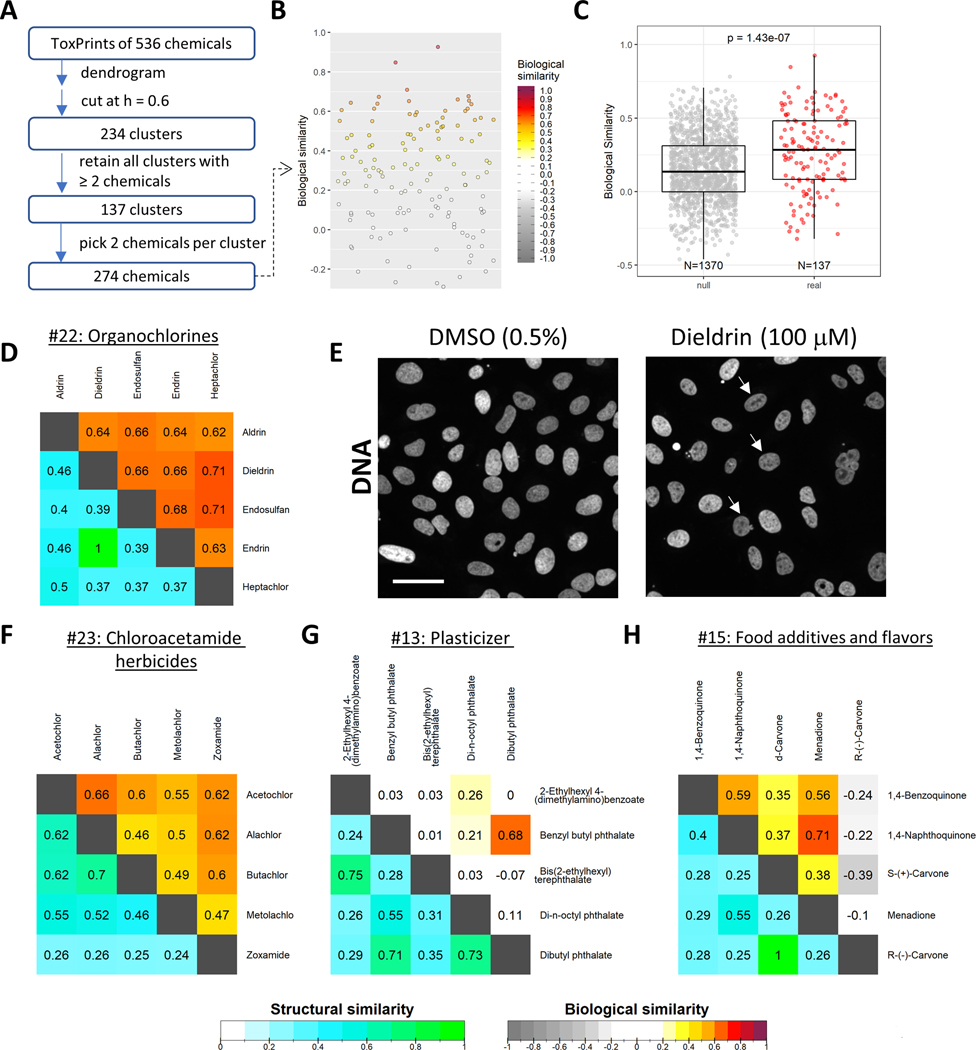
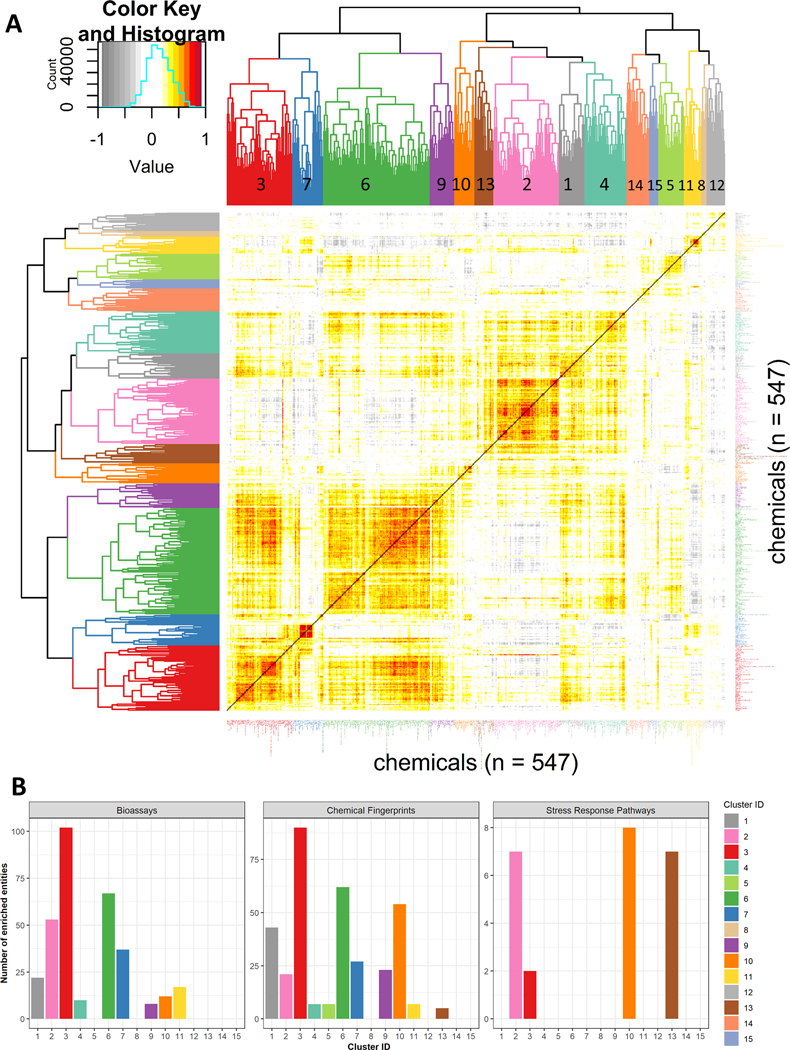
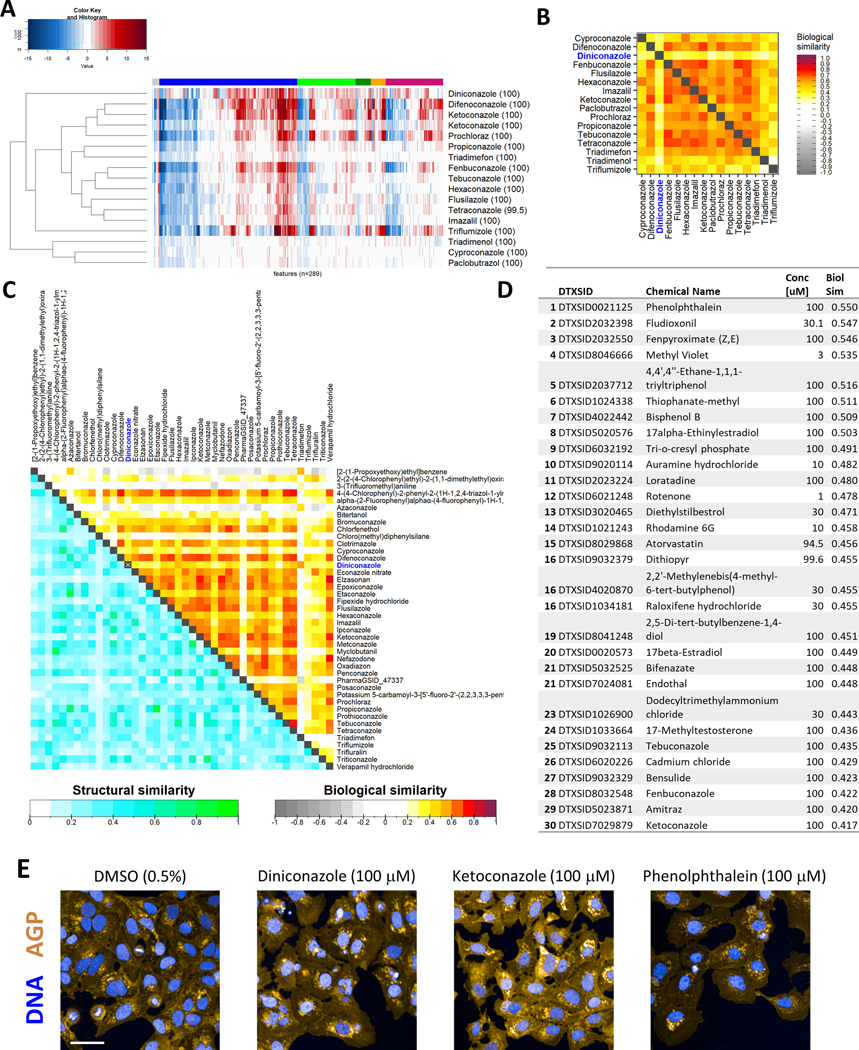
'Cell Painting' is an imaging-based high-throughput phenotypic profiling (HTPP) method in which cultured cells are fluorescently labeled to visualize subcellular structures (i.e., nucleus, nucleoli, endoplasmic reticulum, cytoskeleton, Golgi apparatus / plasma membrane and mitochondria) and to quantify morphological changes in response to chemicals or other perturbagens. HTPP is a high-throughput and cost-effective bioactivity screening method that detects effects associated with many different molecular mechanisms in an untargeted manner, enabling rapid in vitro hazard assessment for thousands of chemicals. Here, 1201 chemicals from the ToxCast library were screened in concentration-response up to ∼100 μM in human U-2 OS cells using HTPP. A phenotype altering concentration (PAC) was estimated for chemicals active in the tested range. PACs tended to be higher than lower bound potency values estimated from a broad collection of targeted high-throughput assays, but lower than the threshold for cytotoxicity. In vitro to in vivo extrapolation (IVIVE) was used to estimate administered equivalent doses (AEDs) based on PACs for comparison to human exposure predictions. AEDs for 18/412 chemicals overlapped with predicted human exposures. Phenotypic profile information was also leveraged to identify putative mechanisms of action and group chemicals. Of 58 known nuclear receptor modulators, only glucocorticoids and retinoids produced characteristic profiles; and both receptor types are expressed in U-2 OS cells. Thirteen chemicals with profile similarity to glucocorticoids were tested in a secondary screen and one chemical, pyrene, was confirmed by an orthogonal gene expression assay as a novel putative GR modulating chemical. Most active chemicals demonstrated profiles not associated with a known mechanism-of-action. However, many structurally related chemicals produced similar profiles, with exceptions such as diniconazole, whose profile differed from other active conazoles. Overall, the present study demonstrates how HTPP can be applied in screening-level chemical assessments through a series of examples and brief case studies.

Keywords: Cell Painting; Computational toxicology; Concentration-response; High-throughput phenotypic profiling.


Conflict of interest statement

Declaration of Competing Interest The authors declare no conflict of interest. This manuscript has been reviewed by the Center for Computational Toxicology and Exposure, Office of Research and Development, U.S. Environmental Protection Agency, and approved for publication. Approval does not signify that the contents reflect the views of the Agency, nor does mention of trade names or commercial products constitute endorsement or recommendation for use.

Figures

Figure 1:
Figure 1:. Overview of screening results.
(A) Graphical representation of the number of non-cytostatic concentrations for each test chemical. Each chemical was tested at 8 concentrations (typically from 0.03 – 100 μM). A reduction of cell counts by more than 50% was considered cytostatic. Most chemicals (1151/1199) were not cytostatic in the tested concentration range. (B) PACs for all active test chemicals (blue data points) with the two analysis approaches. A synthetic data set consisting of 290 “null” chemicals was generated (gray circles). PACs extrapolated below the tested concentration range are depicted as triangles. (C) Concordance of the two analysis approaches (Global and Category-level Mahalanobis). The scatter plot displays the PACs for both approaches for all chemicals active according to at least one approach. The inset Venn diagram indicates the number of active chemicals for each approach. (D) Distribution of effect size values for chemicals depending on their presence (“Y”) or absence (“-“) in chemical lists. The value below the box indicates the number of tested chemicals that are a member of the indicated list. Presence in lists information was obtained from the CompTox Chemicals Dashboard for 1207 chemicals. The effect size value corresponds to the ‘top over cutoff’ from the Global Mahalanobis curve fit. For each list, a two-sided Wilcoxon rank sum test was performed by comparing the distribution of effect size values of chemicals in the list with the ones from chemicals not in that list. P-values in red indicate a higher group median of chemicals in the list vs. chemicals not in the list; green p-values indicate the opposite. Note that values >20 were adjusted for graphical display, but the statistical analysis was performed on the original values. (E) OPERA predictions for 13 physicochemical properties were used to build Random Forest (RF) models to predict activity in the HTPP assay. Multiple RF models were built and tuned (see Supporting Information). The confusion matrix for the winning model is shown, which lead to a balanced accuracy of 76%.
Figure 2:
Figure 2:. Application of potency estimates for BER analysis.
(A) Schematic overview outlining the prediction of metabolic parameters (Fup, Clint) to use in reverse dosimetry to convert the HTPP PAC (in vitro concentration, in μM) to an administered equivalent dose (AED, in mg/kg-bw/day). The BER is then calculated from the ratio of the lower bound (5th percentile) of the HTPP AED and the upper bound (95th percentile) of the exposure estimate. (B) Distribution of log10(BER) for 412 chemicals that were active in HTPP, had the physicochemical parameters available to estimate the AED, and had exposure estimates available. The gray dotted line indicates the median of the distribution. The black dashed line indicates the unity line. Chemicals to the left of the unity line have an AED below the upper bound of the exposure estimate. (C) Scatter plot of the bioactivity estimate (x-axis) versus exposure estimate (y-axis) for the chemicals in B. Points are colored by their log10(BER). Chemicals with a negative log10(BER) are labeled. The solid, dashed, and dotted lines indicate log10(BER) of 0, 1, and 2, respectively. Points with asterisks correspond to PACs that were extrapolated below the test concentration range. Abbreviations: Fup: fraction unbound; Clint: internal clearance; BER: bioactivity-exposure ratio.
Figure 3:
Figure 3:. Comparison to targeted in vitro assay results from the ToxCast assay battery.
(A) Boxplot comparing the HTPP activity calls (x-axis) with the number of ToxCast assays where a chemical was found active (y-axis). Each dot represents a chemical. The color code corresponds to the effect size (‘top over cutoff’ of the ‘Global Mahalanobis’ approach) in the HTPP assay. The box indicates the median with the first and third quartile and the whiskers indicate 1.5 * inter-quartile range. (B) Venn diagram of the number of chemicals active in HTPP (purple) and ToxCast (blue). (C) Scatter plot displaying the potency estimates for all chemicals active in either HTPP or ToxCast assays. A chemical was deemed active in ToxCast if it was active in at least three assays. The solid line indicates unity; the dashed lines marks ½ an order of magnitude. (D) Venn diagram of the number of chemicals active in HTPP (purple) and ToxCast burst assays (gray). (E) Scatter plot displaying the potency estimates for all chemicals active in either HTPP or ToxCast burst assays. The solid line indicates unity; the dashed lines marks ½ an order of magnitude.
Figure 4:
Figure 4:. Profile comparison of nuclear receptor modulators
(A) Correlation matrix of phenotypic profiling data for 50 nuclear receptor (NR) modulating chemicals. Chemicals are ordered by their main target, as annotated in the RefChemDB collection. Two chemicals (marked with **) were assigned to two targets (AR, ESR). Abbreviations: GW0742: 4-[(2-[3-Fluoro-4-(trifluoromethyl)phenyl]-4-methyl-1,3-thiazol-5-yl}methyl)sulfanyl]-2-methylphenoxy}acetic acid; L-165041: 4-[3-(4-Acetyl-3-hydroxy-2-propylphenoxy)propoxy]phenoxy-acetic acid. (B) Expression data for U-2 OS cells obtained from the Human Protein Atlas (http://www.proteinatlas.org) (Uhlen et al., 2017). Genes with an NX value < 1 are considered not expressed (indicated by the dotted line). (C) Scatter plot displaying the potency estimates for NR modulators active in HTPP (see Fig 3C for more details). The color code corresponds to the different receptor families and is the same for all subfigures.
Figure 5:
Figure 5:. Identification of potential GR modulating chemicals
(A) Correlation matrix of phenotypic profiles of seven known glucocorticoids (GC) and a subset of test chemicals with results from the primary screen. (B) Correlation matrix of the same chemicals tested in a repeated experiment. Of note, the chemicals were selected based on preliminary results. Upon re-analysis, the numbers slightly changed, leading to two chemicals not being tested in the secondary screen and one chemical being tested that didn’t pass the threshold in the final analysis. (C) Results from the orthogonal assay, qPCR, testing for changes in gene expression for GC target genes. The indicated values correspond to ΔΔCt values. A value of +1 indicates a twofold upregulation.
Figure 6:
Figure 6:. Similarity of phenotypic profiles for chemicals with structural similarity.
(A) Schematic overview of the procedure. ToxPrints were obtained for active chemicals (n=536) and used to create a dendrogram. The dendrogram was cut at a tree height of 0.6, which resulted in 234 clusters. Of these, 137 clusters contained at least two chemicals. Next, for clusters with more than two chemicals, two chemicals were selected randomly (n=274). (B) For each of these 137 chemical pairs, the biological similarity (Kendall correlation) was calculated. (C) To discern whether chemicals within a cluster are more similar than expected by chance, a randomized data set was created. For this purpose, the 274 chemicals were randomly paired 10 times, generating 1370 biological similarity values. The graph displays the biological similarity values of the randomized data set (gray) and the real data set (red). The box indicates the first and third quantile and the median, while the whiskers extend to 1.5 times the inter-quartile range. The indicated p-value above the graph was obtained from a one-sided Wilcoxon rank sum test. (D,F,G,H) Exemplary correlation matrices of selected clusters. The bottom left half displays structural similarity calculated as Jaccard similarity; the top right half displays profile similarity calculated as Kendall correlation of the 289 selected features. (E) Representative images of Hoechst-33342 labeling in U-2 OS cells treated with DMSO (0.5 %) (left panel) or 100 μM dieldrin (right panel). Differences in nucleus texture compared to control were observable in dieldrin treated cells (arrows). Scale bar is 50 μm.
Figure 7:
Figure 7:. Grouping of phenotypic profiles of all active chemicals.
(A) The profile of the third lowest active concentration for each chemical (n=547) was used for hierarchical clustering using Kendall correlation to obtain the dendrogram, which was then cut into 15 clusters. The colors in the matrix are pairwise Kendall correlations between two chemicals. (B) For each cluster, it was determined whether chemicals in the cluster were enriched in certain chemical fingerprints, activity in targeted bioassays or literature evidence for activation of stress response pathways. The bar graph indicates the number of entities that were enriched in any given cluster.
Figure 8:
Figure 8:. Case study of conazole-like chemicals.
(A) Phenotypic profiles of all active conazoles in the primary screen. For each chemical the highest active, non-cytotoxic concentration is shown. The number in parentheses indicates the test concentration in μM. Features are clustered within the respective fluorescent channels (indicated by the column colors). Hierarchical clustering was performed using Kendall correlation of profiles. (B) Correlation matrix of all active conazoles in the primary screen. Profiles of the three lowest concentrations of each chemical were compared using Kendall correlation; the displayed color indicates the value for the condition pair with the largest value. (C) Correlation matrix of all active conazoles of the follow-up study. The bottom left part displays structural similarity, as calculated with Jaccard/Tanimoto similarity. The top right part displays profile similarity, as calculated with Kendall correlation. (D) Ranked list of chemicals tested in the primary screen with the largest profile similarity with diniconazole. DTXSID are unique substance identifiers associated with ToxCast chemicals, as referenced on the CompTox Chemicals Dashboard (Williams et al., 2017). Abbreviations: conc: test concentration in μM; biol sim: biological similarity. (E) Representative images of Hoechst-33342 (blue) and multiplexed WGA-Alexa 555 and phalloidin-Alexa 568 conjugates (gold) in U-2 OS cells treated with DMSO (0.5 %), 100 μM diniconazole, 100 μM ketoconazole or 100 μM phenolphthalein (from left to right). Note that the phenotype of diniconazole is qualitatively different from that of DMSO and ketoconazole and more similar to phenolphthalein.

Similar articles

Cited by

References

    1. Adamakis I-DS, Panteris E, Eleftheriou EP, 2019. Tubulin Acetylation Mediates Bisphenol A Effects on the Microtubule Arrays of Allium cepa and Triticum turgidum. Biomolecules 9, 185. - PMC - PubMed
    1. Baltazar MT, Cable S, Carmichael PL, Cubberley R, Cull T, Delagrange M, Dent MP, Hatherell S, Houghton J, Kukic P, Li H, Lee M-Y, Malcomber S, Middleton AM, Moxon TE, Nathanail AV, Nicol B, Pendlington R, Reynolds G, Reynolds J, White A, Westmoreland C, 2020. A Next-Generation Risk Assessment Case Study for Coumarin in Cosmetic Products. Toxicological sciences : an official journal of the Society of Toxicology 176, 236–252. - PMC - PubMed
    1. Bougen-Zhukov N, Loh SY, Lee HK, Loo LH, 2017. Large-scale image-based screening and profiling of cellular phenotypes. Cytometry A 91, 115–125. - PubMed
    1. Bray MA, Singh S, Han H, Davis CT, Borgeson B, Hartland C, Kost-Alimova M, Gustafsdottir SM, Gibson CC, Carpenter AE, 2016. Cell Painting, a high-content image-based assay for morphological profiling using multiplexed fluorescent dyes. Nat Protoc 11, 1757–1774. - PMC - PubMed
    1. Breen M, Ring CL, Kreutz A, Goldsmith MR, Wambaugh JF, 2021. High-throughput PBTK models for in vitro to in vivo extrapolation. Expert Opin Drug Metab Toxicol 17, 903–921. - PMC - PubMed

Publication types

LinkOut - more resources