. 2023 Apr 12;14(1):2066.
doi: 10.1038/s41467-023-37589-4.

Embryonic keratin19+ progenitors generate multiple functionally distinct progeny to maintain epithelial diversity in the adult thymus medulla

Affiliations

Embryonic keratin19+ progenitors generate multiple functionally distinct progeny to maintain epithelial diversity in the adult thymus medulla

Beth Lucas et al. Nat Commun. .

Abstract

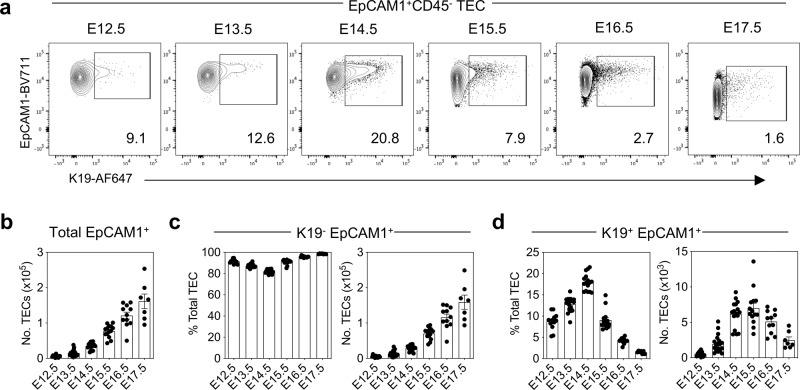
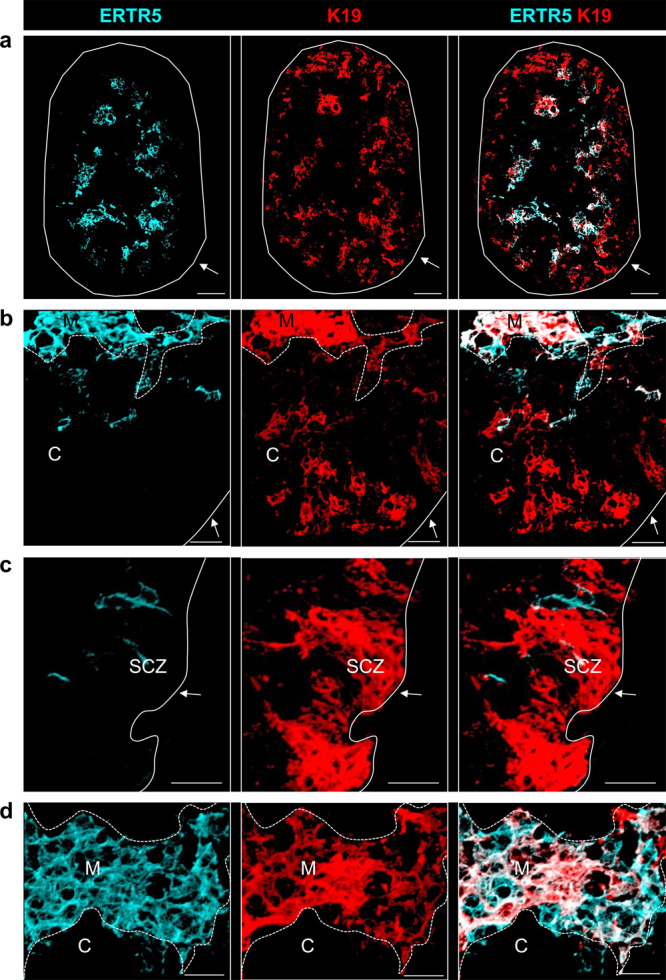
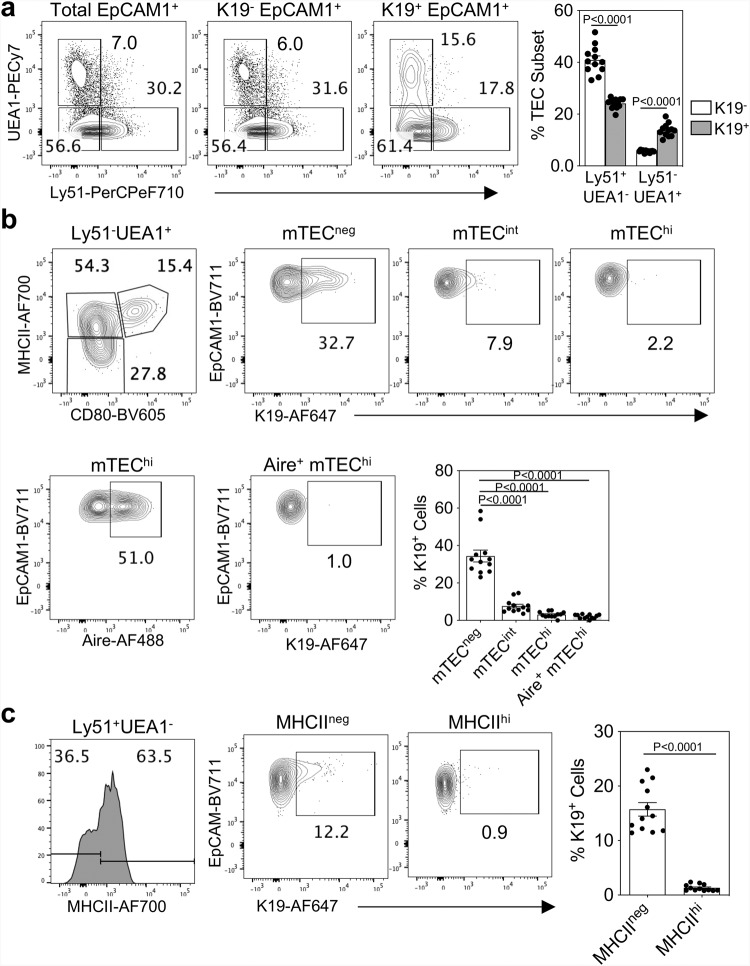
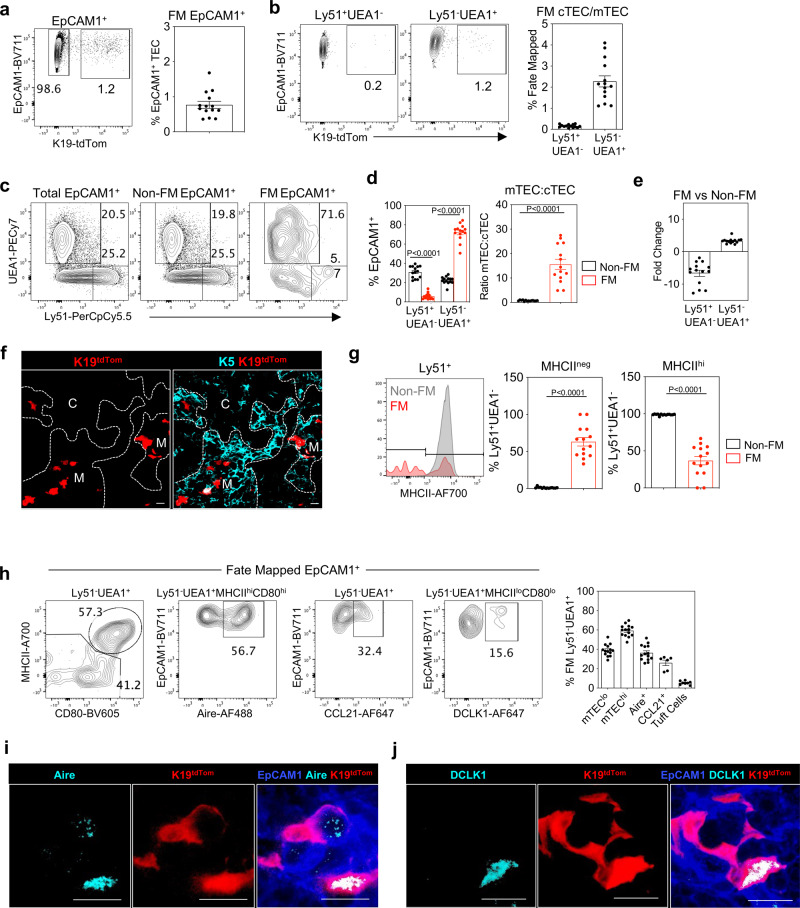
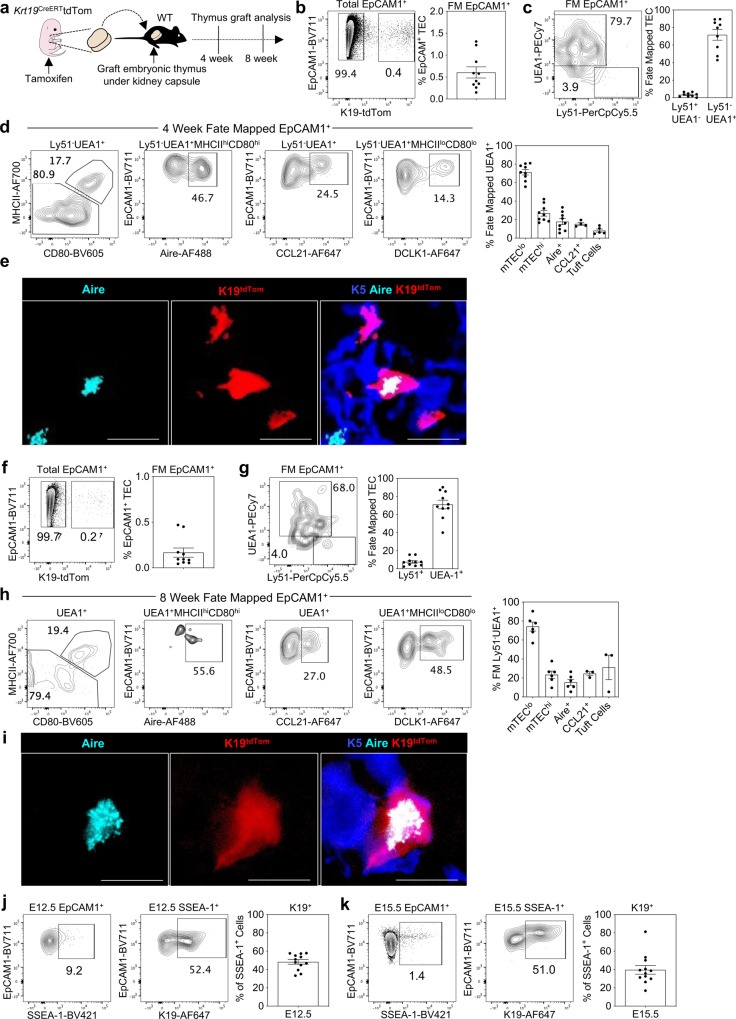
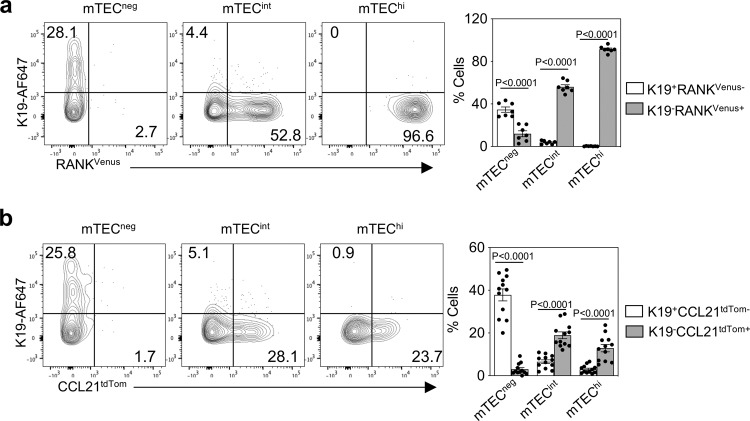
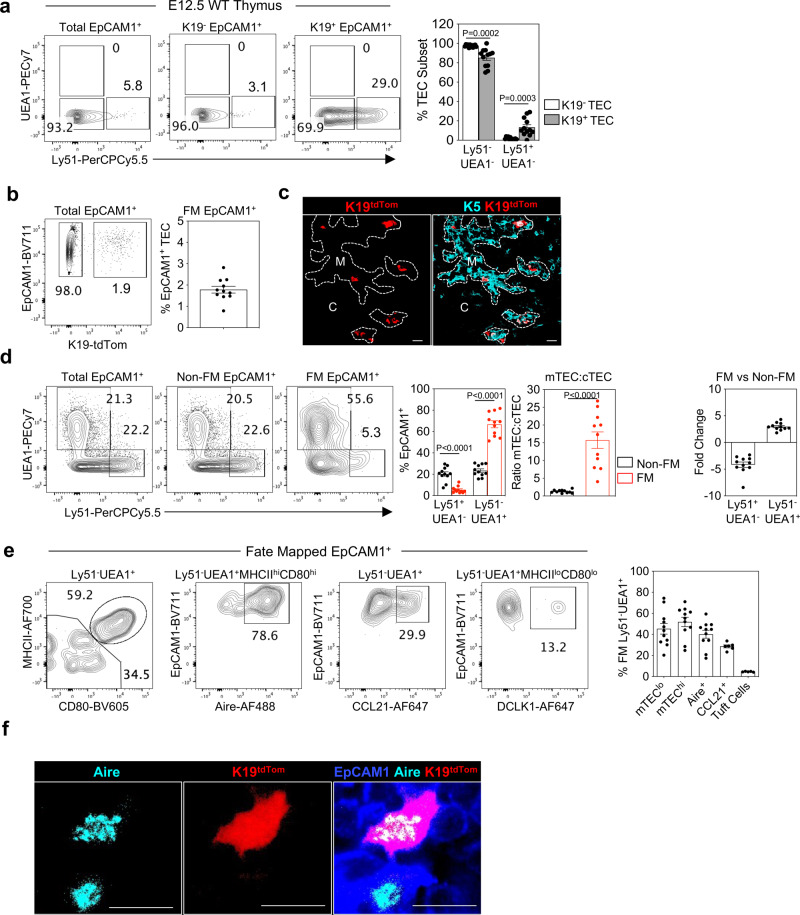
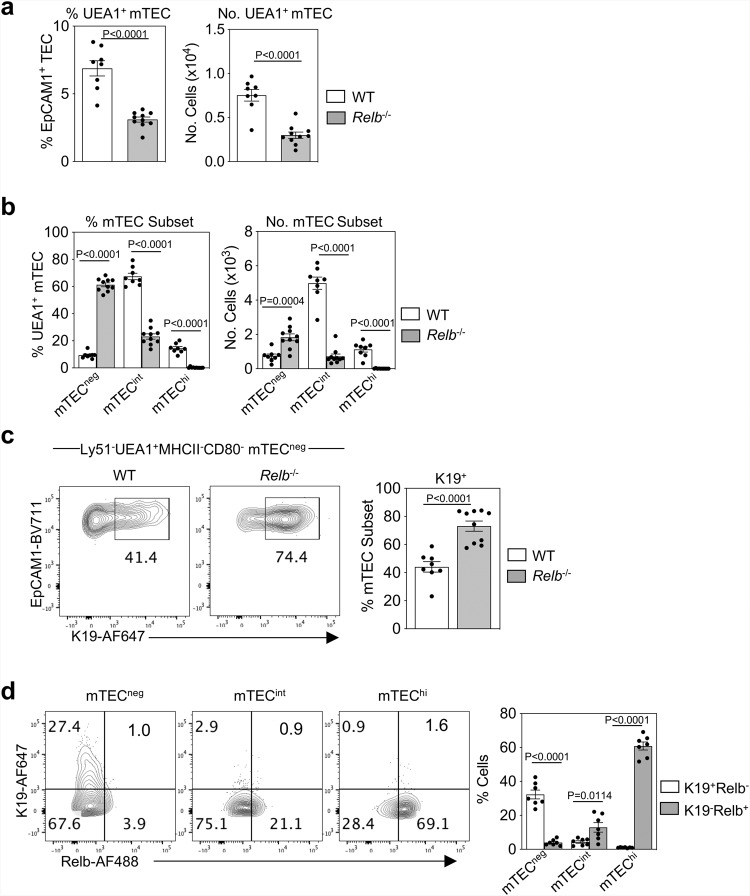
The thymus medulla is a key site for immunoregulation and tolerance, and its functional specialisation is achieved through the complexity of medullary thymic epithelial cells (mTEC). While the importance of the medulla for thymus function is clear, the production and maintenance of mTEC diversity remains poorly understood. Here, using ontogenetic and inducible fate-mapping approaches, we identify mTEC-restricted progenitors as a cytokeratin19+ (K19+) TEC subset that emerges in the embryonic thymus. Importantly, labelling of a single cohort of K19+ TEC during embryogenesis sustains the production of multiple mTEC subsets into adulthood, including CCL21+ mTEClo, Aire+ mTEChi and thymic tuft cells. We show K19+ progenitors arise prior to the acquisition of multiple mTEC-defining features including RANK and CCL21 and are generated independently of the key mTEC regulator, Relb. In conclusion, we identify and define a multipotent mTEC progenitor that emerges during embryogenesis to support mTEC diversity into adult life.


Conflict of interest statement

The authors declare no competing interests.

Figures

Fig. 1
Fig. 1. K19 is expressed by a subset of embryonic TEC.
a Representative FACS plots showing expression of K19 by EpCAM1+ cells during ontogeny. b Numbers of total EpCAM1+ cells. c Numbers and proportions of K19- EpCAM1+ cells. d Numbers and proportion of K19+ EpCAM1+ cells (E12.5 n = 12, E13.5 n = 20, E14.5 n = 16, E15.5 n = 15, E16.5 n = 11, E17.5 n = 7, from three independent experiments per gestational age). The data are shown as mean ± SEM.
Fig. 2
Fig. 2. K19+ TEC are widely distributed within thymic microenvironments.
a Immunofluorescence of an E15.5 thymus lobe stained for ERTR5 (turquoise) and K19 (red), Scale bar, 50 µm. b K19 expression within ERTR5- cortical regions. Scale bar, 20 µm. c K19 expression within the subcapsular zone. d K19 expression within ERTR5+ medullary areas. Scale bars in bd, 20 m. SCZ subcapsular zone, C cortex, M medulla. Solid white lines indicate the edge of the thymus; dashed white lines indicate the boundary between cortex and medulla. Images are representative of 6 thymi, from 3 independent experiments.
Fig. 3
Fig. 3. K19 is specific to immature MHCIIneg stages of TEC development.
a Representative FACS plots showing expression of UEA1 and Ly51 by total EpCAM1+ cells, K19-EpCAM1+ cells and K19+EpCAM1+ cells at E15.5, and corresponding quantitation (n = 12, from 3 independent experiments). Data analysed using a Student’s t-test. b Representative FACS plots showing expression of MHCII and CD80 to define mTECneg (MHCII-CD80-), mTECint (MHCIIintCD80int) and mTEChi (MHCIIhiCD80hi), and the corresponding expression of K19 by these subsets (upper panel), and expression of Aire within mTEChi, and the corresponding expression of K19 by Aire+ mTEChi (lower panel). Bar chart shows proportion of K19+ cells within mTECneg, mTECint, and mTEChi at E15.5 (n = 12, from 3 independent experiments). Data analysed using a one-way ANOVA, with Bonferroni post hoc test. c Representative FACS plots showing expression of MHCII within UEA1-Ly51+ cells, and expression of K19 by these subpopulations. Bar chart shows proportion of K19+ cells within MHCII-UEA1-Ly51+ and MHCII+UEA1-Ly51+ TEC at E15.5 (n = 12, from 3 independent experiments). Data analysed using a Student’s t test. The data are shown as mean ± SEM.
Fig. 4
Fig. 4. K19 identifies embryonic multipotent mTEC progenitors (mmTECp).
a K19Cre was induced in Krt19CreERTtdTom embryos at E15.5 via the administration of tamoxifen to pregnant mice, and fate-mapped thymi were harvested at PNd0 (n = 14, from 3 independent experiments). Fate-mapped cells were detected within EpCAM1+ cells by flow cytometry and quantitated. b Representative FACS plots and quantitation of K19-tdTom fate-mapped cells within EpCAM1+UEA1+ and EpCAM1+Ly51+ TEC. c Expression of Ly51 and UEA1 by total EpCAM1+ cells, K19-tdTom- EpCAM1+ cells (non-fate-mapped) and K19-tdTom+EpCAM1+ cells (fate-mapped). d Bar charts show proportions of Ly51+UEA1- and Ly51-UEA1+ cells, and mTEC:cTEC ratio within non-fate-mapped and fate-mapped TEC. e Bar chart shows fold change in Ly51+UEA1- and Ly51-UEA1+ cells within non-fate-mapped and fate-mapped TEC. f Immunofluorescence of PNd0 thymi following K19-fate-mapping at E15.5. K19-tdTom (red) and K5 (turquoise). ‘C’, and ‘M’ indicate cortex and medullary areas respectively. Scale bar denotes 20 μm. Image representative of 4 thymi. g Expression of MHCII by EpCAM1+Ly51+ fate-mapped (FM) or non-fate-mapped (Non-FM) TEC. h Representative FACS plots illustrating the phenotype of fate-mapped mTEC subsets. mTEChi (MHCIIhiCD80hi, n = 14), mTEClo (MHCIIloCD80lo, n = 14), Aire+ (MHCIIhiCD80hiAire+, n = 14), CCL21+ (n = 6), tuft cells (MHCIIloCD80loDCLK1+, n = 8), and corresponding quantitation. i, j Immunofluorescence of PNd0 thymi where K19Cre was induced at E15.5. Scale bar denotes 10 μm. Image representative of 4 thymi, from 3 independent experiments. K19-tdTom (red), EpCAM1 (blue), f Aire (turquoise), g DCLK1 (turquoise). Data analysed using a Student’s t test. The data are shown as mean ± SEM.
Fig. 5
Fig. 5. Sustained generation of mTEC diversity from embryonic K19+ mmTECp.
a K19Cre was induced in Krt19CreERTtdTom embryos at E15.5 and after 24 h thymi were grafted under the kidney capsule of WT mice. Thymus grafts were harvested at the equivalent of postnatal week 4 and 8. b At 4 weeks, fate-mapped cells were detected within EpCAM1+ cells by flow cytometry and quantitated (n = 9, from 4 independent experiments). c Representative FACS plots and quantitation of K19-tdTom fate-mapped cells at 4 weeks within EpCAM1+UEA1+ and EpCAM1+Ly51+ TEC. d Representative FACS plots illustrating the phenotype of fate-mapped mTEC subsets within fate-mapped thymus grafts at postnatal week 4. mTEChi (MHCIIhiCD80hi, n = 9), mTEClo (MHCIIloCD80lo, n = 9), Aire+ (MHCIIhiCD80hiAire+, n = 9), CCL21+ (n = 4) and tuft cells (MHCIIloCD80loDCLK1+, n = 5), and corresponding quantitation. e Immunofluorescence of fate-mapped thymi at postnatal week 4, Aire (turquoise) K19-tdTom (red), K5 (blue). Scale bar denotes 10 μm. Image representative of 3 grafts. f At 8 weeks, fate-mapped cells were detected within EpCAM1+ cells by flow cytometry and quantitated (n = 10, from 4 independent experiments). g Representative FACS plots and quantitation of K19-tdTom fate-mapped cells at 8 weeks within EpCAM1+UEA1+ and EpCAM1+Ly51+ TEC. h Representative FACS plots illustrating the phenotype of fate-mapped mTEC subsets within fate-mapped thymus grafts at postnatal week 8. mTEChi (MHCIIhiCD80hi, n = 8), mTEClo (MHCIIloCD80lo, n = 8), Aire+ (MHCIIhiCD80hiAire+, n = 8), CCL21+ (n = 5) and tuft cells (MHCIIloCD80loDCLK1+, n = 4), and corresponding quantitation. i Immunofluorescence of fate-mapped thymi at postnatal week 8, Aire (turquoise) K19-tdTom (red), K5 (blue). Scale bar, 10 µm. Image representative of 3 grafts, from 3 independent experiments. j Representative FACS plots of SSEA1 and K19 expression at E12.5 ( j) and E15.5 (k), and quantitation of K19+ SSEA-1+ TEC (n = 12 for both stages, from 3 independent experiments). The data are shown as mean ± SEM.
Fig. 6
Fig. 6. K19+ TEC appear prior to RANK and CCL21 stages of mTEC development.
a Representative FACS plots showing expression of K19 and RANKVenus by mTECneg (MHCII-CD80-), mTECint (MHCIIintCD80int) and mTEChi (MHCIIhiCD80hi) at E15.5, and corresponding quantitation, n = 7, from 3 independent experiments. b Representative FACS plots showing expression of K19 and CCL21tdTom by mTECneg (MHCII-CD80-), mTECint (MHCIIintCD80int) and mTEChi (MHCIIhiCD80hi) at E15.5, and corresponding quantitation, n = 12, from 3 independent experiments. Data analysed using a Student’s t test. The data are shown as mean ± SEM.
Fig. 7
Fig. 7. K19+ mmTECp are present at E12.5 of development.
a Representative FACS plots showing expression of UEA1 and Ly51 by total EpCAM1+ cells, K19-EpCAM1+ cells and K19+EpCAM1+ cells at E12.5, and corresponding quantitation, n = 12, from 3 independent experiments. b Krt19CreERTtdTom embryos were fate-mapped via tamoxifen administration at E12.5, and the neonatal thymus was harvested at birth. Fate-mapped cells were quantitated (n = 11, from 3 independent experiments) c Immunofluorescence of fate-mapped thymi at PNd0, K5 (turquoise) K19-tdTom (red), Scale bar denotes 20um. Image representative of 4 thymi, from 3 independent experiments. d Expression of Ly51 and UEA1 by total EpCAM1+ cells, K19-Tom- EpCAM1+ cells (non-fate-mapped), and K19-tdTom+EpCAM1+ cells (fate-mapped) at PNd0, bar charts show corresponding quantitation, n = 11, from 3 independent experiments. e Representative FACS plots illustrating the phenotype of fate-mapped mTEC subsets within PNd0 fate-mapped thymus. mTEChi (MHCIIhiCD80hi, n = 11), mTEClo (MHCIIloCD80lo, n = 11), Aire+ (MHCIIhiCD80hiAire+, n = 11), CCL21+ (n = 6) and tuft cells (MHCIIloCD80loDCLK1+, n = 5) and corresponding quantitation. f Immunofluorescence of fate-mapped thymi at PNd0, Aire (turquoise) K19-tdTom (red), EpCAM1 (blue). Scale bar,10 µm. Image representative of 4 thymi. Data analysed using a Student’s t test. The data are shown as mean ± SEM.
Fig. 8
Fig. 8. K19+ mmTECp are upstream and independent of Relb-dependent mTEC stages.
a Proportions and numbers of Ly51-UEA1+ mTEC in E15.5 WT and Relb-/- thymus. b Proportions and numbers of MHCII-CD80- mTECneg, MHCIIintCD80- mTECint, MHCIIhiCD80hi mTEChi in E15.5 WT and Relb-/- thymus. c Representative FACS plots and corresponding quantitation showing K19 expression within Ly51-UEA1+MHCII-CD80-mTECneg in WT and Relb-/- thymi at E15.5. ac WT n = 8, Relb-/- n = 11, from 3 independent experiments. d Representative FACS plots showing expression of K19 and Relb by mTECneg, mTECint and mTEChi in WT E15.5 thymi, and corresponding quantitation, n = 7, from 3 independent experiments. Data analysed using a Student’s t test. The data are shown as mean ± SEM.
Fig. 9
Fig. 9. CD9 expression defines mmTECp in wild-type mice.
ac Infinity Flow analysis was used to impute the expression of surface markers on TEC (CD45-EpCAM1+) derived from thymi of E15.5 WT embryos. a Hierarchical clustering analysis was performed on 121832 TEC and projected in a two-dimensional space using UMAP. Each colour represents a specific cluster as indicated. b Heatmap displays the expression of the top 5 markers upregulated in each cluster (log fold-change >0.15). Backbone markers have a blue font. c UMAP graphs and violin plots illustrating the expression of K19 and CD9. d UMAP graphs and violin plots illustrating the expression of UEA1, Ly51 and MHCII. Colour gradient indicates expression levels in the UMAP graphs and colours in the violin plots represent the different clusters, as defined in a. e Representative FACS plots showing expression of K19 by MHCIIloCD9hi TEC and corresponding quantitation, n = 12, from 3 independent experiments. The data are shown as mean ± SEM.

Similar articles

Cited by

References

    1. Takahama Y, Ohigashi I, Baik S, Anderson G. Generation of diversity in thymic epithelial cells. Nat. Rev. Immunol. 2017;17:295–305. doi: 10.1038/nri.2017.12. - DOI - PubMed
    1. Kadouri N, Nevo S, Goldfarb Y, Abramson J. Thymic epithelial cell heterogeneity: TEC by TEC. Nat. Rev. Immunol. 2020;20:239–253. doi: 10.1038/s41577-019-0238-0. - DOI - PubMed
    1. Kozai M, et al. Essential role of CCL21 in establishment of central self-tolerance in T cells. J. Exp. Med. 2017;214:1925–1935. doi: 10.1084/jem.20161864. - DOI - PMC - PubMed
    1. James KD, et al. Medullary stromal cells synergize their production and capture of CCL21 for T-cell emigration from neonatal mouse thymus. Blood Adv. 2021;5:99–112. doi: 10.1182/bloodadvances.2020003192. - DOI - PMC - PubMed
    1. Anderson MS, et al. The cellular mechanism of Aire control of T cell tolerance. Immunity. 2005;23:227–239. doi: 10.1016/j.immuni.2005.07.005. - DOI - PubMed

Publication types

LinkOut - more resources