. 2023 Apr 12;14(1):2057.
doi: 10.1038/s41467-023-37632-4.

Targeting neuronal lysosomal dysfunction caused by β-glucocerebrosidase deficiency with an enzyme-based brain shuttle construct

Affiliations

Targeting neuronal lysosomal dysfunction caused by β-glucocerebrosidase deficiency with an enzyme-based brain shuttle construct

Alexandra Gehrlein et al. Nat Commun. .

Abstract

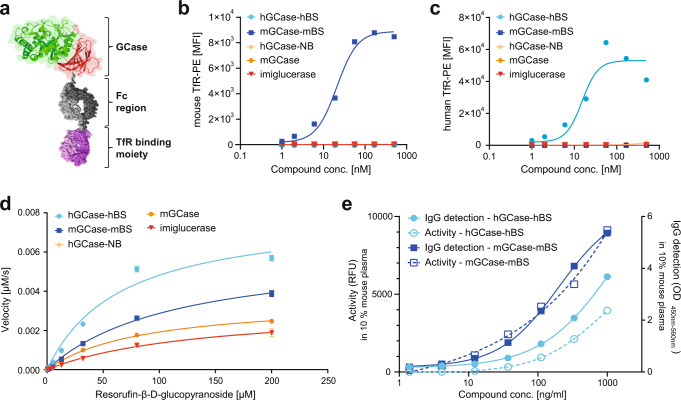
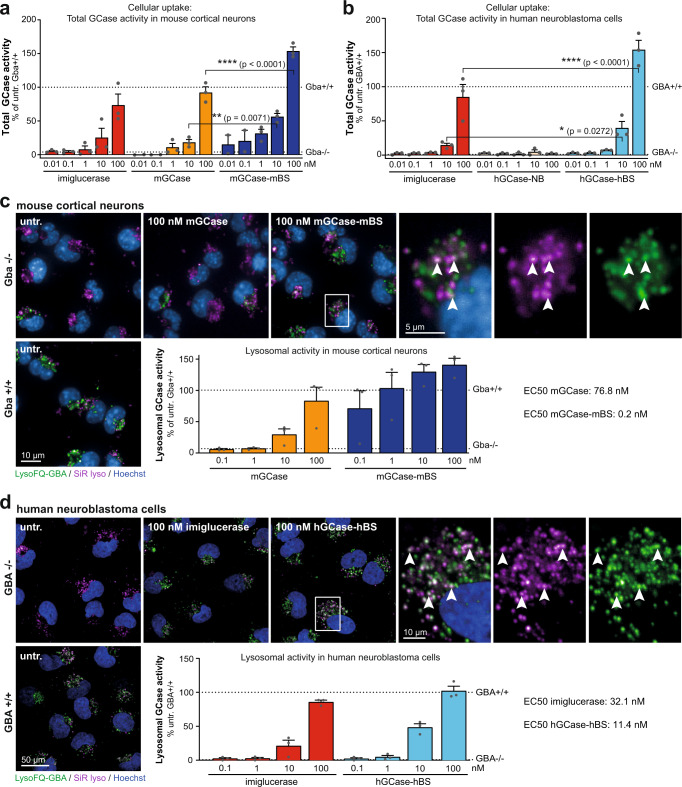
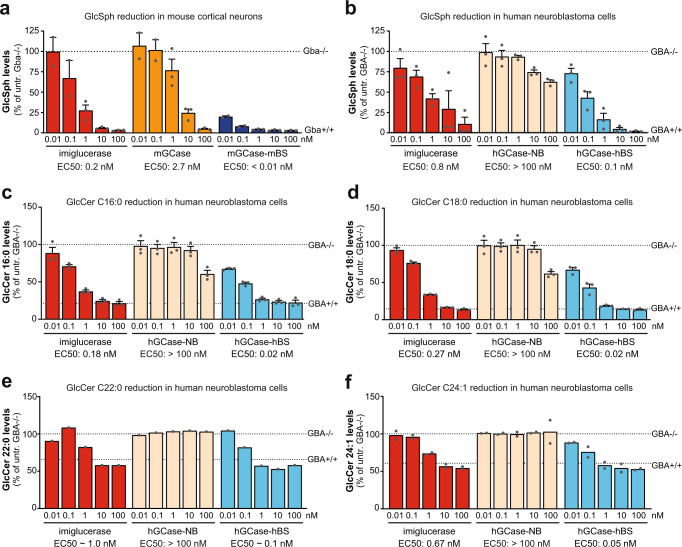
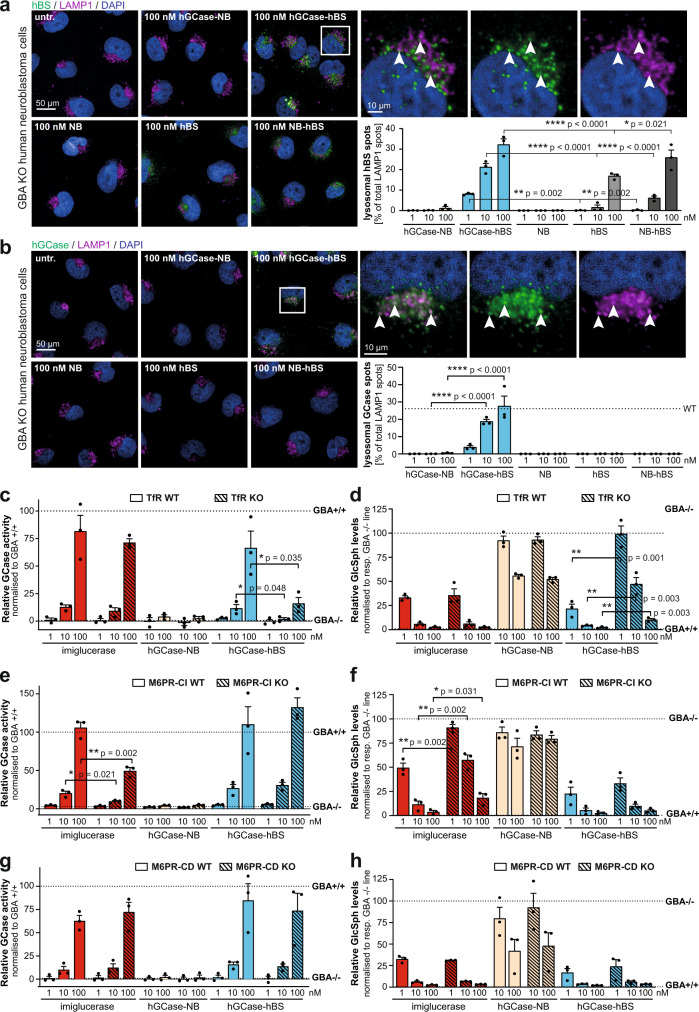
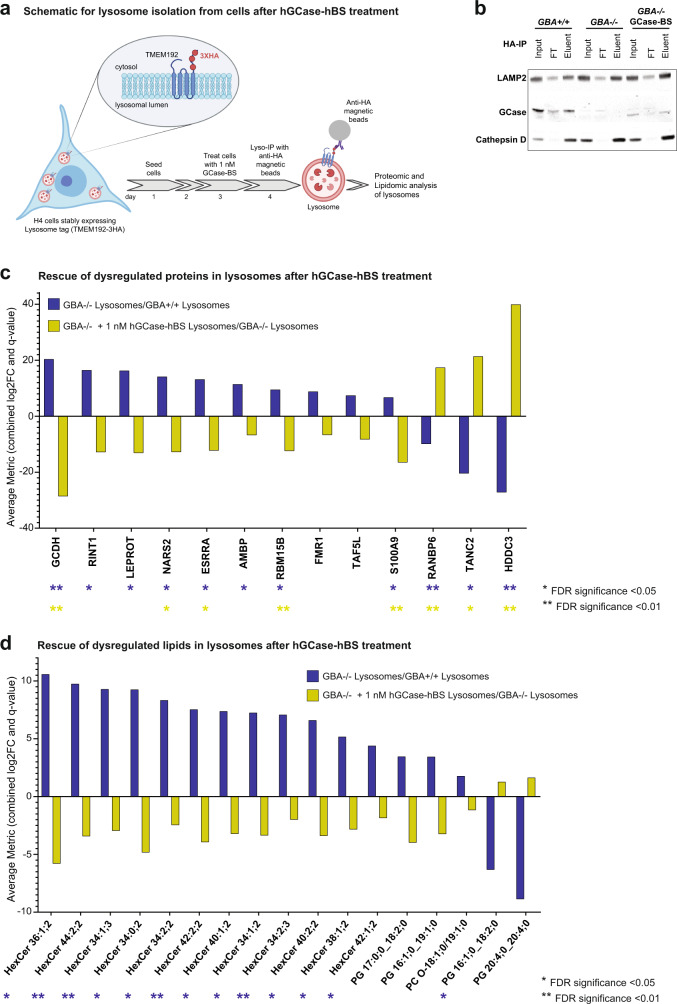
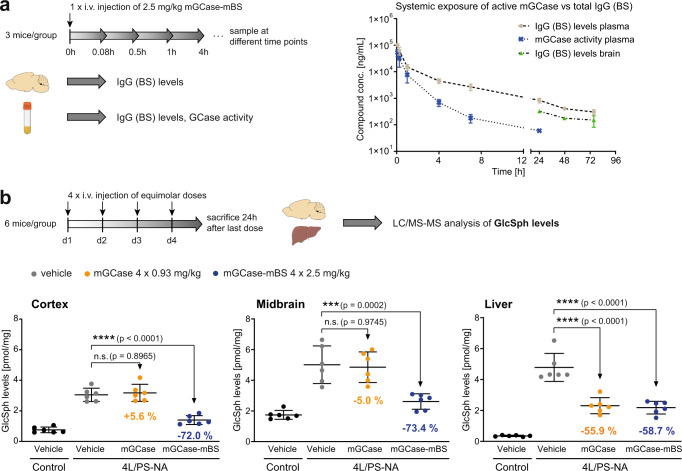
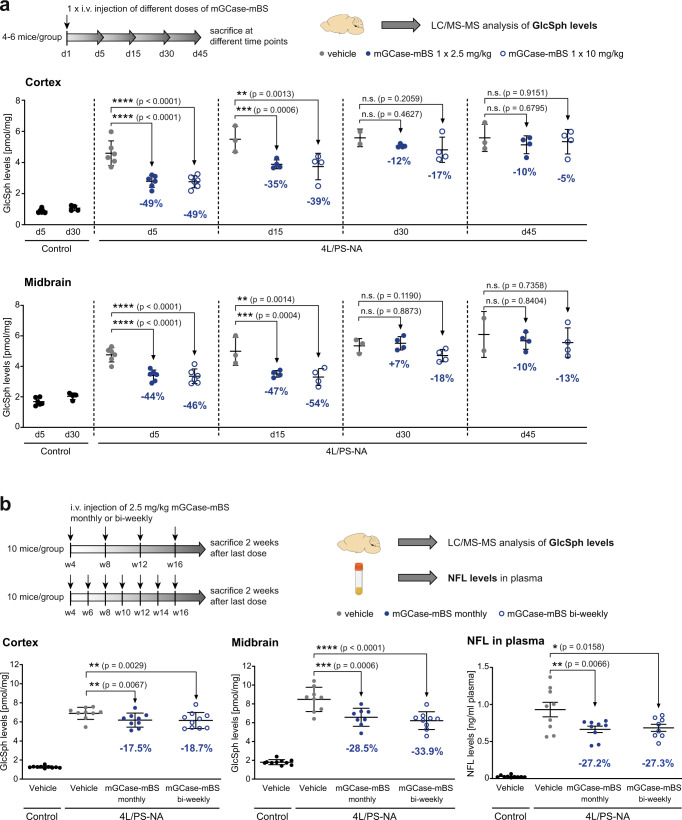
Mutations in glucocerebrosidase cause the lysosomal storage disorder Gaucher's disease and are the most common risk factor for Parkinson's disease. Therapies to restore the enzyme's function in the brain hold great promise for treating the neurological implications. Thus, we developed blood-brain barrier penetrant therapeutic molecules by fusing transferrin receptor-binding moieties to β-glucocerebrosidase (referred to as GCase-BS). We demonstrate that these fusion proteins show significantly increased uptake and lysosomal efficiency compared to the enzyme alone. In a cellular disease model, GCase-BS rapidly rescues the lysosomal proteome and lipid accumulations beyond known substrates. In a mouse disease model, intravenous injection of GCase-BS leads to a sustained reduction of glucosylsphingosine and can lower neurofilament-light chain plasma levels. Collectively, these findings demonstrate the potential of GCase-BS for treating GBA1-associated lysosomal dysfunction, provide insight into candidate biomarkers, and may ultimately open a promising treatment paradigm for lysosomal storage diseases extending beyond the central nervous system.


Conflict of interest statement

The following authors have been employed at or collaborated with F. Hoffmann-La Roche AG while working on this project: Alexandra Gehrlein, Vinod Udayar, Nadia Anastasi, Martino Luca Morella, Iris Ruf, Doris Brugger, Sophia von der Mark, Ralf Thoma, Arne Rufer, Dominik Heer, Nina Pfahler, Anton Jochner, Jens Niewoehner, Luise Wolf, Matthias Fueth, Martin Ebeling, Roberto Villaseñor, Yanping Zhu, Matthew C. Deen, Xiaoyang Shan, Zahra Ehsaei, Verdon Taylor, Ellen Sidransky, David J. Vocadlo, Per-Ola Freskgård, Ravi Jagasia. All authors declare no further competing interests.

Figures

Fig. 1
Fig. 1. Purified GCase-BS molecules are fully functional.
a Schematic of GCase-BS depicting different moieties: GCase domain II is shown in red, domain III in green, domain I is hidden behind domain III in this view. The human IgG1 Fc part of the Brain Shuttle is shown in grey, the TfR binding Fab is depicted in purple. b Assessment and specificity of murine TfR binding of the various GCase(-BS) molecules by FACS analysis of mTfR-expressing cells. Representative data of 2 biological replicates. c Assessment and specificity of human TfR binding of the various GCase(-BS) molecules by FACS analysis of hTfR-expressing cells. Representative data of 2 biological replicates. d Enzymatic activity of various GCase(-BS) molecules at an enzyme concentration of 25 nM (Michaelis-Menten kinetics). Activity was measured over time using different concentrations of resorufin-β-glucopyranoside. n = 3 independent measurements. e Enzymatic activity and IgG levels measured for both mGCase-mBS and hGCase-hBS after 15 min incubation in 10% mouse plasma. n = 2 independent measurements. Source data are provided as a Source Data file.
Fig. 2
Fig. 2. The Brain Shuttle module improves cellular uptake and lysosomal activity in vitro.
a Total GCase activity in mouse cortical neurons as a measure of cellular uptake after 2 h of treatment with imiglucerase, mGCase or mGCase-mBS. Data was normalised to Gba + /+ cells. n = 3 (for mGCase and mGCase-mBS, the two lowest concentrations have only been repeated twice). b Total GCase activity in H4 cells as a measure of cellular uptake after 2 h of treatment with imiglucerase, hGCase-hBS-NB or hGCase-hBS. Data was normalised to GBA + / + cells. n = 3. c Live imaging of GCase activity (LysoFQ-GBA) and lysosomes (SiR lyso) and quantification of colocalising signal in mouse cortical neurons. Data was normalised to Gba + /+ cells. n = 3 (4–9 fields analysed per plate). d Live imaging of GCase activity (LysoFQ-GBA) and lysosomes (SiR lyso) and quantification of colocalising signal in H4 cells. Data was normalised to GBA + / + cells. n = 3 (8–16 fields analysed per plate). Bar graphs represent group means + SEM. Each data point represents an independent measurement. Activity data were analysed by two-way ANOVA (Tukey’s multiple comparisons test). *p < 0.05; **p < 0.01; ***p < 0.001; ****p < 0.0001. n = number of independent measurements. Source data are provided as a Source Data file.
Fig. 3
Fig. 3. The Brain Shuttle module improves the breakdown of GlcSph and multiple GlcCer isomers in vitro.
a GlcSph measurement in mouse cortical neurons as a measure of efficacy after 48 h of treatment with imiglucerase, mGCase or mGCase-mBS. Data was normalised to Gba−/− cells. n = 3. b GlcSph measurement in H4 cells as a measure of catalytic efficacy after 48 h of treatment with imiglucerase, hGCase-NB or hGCase-hBS. Data was normalised to GBA−/− cells. n = 3. c GlcCer C16:0 measurement in H4 cells as a measure of catalytic efficacy after 48 h of treatment with imiglucerase, hGCase-NB or hGCase-hBS. n = 3. d GlcCer C18:0 measurement in H4 cells as a measure of catalytic efficacy after 48 h of treatment with imiglucerase, hGCase-NB or hGCase-hBS. n = 3. e GlcCer C22:0 measurement in H4 cells as a measure of catalytic efficacy after 48 h of treatment with imiglucerase, hGCase-NB or hGCase-hBS. n = 1. f GlcCer C24:1 measurement in H4 cells as a measure of catalytic efficacy after 48 h of treatment with imiglucerase, hGCase-NB or hGCase-hBS. n = 2. Bar graphs represent group means + SEM. Each data point represents an independent measurement. n = number of independent measurements. Source data are provided as a Source Data file.
Fig. 4
Fig. 4. GCase-BS lysosomal mode of action in vitro.
a Immunolabeling of hBS and colocalisation with LAMP1 upon acute treatment with various constructs. White arrows indicate some colocalising spots. Colocalising hBS spots were quantified and normalised to total amount of LAMP1 spots. n = 3. b Immunolabeling of hGCase and colocalisation with LAMP1 upon acute treatment with various constructs. White arrows indicate some colocalising spots. Colocalising GCase spots were quantified and normalised to total amount LAMP1 spots. n = 3. c Total GCase activity in GBA-deficient TfR WT and TfR KO neuroblastoma lines as a measure of cellular uptake after 2 h of treatment. Data was normalised to GB+/+ cells. n = 3. d GlcSph measurement in GBA-deficient TfR WT and TfR KO neuroblastoma lines upon 48 h of treatment. Data was normalised to respective GBA−/− cells. n = 3. e Total GCase activity in GBA-deficient M6PR-CI WT and M6PR-CI KO neuroblastoma lines as a measure of cellular uptake after 2 h of treatment. Data was normalised to GBA+/+ cells. n = 3. f GlcSph measurement in GBA-deficient M6PR-CI WT and M6PR-CI KO neuroblastoma lines upon 48 h of treatment. Data was normalised to respective GBA−/− cells. n = 3. g Total GCase activity in GBA-deficient M6PR-CD WT and M6PR-CD KO neuroblastoma lines as a measure of cellular uptake after 2 h of treatment. Data was normalised to GB+/+ cells. n = 3. h GlcSph measurement in GBA-deficient M6PR-CD WT and M6PR-CD KO neuroblastoma lines upon 48 h of treatment. Data was normalised to respective GBA−/− cells. n = 3. Bar graphs represent group means + SEM. Each data point represents an independent measurement. Data were analysed by Student’s two-tailed t-test comparing WT and KO of each receptor for each treatment. *p < 0.05; **p < 0.01; ***p < 0.001. If not stated otherwise, n = number of independent measurements. Source data are provided as a Source Data file.
Fig. 5
Fig. 5. hGCase-hBS reverts lysosomal protein and lipid dysregulation in H4 GBA-/- cells.
a Scheme for hGCase-hBS treatment and lysosome isolation from cells. H4 cells expressing lysosome-tag (TMEM192-3HA) were treated with 1 nM hGCase-hBS for 24 h, followed by cell lysis and lysosome isolation using anti-HA coated magnetic beads. Schematic created with BioRender.com. b Validation of lysosome enrichment after TMEM192-3HA-based Lyso-IP. Western blots showing enrichment of lysosomes after Lyso- IP as demonstrated by enrichment of bonafide lysosomal proteins LAMP2, Cathepsin D and GCase in eluent fraction compared to input. GCase is detectable in lysosomes 24 h after treatment of GBA−/− cells. Representative blots of 3 replicates. c Rescue of dysregulated lysosomal proteins upon hGCase-hBS treatment. Graph showing increased or decreased levels of lysosomal proteins in GBA−/− cells (blue bar) and its rescue upon hGCase-hBS treatment (yellow bar). d Rescue of dysregulated lysosomal lipids upon hGCase-hBS treatment. Graph showing increased or decreased levels of lysosomal lipid species in GBA−/− cells (blue bar) and its rescue upon hGCase-hBS treatment (yellow bar). Note: The lipid analysis performed does not report the number of carbons in the sphingoid base and the acyl chain (fatty acid chain) separately. Hence, the first number in the nomenclature used refers to the total number of carbons (sphingoid base + acyl chain). An Excel sheet consisting of each of the detected lipid species and its corresponding Swisslipids ID is provided in Supplementary Data File 3. FDR-corrected p-values are shown in (c) and (d) (**q-value <0.01; *q-value <0.05; n = 3 independent measurements), calculated for each contrast separately. Trends are also displayed (e.g. significance found in one contrast only), to highlight potential lipid/protein entities with opposite fold change in GBA−/− and rescue upon hGCase-hBS treatment. Source data are provided as a Source Data file. Schematics created with BioRender.com.
Fig. 6
Fig. 6. GCase-BS proof of concept in vivo.
a PK study in Gba+/+ mice to assess systemic exposure of mGCase-mBS in plasma and brain. n = 3 mice/group. b Multi-dose PD study in 4 L/PS-NA mice to compare equimolar doses of mGCase vs. mGCase-mBS. GlcSph levels were measured in cortex, midbrain and liver. n = 6 mice/group. Data are represented as group mean +/− SEM. Data was analysed by one-way ANOVA (Dunnett’s multiple comparisons test) comparing each treatment group to 4 L/PS-NA, vehicle. n.s. p > 0.05; ****p < 0.0001. Source data are provided as a Source Data file. Schematics created with BioRender.com.
Fig. 7
Fig. 7. GCase-BS longitudinal effects in vivo.
a Single-dose PD study in 4 L/PS-NA mice to inform about duration of GlcSph lowering in cortex and midbrain. GlcSph levels rebounce between 15–30 days post administration. n = 4–6 mice/group. b Chronic study in 4 L/PS-NA mice with monthly or bi-weekly dosing frequency. GlcSph levels in cortex and midbrain as efficiency readout. NFL levels in plasma as readout for neurodegeneration. n = 10 mice/group. Data are represented as group means +/− SEM. Data was analysed by one-way ANOVA (Dunnett’s multiple comparisons test) comparing each treatment group to 4 L/PS-NA, vehicle. n.s. p > 0.05; *p < 0.05; **p < 0.01; ***p < 0.001; ****p < 0.0001. Source data are provided as a Source Data file. Schematics created with BioRender.com.

References

    1. Braulke T, Bonifacino JS. Sorting of lysosomal proteins. Biochim. Et. Biophys. Acta Bba - Mol. Cell Res. 2009;1793:605–614. doi: 10.1016/j.bbamcr.2008.10.016. - DOI - PubMed
    1. Boustany R-MN. Lysosomal storage diseases—the horizon expands. Nat. Rev. Neurol. 2013;9:583–598. doi: 10.1038/nrneurol.2013.163. - DOI - PubMed
    1. Orvisky E, et al. Glucosylsphingosine accumulation in tissues from patients with Gaucher disease: correlation with phenotype and genotype. Mol. Genet. Metab. 2002;76:262–270. doi: 10.1016/S1096-7192(02)00117-8. - DOI - PubMed
    1. Nilsson O, Månsson J-E, Håkansson G, Svennerholm L. The occurrence of psychosine and other glycolipids in spleen and liver from the three major types of gaucher’s disease. Biochim. Et. Biophys. Acta Bba - Lipids Lipid Metab. 1982;712:453–463. doi: 10.1016/0005-2760(82)90272-7. - DOI - PubMed
    1. Ferraz MJ, et al. Lysosomal glycosphingolipid catabolism by acid ceramidase: formation of glycosphingoid bases during deficiency of glycosidases. Febs. Lett. 2016;590:716–725. doi: 10.1002/1873-3468.12104. - DOI - PubMed