. 2023 Apr 12;14(1):1866.
doi: 10.1038/s41467-023-37575-w.

Peripersonal encoding of forelimb proprioception in the mouse somatosensory cortex

Affiliations

Peripersonal encoding of forelimb proprioception in the mouse somatosensory cortex

Ignacio Alonso et al. Nat Commun. .

Abstract

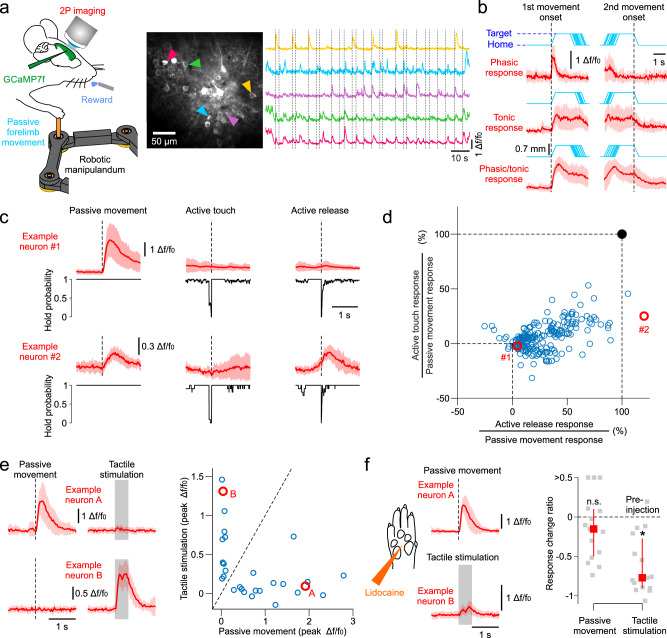
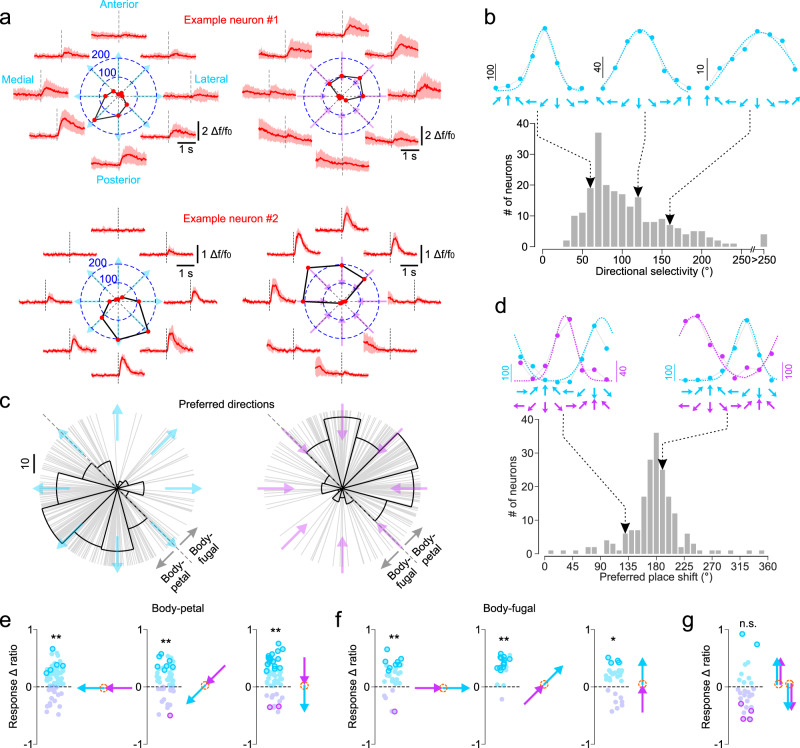
Conscious perception of limb movements depends on proprioceptive neural responses in the somatosensory cortex. In contrast to tactile sensations, proprioceptive cortical coding is barely studied in the mammalian brain and practically non-existent in rodent research. To understand the cortical representation of this important sensory modality we developed a passive forelimb displacement paradigm in behaving mice and also trained them to perceptually discriminate where their limb is moved in space. We delineated the rodent proprioceptive cortex with wide-field calcium imaging and optogenetic silencing experiments during behavior. Our results reveal that proprioception is represented in both sensory and motor cortical areas. In addition, behavioral measurements and responses of layer 2/3 neurons imaged with two-photon microscopy reveal that passive limb movements are both perceived and encoded in the mouse cortex as a spatial direction vector that interfaces the limb with the body's peripersonal space.


Conflict of interest statement

The authors declare no competing interests.

Figures

Fig. 1
Fig. 1. Forelimb proprioceptive afferents ascend to the mouse cortex via the cuneo-thalamic pathway.
a Genetically restricted labeling of proprioceptive afferents from forelimb muscles with AAV9-flex-tdTomato in PV-Cre;Ai32 mice. b Confirmation of labeled PV+ cell bodies of primary sensory neurons in the cervical DRG (arrows). c Central branches of the labeled pseudo-unipolar DRG neurons terminate in the ECu. d Retrograde labeling of cuneo-thalamic projections with AAVretro-tdTomato and AAVretro-GFP injections in PO and VPL of the sensory thalamus. e Labeled thalamus projecting neurons are found in both Cu and ECu. Similar results were obtained in N = 3 mice.
Fig. 2
Fig. 2. Cortex-wide imaging of neural activity during proprioceptive stimulation of the mouse forelimb.
a Schematic of the macroscope (D1, D2: dichroic mirrors) for wide-field imaging of Ca2+ dependent cortical activity in Rasgrf2-dCre; Ai148 mice during passive forelimb displacements with a robotic manipulandum. b Trial timeline of the passive forelimb displacement task (split dotted lines denote different trial outcomes). c Normalized mean cortical activation maps (n = 7 mice) in the contralateral hemisphere (registered to the 2D top projection of the Allen Mouse Brain Atlas; mouse.brain-map.org) produced by proprioceptive and tactile stimuli. d Mean activation map contours (within 50% of peak activity) and peak activity loci (symbols) of individual mice (n = 7). Source data are provided as a Source Data file.
Fig. 3
Fig. 3. Identification of behavioral variables and cortical areas necessary for perceptual discrimination of forelimb proprioception.
a Schematic of the optogenetic silencing experiment during a 2AFC proprioceptive discrimination task. b Trial timeline (split dotted lines denote different trial outcomes). c Psychometric discrimination curve fitted to the mean (empty squares, minimum 200 trials/amplitude) answer % (N = 4 mice, filled squares). d Left, mean (colored circles, N = 4 mice) decrease in performance (difference in % of correct trials compared to no stimulation) during selective optogenetic silencing (single point stimulation) of different cortical areas. Gray circles are data from individual sessions (5 sessions per mouse per area). fS1: forelimb S1, hS1: hindlimb S1, wS1: whisker S1, ipsi-fS1: ipsilateral fS1, ALM: anterior lateral motor area, CFA: caudal forelimb motor area. *: p < 0.01 (two-sided t-test, Bonferroni corrected). Right, same data depicted on the top projection of the Allen Mouse Brain Atlas (fS1 is highlighted by dotted lines). e decrease in performance during ALM silencing with different delay durations (N = 1 mouse; black squares: means; gray circles: individual sessions). f Left, decrease in performance (same statistics as in D) during silencing (1 mm line stimulation) of contralateral cortical areas at the same anterio-posterior location (corresponding to fS1) but different lateral distances relative to bregma. Right, same data depicted on a zoomed in projection of the Allen Mouse Brain Atlas. g Example session showing lick events on each trial (colored ticks sorted by right vs. left answer) and instantaneous lick probability of each spout (based on all trials) for trained (medial and lateral) and probe (anterior and posterior) stimuli. h mean % of right answers (empty squares and black lines) for individual mice (different panels) of 10 sessions (small filled symbols and gray lines) when 15% of trials were probe stimuli. Anterior movements resulted in significantly more right answers than posterior movements in all four mice (*: p < 0.05, **: p < 0.01, two-sided t-test). Source data are provided as a Source Data file.
Fig. 4
Fig. 4. Perceptual discrimination is not based on changes in joint angles.
a Identification and tracking of mouse forelimb joints with stereo cameras (see Methods for details) yields the humerus abduction/adduction angle (color map, linear interpolation) mapped onto the planar workspace defined in Supplementary Fig. 1b (orange circle: manipulandum’s home position). b Changes (Δ angle measured from the map in a) in humerus adduction (negative values) or abduction (positive values) as the limb is displaced by 4 mm in the medial, lateral, posterior and anterior directions. c % right answer means (N = 4 mice) of the data in Fig. 3H for the trained (medial and lateral) and probe (anterior and posterior) directions. The perceptual association axis is orthogonal to the joint similarity axis in b. Source data are provided as a Source Data file.
Fig. 5
Fig. 5. Ca2+ imaging of proprioceptive neuronal responses in the mouse forelimb S1.
a Left, experiment schematic of the passive forelimb displacement task with simultaneous two-photon imaging of cortical neurons transfected with GCaMP. Right, cropped two-photon image of the forelimb somatosensory cortex and Ca2+ dependent activity traces of five neurons responding at the onset of passive forelimb movements (dotted lines, eight different directions tested). b Three types of observed proprioceptive responses. Δf/f0 mean (±s.d.) traces of three example neurons (red) aligned to first movement (home-to-target) and second movement (target-to-home) onset (cyan: individual movement trajectories). c Mean (±s.d.) responses (red) of two example neurons to passive forelimb movement, active touch, and active release of the manipulandum. Black traces: instantaneous probability to hold the manipulandum across trials. d Peak responses to active touch and active release as a % of peak responses to passive movement (N = 205 neurons, 18 mice). Red circles: data of example neurons in C. e Left, Mean (±s.d.) responses (red) of two example neurons to passive forelimb movement and tactile stimulation of the paw glabrous skin (shaded rectangle indicates the duration of skin indentation). Right, Peak responses of 29 neurons (2 mice) to passive movement vs. tactile stimulation. Red circles: data of example neurons in the left panel. f Responses after nerve block (s.c. lidocaine injection in the paw) of the two example neurons and the response change ratio of the imaged population (median ± quartiles, red symbols) relative to their pre-injection levels (N = 15 neurons for passive movement, N = 15 neurons for tactile stimulation, 2 mice, gray symbols). *: p = 3.10-4 n.s.: p = 0.52 (Wilcoxon signed rank test, two-sided). Source data are provided as a Source Data file.
Fig. 6
Fig. 6. Selective tuning of fS1 neurons to the direction of passive forelimb movement reveal a peripersonal representation of proprioception.
a Two example neurons with different preferred directions. Red traces: mean (±s.d.) responses to eight different directions of home-to-target movements (cyan arrows) and target-to-home movements (magenta arrows) with the same amplitude (7 mm) and velocity (2 cm/s). Polar plots: peak activity (deconvolved spike rate) as function of movement direction (red circles and numerical values refer to peak spike rate). Dotted lines: movement onset b Top, Gaussian fits (dotted lines) to directionally tuned peak responses (deconvolved spike rate) of three example neurons. Bottom, distribution of directional selectivity (width of the Gaussian fits, measured in azimuth angles of the earth’s horizontal plane) for home-to-target movements (N = 226 neurons, 18 mice). c Distribution of preferred directions for home-to-target movements (cyan arrows, N = 226 neurons) and target-to-home movements (magenta arrows, N = 197 neurons) indicates a preferred representation of body-petal vs. body-fugal movements. d Top, Gaussian fits to the directionally tuned responses (deconvolved spike rate) of two example neurons for home-to-target (cyan) and target-to-home (magenta) movements. Bottom, distribution of azimuth angle shifts (in the earth’s horizontal plane) in preferred spatial location between the two movement types (N = 187 neurons). e Response Δ ratios (see Methods for details) comparing peak neuronal activity for home-to-target vs. target-to-home movements with matched body-petal directions (orange circle: home position). Negative (magenta symbols) and positive (cyan symbols) values denote neurons with higher and lower activity for home-to-target movements, respectively. Bold symbols denote values significantly different from zero (p < 0.01, two-sided t-test). **: p < 0.01, *: p < 0.05 (two-sided t-test) for the population mean. f Same data and statistics as in E for matched body-fugal movements. g Same data as in E comparing anterior and posterior movements with matched directions and start/end positions. n.s.: p = 0.38. Source data are provided as a Source Data file.
Fig. 7
Fig. 7. Amplitude and velocity tuning in fS1.
a Mean (±s.d.) peak responses of two example neurons tuned by (left) and insensitive (right) to displacement amplitude (dotted lines are linear regression fits, at least N = 5 repetitions per tested amplitude). Top, Δf/f0 mean (±s.d.) traces of the same neurons for three different amplitudes. b Amplitude sensitivity (% change in peak response for a doubling of movement amplitude) as a function of correlation coefficient (peak response vs. movement amplitude) of neurons tested with varying amplitudes. Top histogram: distribution of correlation coefficients across all neurons. Right histogram: distribution of amplitude sensitivity for neurons with significant correlation with movement amplitude (N = 86 neurons, 6 mice). The two example neurons in A are depicted with #1 and #2. c, d Data analogous to that in (a), (b) for neurons tested with varying velocities (N = 197 neurons, 8 mice). Source data are provided as a Source Data file.

Similar articles

Cited by

References

    1. Tuthill JC, Azim E. Proprioception. Curr. Biol. 2018;28:R194–R203. doi: 10.1016/j.cub.2018.01.064. - DOI - PubMed
    1. Delhaye BP, Long KH, Bensmaia SJ. Neural basis of touch and proprioception in primate cortex. Compr. Physiol. 2018;8:1575–1602. doi: 10.1002/cphy.c170033. - DOI - PMC - PubMed
    1. Chowdhury, R. H., Glaser, J. I. & Miller, L. E. Area 2 of primary somatosensory cortex encodes kinematics of the whole arm. Elife9, 10.7554/eLife.48198 (2020). - PMC - PubMed
    1. Goodman JM, et al. Postural representations of the hand in the primate sensorimotor cortex. Neuron. 2019;104:1000–1009.e1007. doi: 10.1016/j.neuron.2019.09.004. - DOI - PMC - PubMed
    1. London BM, Miller LE. Responses of somatosensory area 2 neurons to actively and passively generated limb movements. J. Neurophysiol. 2013;109:1505–1513. doi: 10.1152/jn.00372.2012. - DOI - PMC - PubMed

Publication types