. 2023 Apr 12;14(1):2086.
doi: 10.1038/s41467-023-37817-x.

Quantitative assessment can stabilize indirect reciprocity under imperfect information

Affiliations

Quantitative assessment can stabilize indirect reciprocity under imperfect information

Laura Schmid et al. Nat Commun. .

Abstract

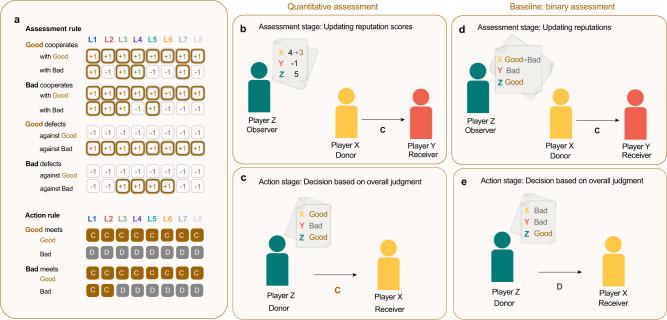
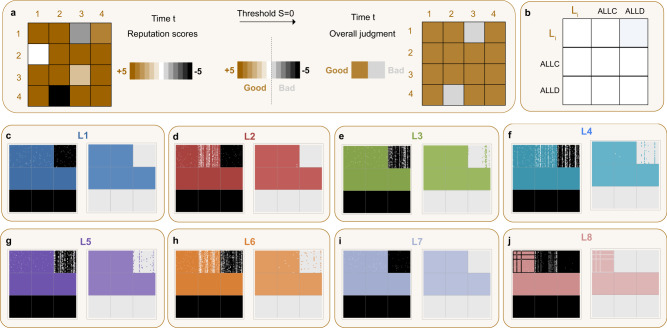
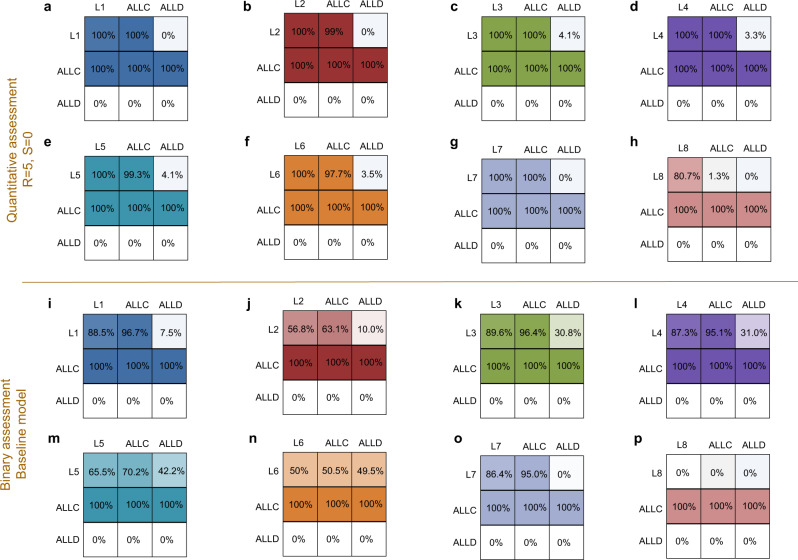
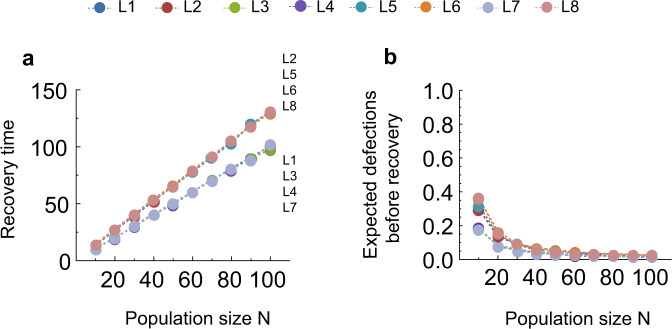
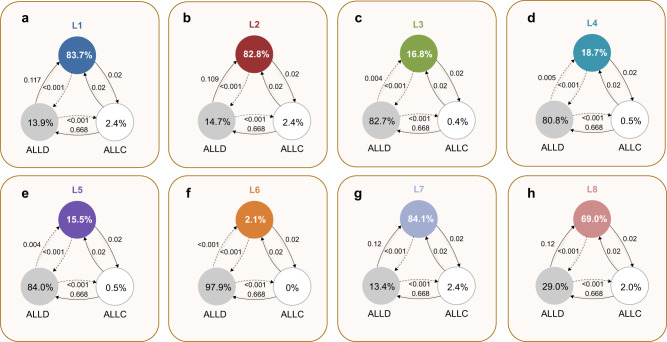
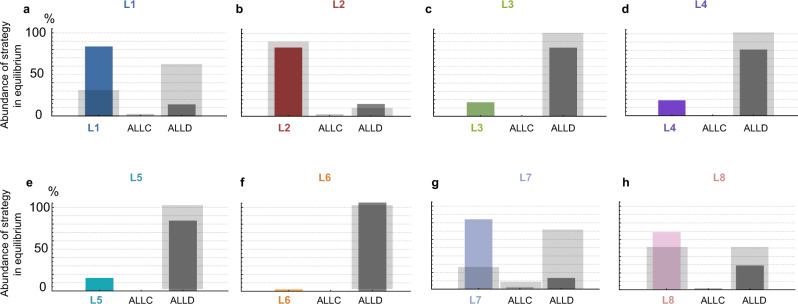
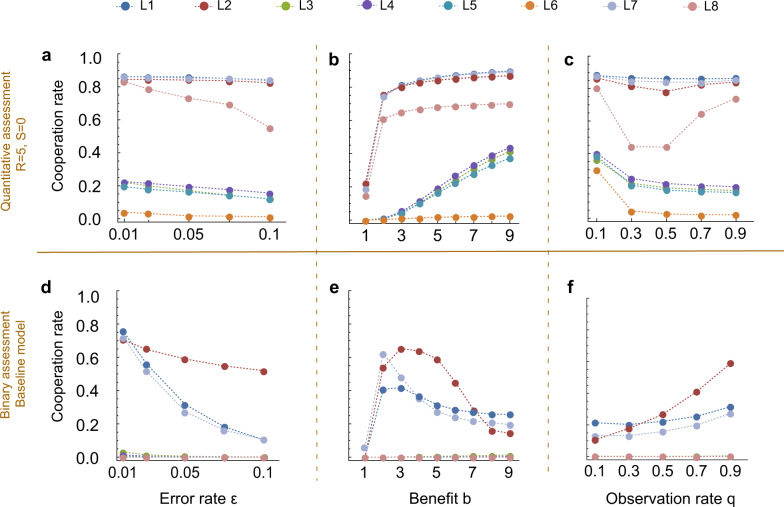
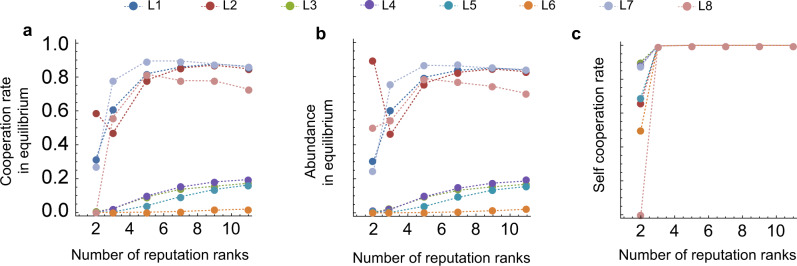
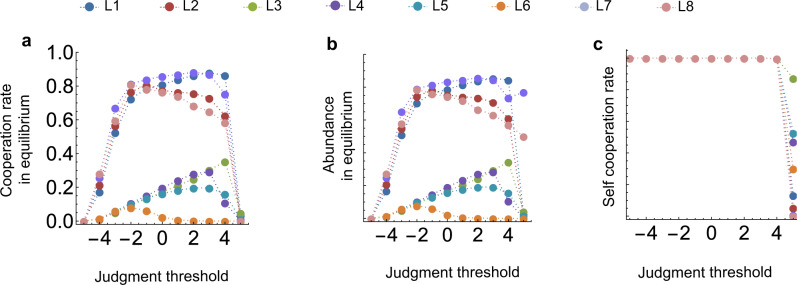
The field of indirect reciprocity investigates how social norms can foster cooperation when individuals continuously monitor and assess each other's social interactions. By adhering to certain social norms, cooperating individuals can improve their reputation and, in turn, receive benefits from others. Eight social norms, known as the "leading eight," have been shown to effectively promote the evolution of cooperation as long as information is public and reliable. These norms categorize group members as either 'good' or 'bad'. In this study, we examine a scenario where individuals instead assign nuanced reputation scores to each other, and only cooperate with those whose reputation exceeds a certain threshold. We find both analytically and through simulations that such quantitative assessments are error-correcting, thus facilitating cooperation in situations where information is private and unreliable. Moreover, our results identify four specific norms that are robust to such conditions, and may be relevant for helping to sustain cooperation in natural populations.


Conflict of interest statement

The authors declare no competing interests.

Figures

Fig. 1
Fig. 1. The leading eight norms with quantitative assessment.
a We consider the leading eight norms,. Each norm consists of an assessment rule that determines how an observer updates a donor’s reputation, and an action rule that governs players’ behavior when they are chosen to be the donor. The assessment rule takes the context of an observed action into account: how an observer judges a donor depends on the donors’ and recipient’s reputation. Similarly, the action rule uses the current donor’s and recipient’s reputation to decide whether the donor should cooperate with the recipient. In contrast to the original baseline model, we now interpret a positive assessment of an action as an increment of +1 to the donor’s reputation score, and a negative assessment as a decrement of -1. b The observing Player Z assesses Player X’s action of cooperating with a bad player as bad, such that he decrements X’s previous score by one. c, When it is Player Z’s turn to be the donor, he translates his and Player X’s reputation score into a binary label of “good” or “bad’’. Since both his and Player X’s score are above the threshold S, he judges both himself and Player X as good, and cooperates. d, e In the baseline model using binary assessment, the same starting scenario ends differently: Player Z changes his view of Player X from good to bad after Player X cooperates with Player Y, and therefore defects against Player X.
Fig. 2
Fig. 2. Quantitative assessment and reputation dynamics.
a Image matrices represent how players assess each other at any given time. We assume that every player keeps track of each population member’s reputation score, with scores in the interval [− 5, + 5]. To depict these image matrices graphically, we use colored dots, with the intensity of the color corresponding to the score: for example, a white dot means that the corresponding row player attributes a score of r = 0 to the corresponding column player (left side). On the other hand, players also make an overall judgment of others, in order to be able to use their assessment and action rules. To do so, they compare the scores to a threshold S = 0, resulting in a binary labeling of “good” and “bad”. To visualize this second, less refined layer of the reputation dynamics, we use a matrix with colored and gray dots (right side). b We show image matrices when players either use a leading eight social norm Li, ALLC, or ALLD (in equal proportions). cj We show the snapshots at T = 2 × 106 of players’ reputation scores and binary labels they translate into for all leading eight norms. We see that for L1 (c) and L7 (i), the reputation assignments of different Li players are perfectly correlated. They assign only good reputations to each other and ALLC, while they only assign bad reputations to ALLD. The picture is very similar for L2 (d). For all other norms, there are disagreements among the Li players, where they can also perceive ALLD players favorably. We note that L8 does not perceive any ALLC player as good, which is one of two very stable states in the reputation dynamics. Parameters: Population size N = 90, error rate ε = 0.05, observation probability q = 0.9, frame of reference R = 5 (i.e., interval for reputation scores r ∈ [− 5, 5]). Threshold S = 0. Simulations are run for 2 × 106 iterations, and the initial image matrix assumes a good reputation for all players.
Fig. 3
Fig. 3. Quantitative assessment improves the accuracy of reputation assignments by leading eight players.
We show the average overall judgments that players with the frame of reference R make of each other when comparing others’ reputation scores with the threshold (ah). As the basis for comparison to the baseline model, we use the average images that players have of each other when they use the standard binary assessment (ip). We observe that quantitative assessment and more nuanced reputations lead to a clear improvement of the accuracy with which players assign each other images. All leading eight norms achieve a perfectly correlated good self-image, as opposed to the baseline model, where only L1 (i) and L7 (o) achieve a self-image of more than 80% good. Players using quantitative assessment also do much better in judging ALLD as bad, and with the exception of the (less stable) L8 (h, p), also manage to assess ALLC as close to 100% good. This hints at the power of a more refined reputation dynamics. The parameters are the same as in Fig. 2.
Fig. 4
Fig. 4. Actual recovery times.
We simulate the recovery from the state (0, N − 2, 0) to a state with s ∈ {0, 1} and k + l = N − 1 by simulating the reputation dynamics. a We find that the recovery time for all leading eight norms is linear in population size N. For L1, L3, L4, L7, the slope of the curve is ~1, whereas the slope is ~1.3 for the remaining four of the leading eight norms. b When we consider the average number of defections that occur before recovery, we see that this number decreases as the population size grows large. For sufficiently large populations, no defection occurs before recovery. Simulations are averaged over 10,000 rounds.
Fig. 5
Fig. 5. Evolution of the leading eight with quantitative assessment.
We show the results of simulating evolutionary dynamics when players can choose among three different norms: a leading eight norm, ALLC, and ALLD. We assume that the spread of social norms is described by a pairwise comparison process, such that norms of players with high payoffs are more likely to be successful. Here, we use the limit of rare mutations, such that populations are homogeneous most of the time,,. Numbers in circles show how often each social norm is adopted on average. Arrows indicate fixation probabilities, i.e., how likely it is for other social norms to invade a given resident population. Solid arrows indicate that the respective transition is more likely to occur than expected under neutrality, whereas dotted arrows indicate that the respective transition is comparably unlikely. We see that four of the eight considered norms, L1 (a), L2 (b), L7 (g), and L8 (h) achieve high abundance in equilibrium, with L1, L2, and L7 played over 80% of the time. The remaining four norms, L3 (c), L4 (d), L5 (e), L6 (f) do not evolve in large proportions, and the respective dynamics strongly favor ALLD. Parameters: R = 5, S = 0, N = 50, ε = 0.05, b = 5, c = 1, q = 0.9, using a strength of selection of s = 1.
Fig. 6
Fig. 6. Four of the leading eight evolve in high proportions for quantitative assessment.
We compare the abundance of the leading eight strategies in selection–mutation equilibrium between the case of quantitative assessment and the baseline model. We use the same evolutionary process and setup as in Fig. 5 and present the changes in how often each norm is played on average. Colored bars represent the abundance in equilibrium under quantitative assessment, while the light gray bars in the background of each panel represent the results in the baseline model. We find that four of the eight strategies now evolve much more readily (a, b, g, h) than in the baseline model, and are played in large proportions. The three remaining strategies (c, d, e, f), which do not evolve at all in the baseline model, only do slightly better due to still being outcompeted by ALLD. The parameters are the same as in Fig. 5.
Fig. 7
Fig. 7. Quantitative assessment has a positive impact on cooperation rates.
We vary the noise on observations ε, the benefit-to-cost ratio b/c, with c = 1, and observation probability q. All other parameters remain constant at the values of Fig. 5. In each scenario, we plot the average cooperation rate of each individual leading eight norm when they compete against ALLD and ALLC, according to the selection–mutation equilibrium of the evolutionary process. We can compare the results when players use refined assessment with R = 5 (ac) with the outcome of the binary assessment in the baseline model (df). a Under quantitative assessment, cooperation rates of L1, L2, and L7 remain at around 85% even when the error rate ε increases to 0.1. The generally more unstable L8 is more affected by the increased noise, but still remains above 50% even at ε = 0.1. b Increasing the benefit of cooperation b leads to an increase in cooperation rate for all eight considered norms in contrast to the baseline. c When we increase the observation probability q, the behavior of the leading eight norms’ cooperation rates is also markedly different from the baseline. L1, L7 are barely affected while L2 and L8 exhibit nonlinearity for intermediate values of q.
Fig. 8
Fig. 8. Varying the frame of reference for quantitative assessment.
For this figure, we repeat the evolutionary simulations shown in Fig. 5, and vary the frame of reference R. That is, we explore the impact of the number of possible reputation ranks on cooperation, including the case of binary assessment with two reputation ranks. a We show the cooperation rate in equilibrium for the leading eight norms as the number of reputation ranks increases. We note that for the four successful norms L1, L2, L7, L8, the largest frame of reference does not correspond to the highest cooperation rate. An intermediate number of ranks is the most beneficial. L2 also exhibits a drop in cooperation rate from binary assessment to R = 1 (i.e., 3 reputation ranks). The behavior of the cooperation rates is mainly determined by the behavior of the equilibrium abundance of the eight norms as the frame of reference varies (b). Meanwhile, self-cooperation rates quickly increase to 1 as the frame of reference increases (c), which implies that the leading eight players have a perfectly correlated image of each other once assessment is more nuanced. The parameters are the same as in Fig. 5.
Fig. 9
Fig. 9. Varying the threshold for an overall good reputation of players.
For this figure, we repeat the evolutionary simulations shown in Fig. 5, and vary the threshold S for an overall good judgment of a player. a, b We find that cooperation rates and equilibrium abundance of the leading eight norms are not significantly different for threshold values between S = −2 and S = 4. Additionally, we observe that values of S closer to the value − R (here, R = 5) are more detrimental than those closer to + R; having a very large buffer for negative reputations thus seems to be less of an issue than having a very large buffer for positive reputations. c Self-cooperation rates are not affected by a change in threshold and stay at a value of 1, except for the value S = R, where self-cooperation drops. The parameters are the same as in Fig. 5.

Similar articles

Cited by

References

    1. Alexander, R. The Biology of Moral Systems (Aldine de Gruyter, 1987).
    1. Jacquet J, Hauert C, Traulsen A, Milinski M. Shame and honour drive cooperation. Biol. Lett. 2011;7:899–901. doi: 10.1098/rsbl.2011.0367. - DOI - PMC - PubMed
    1. Fehr E. Don’t lose your reputation. Nature. 2004;432:449–50. doi: 10.1038/432449a. - DOI - PubMed
    1. Bolton GE, Katok E, Ockenfels A. Cooperation among strangers with limited information about reputation. J. Public Econ. 2005;89:1457–68. doi: 10.1016/j.jpubeco.2004.03.008. - DOI
    1. Cuesta JA, Gracia-Lázaro C, Ferrer A, Moreno Y, Sánchez A. Reputation drives cooperative behaviour and network formation in human groups. Sci. Rep. 2015;5:1–6. doi: 10.1038/srep07843. - DOI - PMC - PubMed

Publication types