

Low-dose IL-2 enhances the generation of IL-10-producing immunoregulatory B cells
- PMID: 37045832
- PMCID: PMC10097719
- DOI: 10.1038/s41467-023-37424-w
Low-dose IL-2 enhances the generation of IL-10-producing immunoregulatory B cells
Abstract
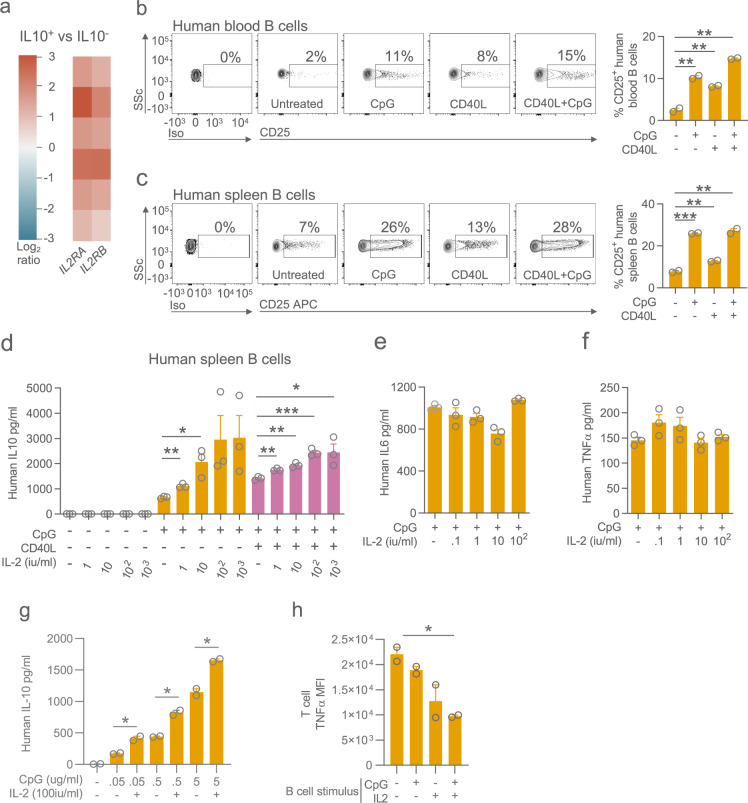
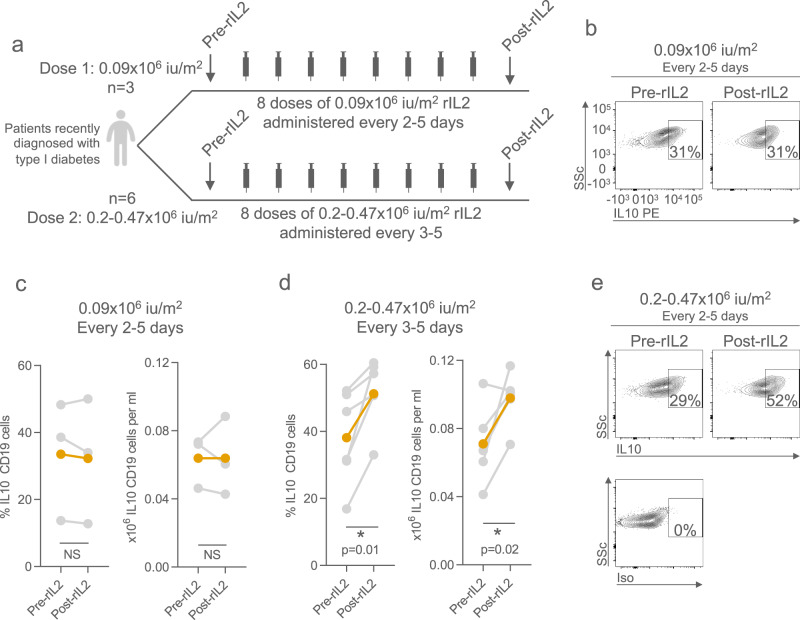
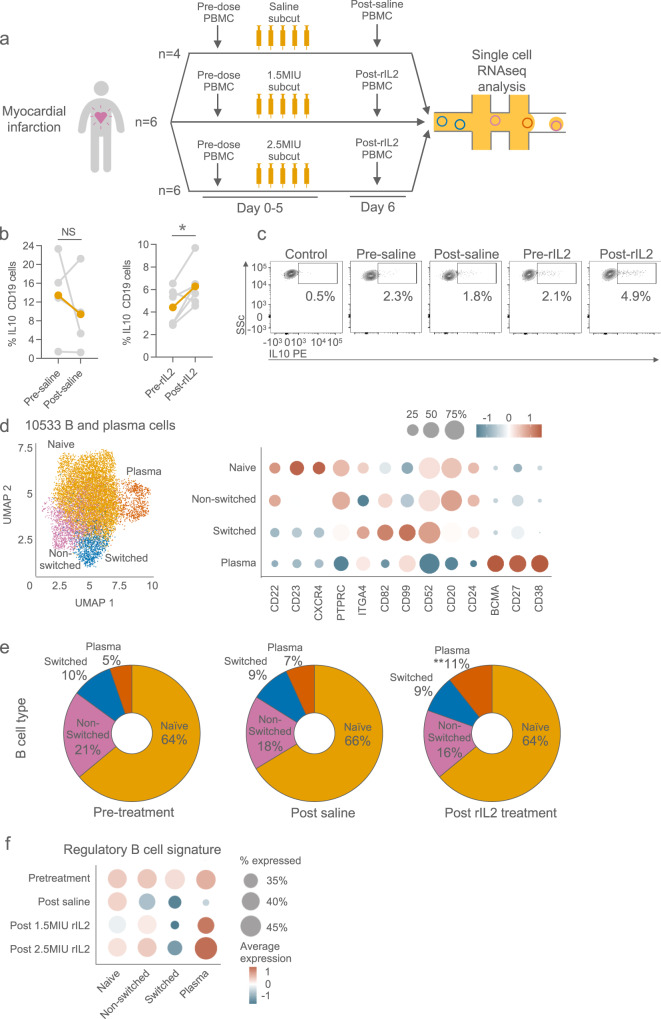
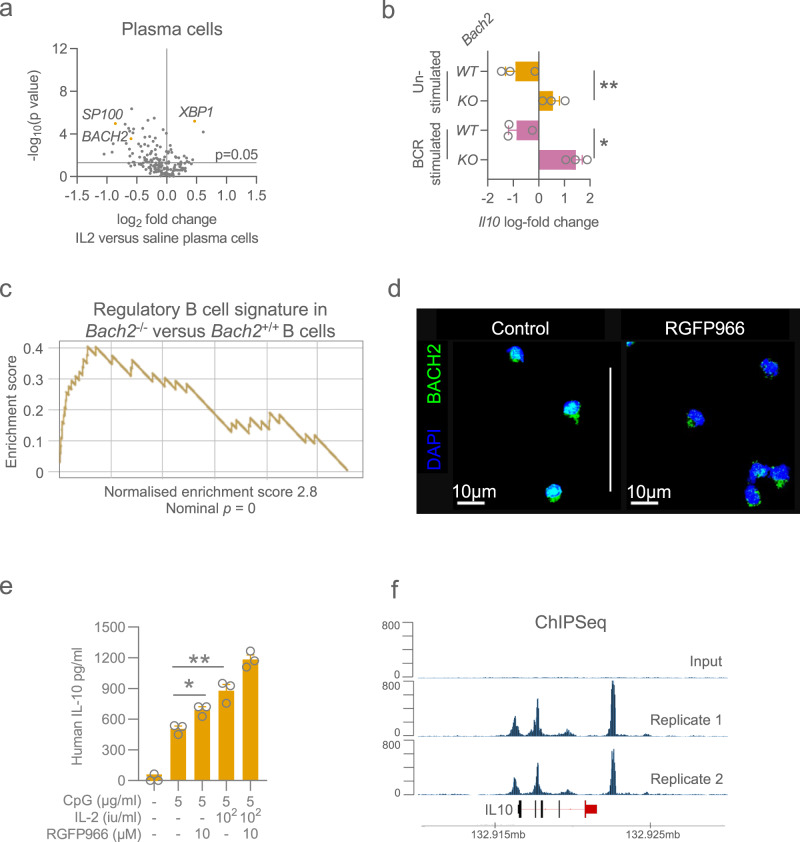
Dysfunction of interleukin-10 producing regulatory B cells has been associated with the pathogenesis of autoimmune diseases, but whether regulatory B cells can be therapeutically induced in humans is currently unknown. Here we demonstrate that a subset of activated B cells expresses CD25, and the addition of low-dose recombinant IL-2 to in vitro stimulated peripheral blood and splenic human B cells augments IL-10 secretion. Administration of low dose IL-2, aldesleukin, to patients increases IL-10-producing B cells. Single-cell RNA sequencing of circulating immune cells isolated from low dose IL2-treated patients reveals an increase in plasmablast and plasma cell populations that are enriched for a regulatory B cell gene signature. The transcriptional repressor BACH2 is significantly down-regulated in plasma cells from IL-2-treated patients, BACH2 binds to the IL-10 gene promoter, and Bach2 depletion or genetic deficiency increases B cell IL-10, implicating BACH2 suppression as an important mechanism by which IL-2 may promote an immunoregulatory phenotype in B cells.
© 2023. The Author(s).
Conflict of interest statement
The authors declare no competing interests.
Figures
Similar articles
-
Orchestration of plasma cell differentiation by Bach2 and its gene regulatory network.Immunol Rev. 2014 Sep;261(1):116-25. doi: 10.1111/imr.12201. Immunol Rev. 2014. PMID: 25123280 Review.
-
Regulation of IL-2 expression by transcription factor BACH2 in umbilical cord blood CD4+ T cells.Leukemia. 2008 Dec;22(12):2201-7. doi: 10.1038/leu.2008.234. Epub 2008 Sep 4. Leukemia. 2008. PMID: 18769450
-
IL-2 imprints human naive B cell fate towards plasma cell through ERK/ELK1-mediated BACH2 repression.Nat Commun. 2017 Nov 13;8(1):1443. doi: 10.1038/s41467-017-01475-7. Nat Commun. 2017. PMID: 29129929 Free PMC article.
-
Bach2 attenuates IL-2R signaling to control Treg homeostasis and Tfr development.Cell Rep. 2021 May 11;35(6):109096. doi: 10.1016/j.celrep.2021.109096. Cell Rep. 2021. PMID: 33979619
-
The Critical Role of Bach2 in Shaping the Balance between CD4+ T Cell Subsets in Immune-Mediated Diseases.Mediators Inflamm. 2019 Dec 30;2019:2609737. doi: 10.1155/2019/2609737. eCollection 2019. Mediators Inflamm. 2019. PMID: 32082072 Free PMC article. Review.
Cited by
-
Role of IRF4 in mediating plasmablast differentiation in diffuse large B-cell lymphomas via mTORC1 pathway.Ann Hematol. 2025 Apr;104(4):2449-2459. doi: 10.1007/s00277-025-06273-6. Epub 2025 Apr 10. Ann Hematol. 2025. PMID: 40204935 Free PMC article.
-
Low-dose IL-2 restores Tfh/Tfr imbalance and modulates B cell subset distribution in the pre-arthritis phase of the collagen-induced arthritis model.Clin Rheumatol. 2025 Jun;44(6):2487-2500. doi: 10.1007/s10067-025-07455-3. Epub 2025 Apr 30. Clin Rheumatol. 2025. PMID: 40304957
-
Association of interleukin-2 and interleukin-10 with the pathophysiology and development of generalized anxiety disorder: a case-control study.BMC Psychiatry. 2024 Jun 20;24(1):462. doi: 10.1186/s12888-024-05911-z. BMC Psychiatry. 2024. PMID: 38902708 Free PMC article.
-
IL-2 Complex Therapy Mitigates Humoral Rejection of Fully Mismatched Skin Allografts by Inhibiting IgG Alloantibody Formation.Cells. 2025 Jul 16;14(14):1086. doi: 10.3390/cells14141086. Cells. 2025. PMID: 40710339 Free PMC article.
-
T-Cell/B-Cell Interactions in Atherosclerosis.Arterioscler Thromb Vasc Biol. 2024 Jul;44(7):1502-1511. doi: 10.1161/ATVBAHA.124.319845. Epub 2024 May 30. Arterioscler Thromb Vasc Biol. 2024. PMID: 38813700 Free PMC article. Review.
References
Publication types
MeSH terms
Substances
Grants and funding
LinkOut - more resources
Full Text Sources
