. 2023 Apr 12;14(1):2058.
doi: 10.1038/s41467-023-37791-4.

WHIM Syndrome-linked CXCR4 mutations drive osteoporosis

Affiliations

WHIM Syndrome-linked CXCR4 mutations drive osteoporosis

Adrienne Anginot et al. Nat Commun. .

Abstract

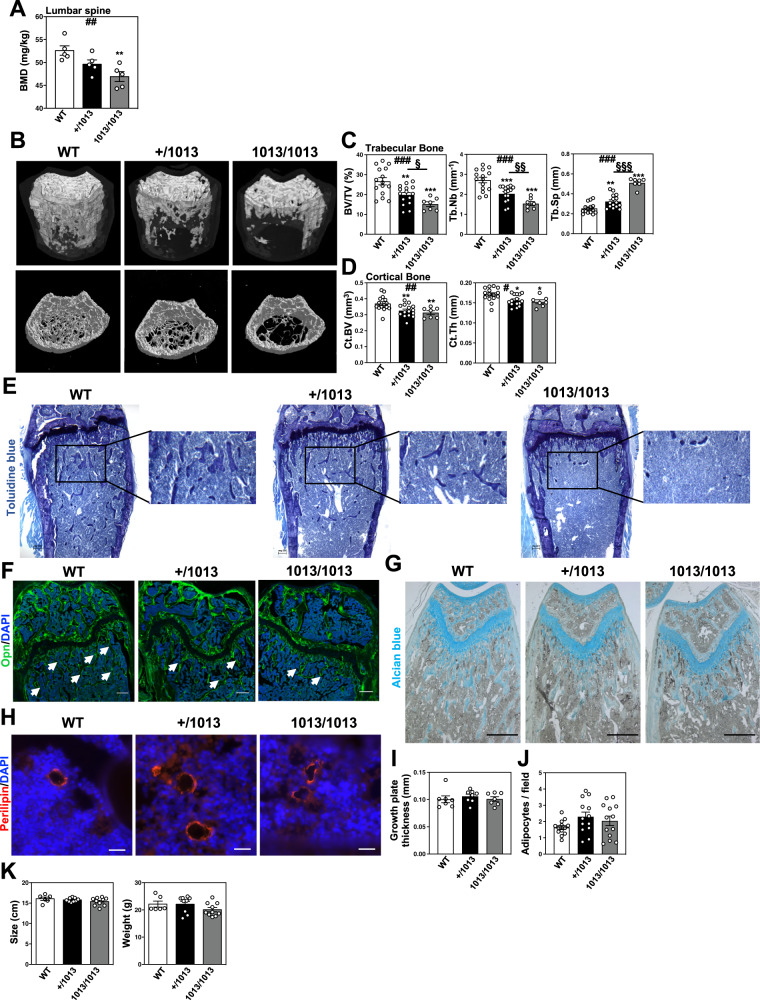
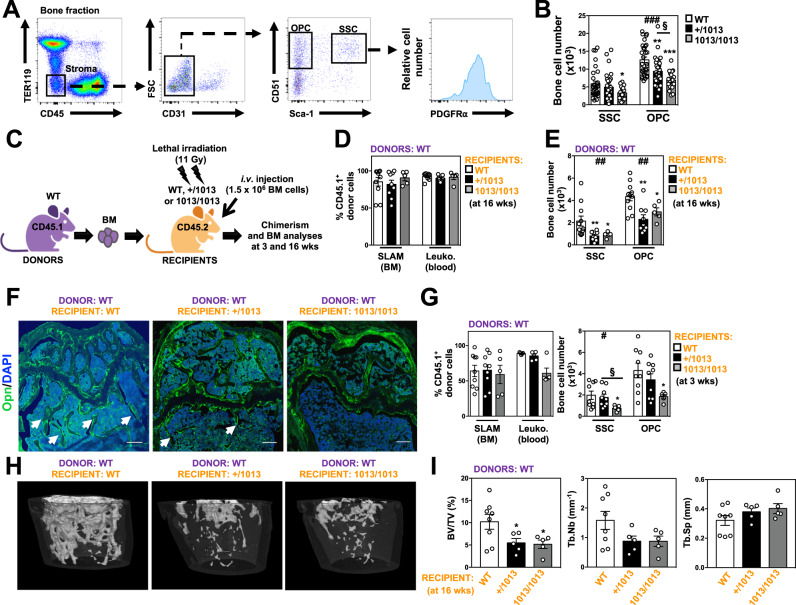
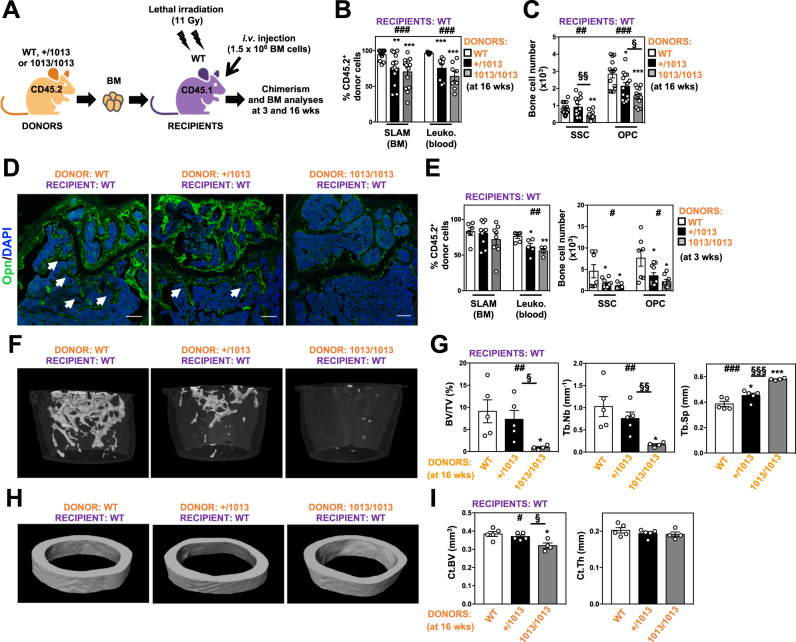
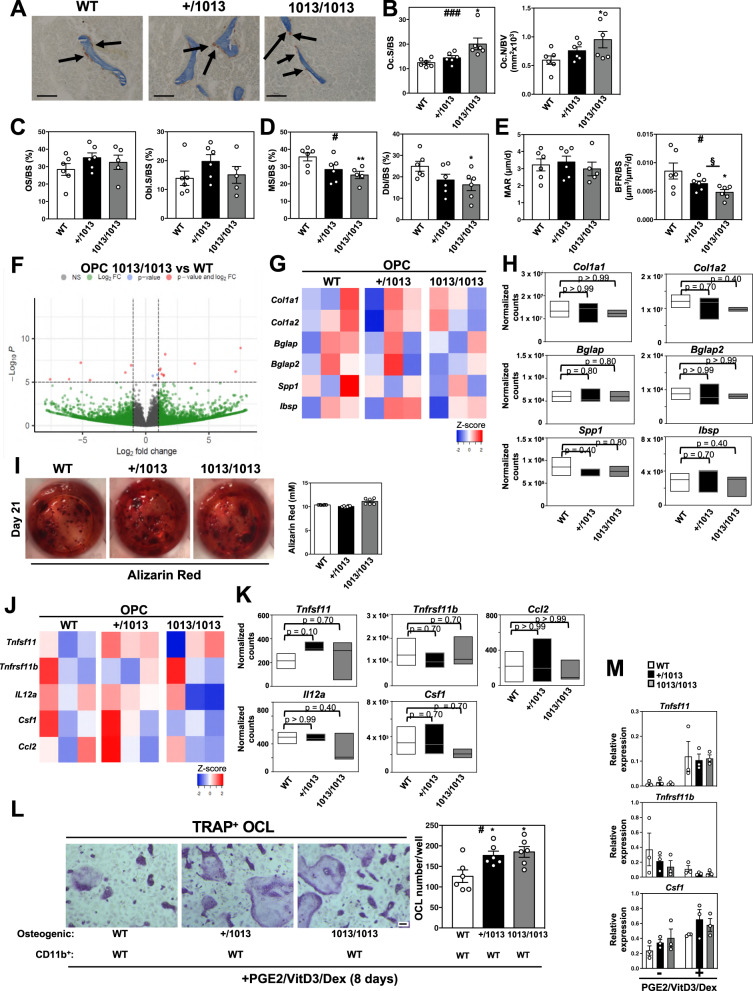
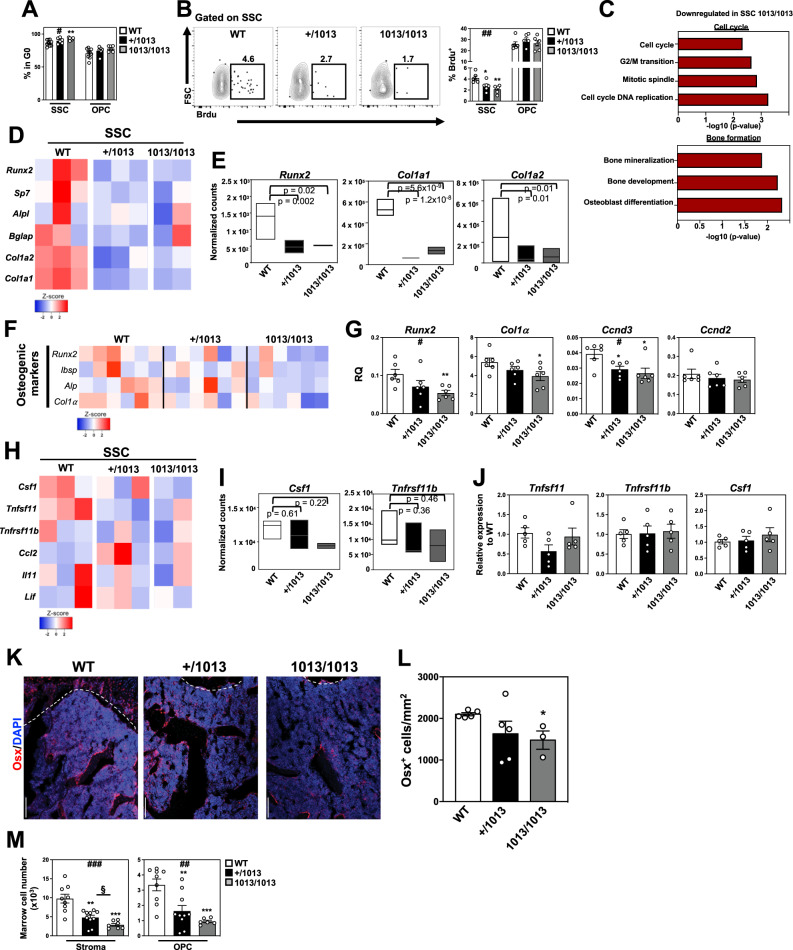
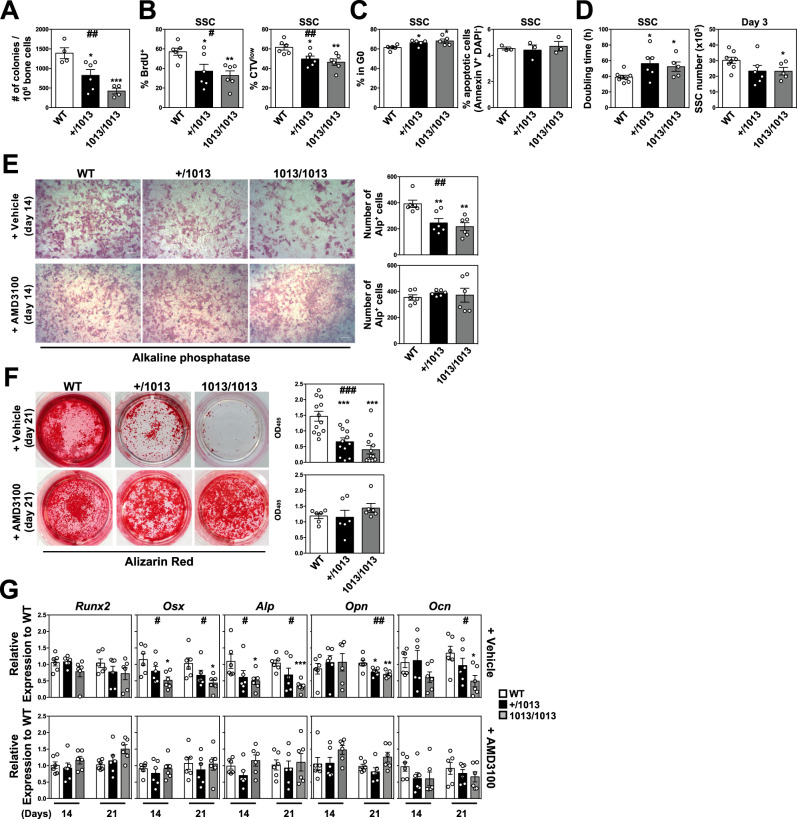
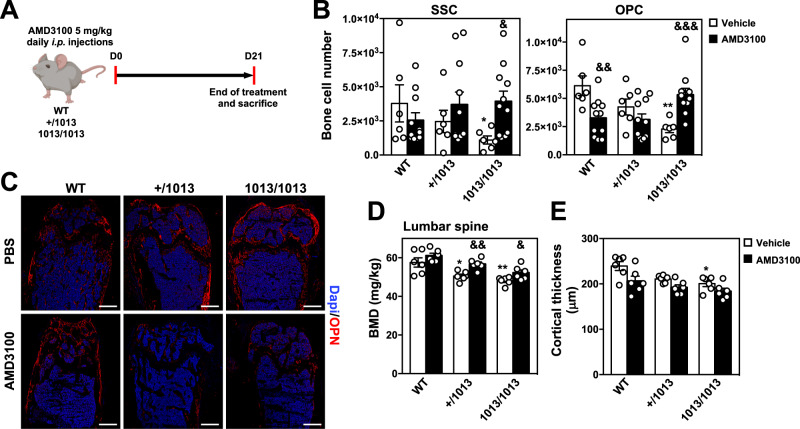
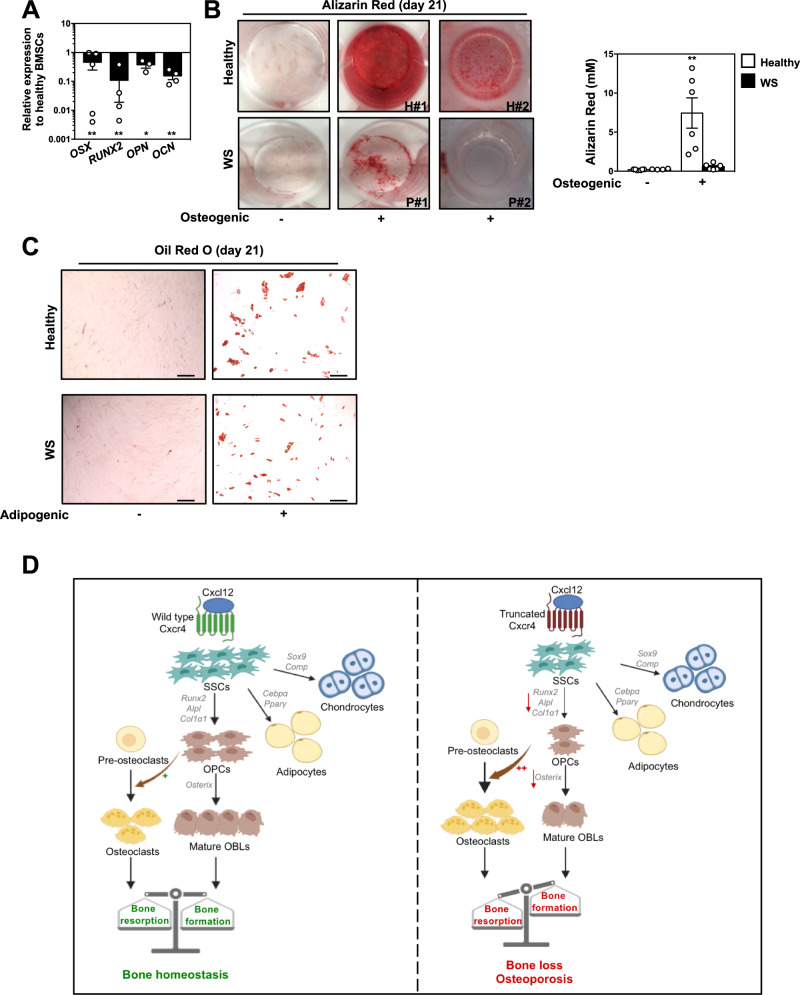
WHIM Syndrome is a rare immunodeficiency caused by gain-of-function CXCR4 mutations. Here we report a decrease in bone mineral density in 25% of WHIM patients and bone defects leading to osteoporosis in a WHIM mouse model. Imbalanced bone tissue is observed in mutant mice combining reduced osteoprogenitor cells and increased osteoclast numbers. Mechanistically, impaired CXCR4 desensitization disrupts cell cycle progression and osteogenic commitment of skeletal stromal/stem cells, while increasing their pro-osteoclastogenic capacities. Impaired osteogenic differentiation is evidenced in primary bone marrow stromal cells from WHIM patients. In mice, chronic treatment with the CXCR4 antagonist AMD3100 normalizes in vitro osteogenic fate of mutant skeletal stromal/stem cells and reverses in vivo the loss of skeletal cells, demonstrating that proper CXCR4 desensitization is required for the osteogenic specification of skeletal stromal/stem cells. Our study provides mechanistic insights into how CXCR4 signaling regulates the osteogenic fate of skeletal cells and the balance between bone formation and resorption.


Conflict of interest statement

The authors declare no competing interests.

Figures

Fig. 1
Fig. 1. WS-linked Cxcr4 mutations are associated with reduced bone mass in mice.
A The bone mineral density (BMD) of lumbar spine of WT, +/1013, and 1013/1013 mice was measured through Dual-energy x-ray absorptiometry. Results represent means ± SEM with 5 mice per group examined over two independent experiments. Statistics were calculated with the nonparametric Kruskal–Wallis H test (##p = 0.0042) and the nonparametric Mann–Whitney test, two-sided, +/1013 p = 0.0556, 1013/1013 **p = 0.0079. BD 3D representative images of trabecular and cortical composites (B) and quantitative μCT analyses of trabecular (C) and cortical (D) parameters of femurs from WT and mutant mice. BV = bone volume; TV = trabecular volume; Tb.Nb = trabecular number; Tb.Sp = trabecular separation; Ct.BV = cortical bone volume; Ct.Th = cortical thickness. Data (means ± SEM) are from three independent experiments with n = 15, 15, and 7 mice in total for WT, +/1013, and 1013/1013 groups, respectively. Statistics were calculated with the nonparametric Kruskal–Wallis H test (###p = 0.0007, BV/TV; p = 0.0001, Tb.Nb; p < 0.0001, Tb.Sp; Ct.BV, ##p = 0.0072; #p = 0.0241) and the unpaired two-tailed Student’s t test (+/1013 vs WT **p = 0.0556, 1013/1013 vs WT ***p = 0.0005, +/1013 vs 1013/1013 §p = 0.032 for BV/TV; ***p = 0.0005, ***p < 0.0001, §§p = 0.008 for Tb.Nb; ***p = 0.0038, ***p < 0.0001, §§§p < 0.0001 for Tb.Sp; **p = 0.0072, **p = 0.0078 for Ct.BV; *p = 0.0147, *p = 0.02 for Ct.Th). E BM sections were stained with toluidine blue. Larger images show 2X inserts in trabecular areas. Bars: 200 μm. Images are representative of at least three independent determinations. F BM sections were immunostained for osteopontin (Opn) in association with DAPI. Trabeculae are indicated by white arrows. Bars: 250 μm. Images are representative of five independent determinations. G, H BM sections were stained for chondrocyte (alcian blue, G) or adipocyte (perilipin, H) markers. Bars: 500 (G) or 20 (H) μm. Images are representative of at least six independent determinations. I Cartilaginous growth plates were evaluated based on overall growth plate thickness measured on µCT scans. Data (means ± SEM) are from 2 independent experiments with n = 7, 8, and 7 mice in total for WT, +/1013, and 1013/1013 groups, respectively. J Adipocyte counts were evaluated on perilipin-stained BM sections. Six fields of 3 mm2 were analyzed per section. Results (means ± SEM) are from 4 independent experiments with 13 mice in total per group. K Size (left) and weight (right) of WT and mutant mice. Results (means ± SEM) are from five independent experiments with n = 6, 9, and 10 mice in total for WT, +/1013, and 1013/1013 groups, respectively. Mice were littermates, females, and age-matched (8–12 wk-old) in (AJ) and at 8 weeks of age in (K). Source data are provided as a Source data file.
Fig. 2
Fig. 2. Reduction of skeletal stromal cells in Cxcr41013-bearing mice.
A Representative dot-plots showing the flow cytometric gating strategies used to sort stroma cells (CD45-TER119-), differentiated osteoblast progenitor cells (OPCs, CD45-TER119-CD31-Sca-1-CD51+PDGFRα+/-) and SSCs (CD45-TER119-CD31-Sca-1+CD51+PDGFRα+) in the mouse bone fraction. B Absolute numbers of the indicated stroma cell subsets from bone fractions were determined by flow cytometry. Data (means ± SEM) are from at least six independent experiments with n = 31, 31, and 17 mice in total for WT, +/1013, and 1013/1013 groups, respectively. Statistics were calculated with the nonparametric Kruskal–Wallis H test (###p < 0.0001, OPC) and the unpaired two-tailed Student’s t test (1013/1013 vs WT *p = 0.0206 for SSC; +/1013 vs WT **p = 0.0031, 1013/1013 vs WT ***p < 0.0001, +/1013 vs 1013/1013 §p = 0.0217 for OPC). C Schematic diagram for the generation of CD45.1→CD45.2 short (3 wks)- or long (16 wks)-term BM chimeras. Mouse icons were created using the Biorender software (Biorender.com, agreement number: VX255VH9TZ). D Proportions of WT donor CD45.1+ LSK SLAM and leukocytes (Leuko.) recovered from the BM and blood of BM chimeras in CD45.2+ WT or mutant recipients 16 weeks after transplantation. E Absolute numbers of SSCs and OPCs determined by flow cytometry in bone fractions of BM chimeras in CD45.2+ recipients. Data (means ± SEM) in (D) and (E) are from three independent experiments with n = 10 (D) or 11 (E), 9, and 5 mice in total for WT, +/1013, and 1013/1013 recipient groups, respectively. Statistics were calculated with the nonparametric Kruskal–Wallis H test (##p = 0.0064) and the nonparametric Mann–Whitney test, two-sided (+/1013 vs WT **p = 0.0042, 1013/1013 vs WT *p = 0.0126, for SSC; +/1013 vs WT **p = 0.0031, 1013/1013 vs WT *p = 0.0398, for OPC). F Sixteen weeks after transplantation, BM sections from WT or mutant CD45.2+ recipient mice were immunostained for Opn in association with DAPI (bars: 250 μm). Trabeculae are indicated by white arrows. Images are representative of at least three independent determinations. G Left: Proportions of WT donor CD45.1+ LSK SLAM and leukocytes recovered from the BM and blood of BM chimeras in CD45.2+ WT or mutant recipients 3 weeks after transplantation. Right: Absolute numbers of SSCs and OPCs. Data (means ± SEM) are from three independent experiments with n = 9, 9, and 5 mice in total for WT, +/1013, and 1013/1013 recipient groups, respectively, except for blood chimerism analysis (5 mice per group). Statistics were calculated with the nonparametric Kruskal–Wallis H test (#p = 0.0327) and the nonparametric Mann–Whitney test, two-sided (1013/1013 vs WT *p = 0.019, +/1013 vs 1013/1013 §p = 0.019 for SSC; 1013/1013 vs WT *p = 0.017 for OPC). H, I 3D representative images of trabecular composites (H) and µCT analyses of trabecular parameters (I) of femurs from WT BM-chimeric CD45.2+ WT or mutant recipients 4 months after transplantation. Data (means ± SEM) are from three independent experiments with n = 8, 5, and 5 mice in total for WT, +/1013, and 1013/1013 recipient groups, respectively. Statistics were calculated with the unpaired two-tailed Student’s t test (+/1013 vs WT *p = 0.033, 1013/1013 vs WT *p = 0.024 for BV/TV). WT and mutant mice were littermates, females and age-matched (8–12 wk-old) and adult Boy/J (CD45.1) WT mice at 8 weeks of age were used as BM donors. Source data are provided as a Source data file.
Fig. 3
Fig. 3. Cell-extrinsic Cxcr4-mediated regulation of the skeletal landscape.
A Schematic diagram for the generation of CD45.2→CD45.1 short (3 wks)- or long (16 wks)-term BM chimeras. Mouse icons were created using the Biorender software (Biorender.com, agreement number: VX255VH9TZ). B Proportions of WT or mutant donor CD45.2+ LSK SLAM and leukocytes recovered from the BM and blood of BM chimeras in CD45.1+ WT recipients 16 weeks after transplantation. Statistics were calculated with the nonparametric Kruskal–Wallis H test (###p = 0.0008 for SLAM and <0.0001 for Leukocytes) and the unpaired two-tailed Student’s t test (+/1013 vs WT **p = 0.0036, 1013/1013 vs WT ***p = 0.0004, for SLAM; +/1013 vs WT ***p = 0.0003, 1013/1013 vs WT ***p < 0.0001, for Leukocytes). C Absolute numbers of SSCs and OPCs in bone fractions of BM chimeras in CD45.1+ recipients. Statistics were calculated with the nonparametric Kruskal–Wallis H test (##p = 0.009 for SSC and ###p = 0.0006) and the unpaired two-tailed Student’s t test (1013/1013 vs WT **p = 0.0012, +/1013 vs 1013/1013 §§p = 0.0076, for SSC; +/1013 vs WT *p = 0.029, 1013/1013 vs WT ***p < 0.0001, +/1013 vs 1013/1013 §p = 0.022, for OPC). Data (means ± SEM) in (B) and (C) are from three independent experiments with n = 14 mice in total for WT, +/1013, and 1013/1013 donor groups, respectively, except for blood chimerism analysis (n = 11, 9, and 8 mice in total for WT, +/1013, and 1013/1013 donor groups, respectively). D Sixteen weeks after transplantation, BM sections from WT CD45.1+ recipient mice were immunostained for Opn in association with DAPI (bars: 250 μm). Trabeculae are indicated by white arrows. Images are representative of at least three independent determinations. E Left: Proportions of WT or mutant donor CD45.2+ LSK SLAM and leukocytes recovered from the BM and blood of BM chimeras in CD45.1+ WT recipients 3 weeks after transplantation. Right: Absolute numbers of SSCs and OPCs. Data (means ± SEM) are from three independent experiments with n = 6 (SLAM) or 7 (SSC and OPC), 10, and 8 mice in total for WT, +/1013, and 1013/1013 donor groups, respectively, except for blood chimerism analysis (n = 6, 5, and 4 mice in total for WT, +/1013, and 1013/1013 donor groups, respectively). Statistics were calculated with the nonparametric Kruskal–Wallis H test (##p = 0.0083 for leukocytes; #p = 0.047 for SSC; #p = 0.018 for OPC) and the unpaired two-tailed Student’s t test (+/1013 vs WT *p = 0.021, 1013/1013 vs WT **p = 0.0014, for leukocytes; +/1013 vs WT *p = 0.046, 1013/1013 vs WT *p = 0.029, for SSC; +/1013 vs WT *p = 0.034, 1013/1013 vs WT *p = 0.01, for OPC). FI 3D representative images of trabecular or cortical composites (F and H) and µCT analyses of trabecular or cortical parameters (G and I) of femurs from WT or mutant BM-chimeric CD45.1+ WT recipients 4 months after transplantation. Ct.BV = cortical bone volume; Ct.Th = cortical thickness. Data (means ± SEM) in (G) and (I) are from two independent experiments with n = 5, 5, and 4 mice in total for WT, +/1013, and 1013/1013 donor groups, respectively. Statistics were calculated with the nonparametric Kruskal–Wallis H test (##p = 0.0085 for BV/TV; ##p = 0.0069 for Tb.Nb; ###p = 0.0001 for Tb.Sp; #p = 0.033 for Ct.BV) and the unpaired two-tailed Student’s t test (1013/1013 vs WT *p = 0.028, +/1013 vs 1013/1013 §p = 0.028 for BV/TV; 1013/1013 vs WT *p = 0.011, +/1013 vs 1013/1013 §§p = 0.0088 for Tb.Nb; +/1013 vs WT *p = 0.044, 1013/1013 vs WT ***p < 0.0001, +/1013 vs 1013/1013 §§§p = 0.0006 for Tb.Sp; 1013/1013 vs WT *p = 0.014, +/1013 vs 1013/1013 §p = 0.016 for Ct.BV). Donor WT and mutant mice and Boy/J (CD45.1) WT recipient mice were females at 8 weeks of age. Source data are provided as a Source data file.
Fig. 4
Fig. 4. Increased bone resorption and reduced bone formation in Cxcr41013-bearing mice.
A Bone sections were stained for Tartrate Resistant Acid Phosphatase (TRAP) activity (bars: 100 μm). OCLs are visualized as brown-stained TRAP-positive cells attached to bone trabeculae and are indicated by arrows (representative images). B OCLs were quantified (Oc.S/BS) and (Oc.N/BV). Results represent means ± SEM with 6 mice in total per group over 3 independent experiments. Statistics were calculated with the nonparametric Kruskal–Wallis H test (###p = 0.0006) and the unpaired two-tailed Student’s t test (1013/1013 vs WT *p = 0.012 for Oc.S/BS; 1013/1013 vs WT *p = 0.049 for Oc.N/BV). C, D Dynamic histomorphometric measures of bone formation. OS/BS = Osteoid number/Bone surface; Obl.S/BS = Osteoblast surface/Bone surface; MS/BS = Mineralized surface/Bone surface; Dbl/BS = Double-labeled surface/Bone surface. Data (means ± SEM) are from 3 independent experiments with n = 6, 6, and 5 mice in total for WT, +/1013, and 1013/1013 groups, respectively, in (C), and n = 6, 6, and 5 (for MS/BS) or 6 (for Dbl/BS) mice in total for WT, +/1013, and 1013/1013 groups, respectively, in (D). Statistics were calculated with the nonparametric Kruskal–Wallis H test (#p = 0.038) and the unpaired two-tailed Student’s t test (1013/1013 vs WT **p = 0.0097 for MS/BS; 1013/1013 vs WT *p = 0.035 for Dbl/BS). E The mineral apposition rate (MAR) and bone formation rate (BFR/BS) were determined. Results (means ± SEM) are from 3 independent experiments with n = 6, 6, and 5 (for MAR) or 6 (for BFR/BS) mice in total for WT, +/1013, and 1013/1013 groups, respectively. Statistics were calculated with the nonparametric Kruskal–Wallis H test (#p = 0.039) and the unpaired two-tailed Student’s t test (1013/1013 vs WT *p = 0.03, +/1013 vs 1013/1013 §p = 0.044). F Volcano plot analysis of differentially expressed genes obtained by RNA-seq between WT and 1013/1013 OPCs (p < 0.05; FC ≥ 2) performed on three biological replicates per group with one replicate representing the pool of 3 mice. Data represent analysis of cpm estimates with a log of fold change of more than 1.5-fold and p < 0.05 using enhanced Volcano package. G, J Heatmap representing the relative expression levels of selected genes (osteogenic, G and osteoclastogenic, J) expressed by sorted OPCs. H, K Normalized counts of osteogenic (H) and osteoclastogenic (K) genes using the DESeq2 method. Data are represented as floating bars (min to max and line equal median) of the three biological replicates per group. For significance testing, DESeq2 uses a Wald test (p values). The Wald test P values from the subset of genes that pass an independent filtering step, are adjusted for multiple testing using the procedure of Benjamini and Hochberg (padj values). I In vitro osteoblastic differentiation of sorted OPCs evaluated at day 21 post-culture by Alizarin Red S coloration. The images are representative of 3 independent cultures. The quantification (means ± SEM) from three independent experiments with 6 mice in total per group is shown. L In vitro expanded osteogenic cells from bone fractions were cultured with WT CD11b+ osteoclast progenitors and stimulated with PGE2/Vitamin D3 (VitD3)/Dexamethasone (Dex) for 8 days. OCLs (TRAP-positive) were identified (left, representative images, bars: 50 μm) and quantified (right). Data (means ± SEM) are from 2 independent experiments with 6 mice in total per group. Statistics were calculated with the nonparametric Kruskal–Wallis H test (#p = 0.033) and the unpaired two-tailed Student’s t test (+/1013 vs WT *p = 0.02 and 1013/1013 vs WT *p = 0.014). M The relative expression levels of osteoclastogenic genes were determined by quantitative PCR in stimulated osteogenic cells (3 mice per group). Each individual sample was run in triplicate and has been standardized for 36B4 expression levels. All mice were littermates, females, and age-matched (8–12 wk-old). Source data are provided as a Source data file.
Fig. 5
Fig. 5. Impaired osteogenic specification of Cxcr41013-bearing skeletal stromal/stem cells.
A Ki-67 and DAPI co-staining to analyze by flow cytometry the cell cycle status of SSCs and OPCs from bone fractions. Bar graphs show the percentage of cells (DAPIlowKi-67-) in the quiescent G0 phase. Data (means ± SEM) are from three independent experiments with n = 9, 6, and 6 mice in total for WT, +/1013, and 1013/1013 groups, respectively. Statistics were calculated with the nonparametric Kruskal–Wallis H test (#p = 0.029) and the unpaired two-tailed Student’s t test (1013/1013 vs WT **p = 0.0091). B Flow-cytometric detection of BrdU staining in SSCs (left). Percentages of BrdU+ bone SSCs and OPCs after a 12-day labeling period (right). Data (means ± SEM) are from three independent experiments with six mice in total per group. Statistics were calculated with the nonparametric Kruskal–Wallis H test (##p = 0.0021) and the unpaired two-tailed Student’s t test (+/1013 vs WT *p = 0.016, 1013/1013 vs WT **p = 0.0011). C Characterization of some biological processes displaying differential gene expression signatures in sorted SSCs as defined by GSEA and obtained by RNA-seq on 2 (1013/1013) or 3 (WT and +/1013) biological replicates per group with one replicate representing the pool of 3 mice. For significance testing, DESeq2 uses a Wald test (p values). The Wald test P values from the subset of genes that pass an independent filtering step, are adjusted for multiple testing using the procedure of Benjamini and Hochberg (padj values). D RNA-seq-based heatmap representing the relative expression levels of osteogenic genes. E Normalized counts of selected osteogenic genes using the DESeq2 method. Data are represented as floating bars (min to max and line equal median) of the 2 or 3 biological replicates per group. For significance testing, DESeq2 uses a Wald test (p values). F The heatmap shows the relative expression levels (RQ) normalized for β-actin expression levels in each sample of selected genes involved in SSC differentiation towards the osteogenic lineage (6 pools of 100 cells per condition) by quantitative PCR. G RQ of the most regulated genes involved in differentiation and cell cycle of SSCs. Data (means ± SEM) are from two independent experiments with 6 mice in total per group. Statistics were calculated with the nonparametric Kruskal–Wallis H test (#p = 0.028 for Runx2; #p = 0.011 for Ccnd3) and the unpaired two-tailed Student’s t test (1013/1013 vs WT **p = 0.0063 for Runx2; 1013/1013 vs WT *p = 0.048 for Col1α; +/1013 vs WT *p = 0.022 and 1013/1013 vs WT *p = 0.02 for Ccnd3). H RNA-seq-based heatmap representing the relative expression levels of osteoclastogenic genes expressed by sorted SSCs. I Normalized counts of selected osteoclastogenic genes using the DESeq2 method. Data are represented as floating bars (min to max and line equal median) of the 2 or 3 biological replicates per group. For significance testing, DESeq2 uses a Wald test (p values). J Relative expression of osteoclastogenic genes in SSCs by quantitative PCR. Each individual sample was run in triplicate and has been standardized for β-actin expression levels and presented as relative expression to WT. Data (means ± SEM) are from two independent experiments with 5 mice in total per group. K Immunofluorescence showing in red Osterix (Osx)-positive cells and in blue DAPI-stained nuclei in WT and mutant mice femurs (bars: 100 μm). Dashed lines indicate the limit between the cartilage growth plate (above the line) and the bone (below the line). Images are representative of at least 3 independent determinations. L Quantification of Osx+ cells per mm2 below the growth plate. Data (means ± SEM) are from 5, 5, and 3 independent mice in total for WT, +/1013, and 1013/1013 groups, respectively. Statistics were calculated with the unpaired two-tailed Student’s t test (1013/1013 vs WT *p = 0.0101). M Absolute numbers of the indicated stroma cell subsets from marrow fractions determined by flow cytometry. Data (means ± SEM) are from four independent experiments with n = 9, 10, and 7 mice in total for WT, +/1013, and 1013/1013 groups, respectively. Statistics were calculated with the nonparametric Kruskal–Wallis H test (###p = 0.0004 for stroma; ##p = 0.0013 for OPC) and the unpaired two-tailed Student’s t test (+/1013 vs WT **p = 0.0011, 1013/1013 vs WT ***p = 0.0002, +/1013 vs 1013/1013 §p = 0.033, for stroma; +/1013 vs WT **p = 0.0049, 1013/1013 vs WT ***p = 0.0003, for OPC). All mice were littermates, females and age-matched (8–12 wk-old). Source data are provided as a Source data file.
Fig. 6
Fig. 6. Cxcr4 desensitization intrinsically regulates in vitro the osteogenic differentiation of skeletal stromal cells.
A Number of colonies formed from bone fractions in CFU-F assays. Data (means ± SEM) are from two independent experiments with n = 4, 6, and 4 mice in total for WT, +/1013, and 1013/1013 groups, respectively. Statistics were calculated with the nonparametric Kruskal–Wallis H test (##p = 0.002) and the unpaired two-tailed Student’s t test (+/1013 vs WT *p = 0.029, 1013/1013 vs WT ***p = 0.0008). B After in vitro loading with BrdU (5 days) or CTV (3 days), the percentages of BrdU+ (left) or CTVlow (right) cells within WT and mutant bone-derived SSCs were determined by flow cytometry. Data (means ± SEM) are from 3 independent experiments with 6 mice in total per group. Statistics were calculated with the nonparametric Kruskal–Wallis H test (#p = 0.0231 and ##p = 0.0047 for BrdU+ and CTVlow, respectively) and the unpaired two-tailed Student’s t test (+/1013 vs WT *p = 0.031, 1013/1013 vs WT **p = 0.0023 for BrdU+; +/1013 vs WT *p = 0.015, 1013/1013 vs WT **p = 0.0054 for CTVlow). C Bar graphs show the percentages of cultured WT or mutant SSCs in the quiescent G0 phase (DAPIlowKi-67, left) or with an apoptotic phenotype (Annexin V+ DAPI-, right) as determined by flow cytometry. Data (means ± SEM) are from three (right panel) or five (left panel) independent SSC cultures per genotype. Statistics were calculated using the unpaired two-tailed Student’s t test (+/1013 vs WT *p = 0.032, 1013/1013 vs WT *p = 0.021). D Doubling time (left) and absolute numbers (right) of WT and mutant SSCs after 3 days of culture. Data (means ± SEM) are from 8, 6, and 5 independent SSC cultures for WT, +/1013, and 1013/1013 groups, respectively. Statistics were calculated using the unpaired two-tailed Student’s t test (+/1013 vs WT *p = 0.028, 1013/1013 vs WT *p = 0.033 for doubling-time; 1013/1013 vs WT *p = 0.048 for SSC). E Alkaline phosphatase (Alp) staining was performed 14 days after initiation of the culture of WT and mutant SSCs in osteogenic medium supplemented every two days with 10 μM AMD3100 or vehicle (PBS) (bars: 100 μm). Quantitative analyses (number of Alp+ cells) were performed under an inverted microscope. Data (means ± SEM) are from 6 independent cultures per genotype. Statistics were calculated with the nonparametric Kruskal–Wallis H test (##p = 0.0022) and the unpaired two-tailed Student’s t test (+/1013 vs WT **p = 0.0075, 1013/1013 vs WT **p = 0.0018). F Alizarin Red staining was performed 21 days after initiation of the culture. Quantitative analyses (means ± SEM) of staining were performed using the osteogenesis assay kit in 12 (vehicle) or 6 (AMD3100) independent cultures per genotype. Statistics were calculated with the nonparametric Kruskal–Wallis H test (###p = 0.0002) and the unpaired two-tailed Student’s t test (+/1013 vs WT ***p = 0.0005, 1013/1013 vs WT ***p < 0.0001). G Expression levels of osteogenic genes were determined by quantitative PCR in 6 independent WT and mutant SSC cultures 14 and 21 days after initiation of the osteogenic culture in the presence or absence of AMD3100. Each individual sample was run in triplicate and was standardized for β-actin expression levels. Results (means ± SEM) are expressed as relative expression compared to WT samples. Statistics were calculated with the nonparametric Kruskal–Wallis H test (#p = 0.038 and 0.0205 for Osx days 14 and 21, respectively; #p = 0.024 and 0.015 for Alp days 14 and 21, respectively; ##p = 0.0063 for Opn days 21; #p = 0.026 for Ocn days 21) and the unpaired two-tailed Student’s t test (1013/1013 vs WT *p = 0.0107 and 0.013 for Osx days 14 and 21, respectively; 1013/1013 vs WT *p = 0.035 and ***p = 0.0001 for Alp days 14 and 21, respectively; +/1013 vs WT *p = 0.022 and 1013/1013 vs WT **p = 0.0056 for Opn days 21; 1013/1013 vs WT **p = 0.0108 for Ocn days 21). All mice were littermates, females, and age-matched (8–12 wk-old). Source data are provided as a Source data file.
Fig. 7
Fig. 7. Normalization of Cxcr4 signaling rescues the osteogenic properties of Cxcr41013-bearing mouse skeletal cells.
A Schematic diagram for daily AMD3100 intra-peritoneal (i.p.) injection for 21 days in WT and mutant mice. Mouse icons were created using the Biorender software (Biorender.com, agreement number: VX255VH9TZ). B Absolute numbers of the indicated stroma cell subsets from bone fractions of WT and mutant mice determined by flow cytometry. Data (means ± SEM) are from 2 independent experiments with 6 PBS injected mice and 11 AMD3100-injected mice in total per genotype. Statistics were calculated using the nonparametric Mann–Whitney test, two-sided, 1013/1013 vs WT *p = 0.041, 1013/1013 (AMD) vs 1013/1013 (vehicle) &p = 0.01 for SSC; 1013/1013 vs WT **p = 0.0022, WT (AMD) vs WT (vehicle) &&p = 0.0065, 1013/1013 (AMD) vs 1013/1013 (vehicle) &&&p = 0.0003 for OPC. C BM sections from WT and mutant mice treated with vehicle (PBS) or AMD3100 were immunostained for Opn in association with DAPI. Bars: 500 μm. Images are representative of 3 independent determinations. D Bone mineral density (BMD) values of lumbar spine from 6 treated mice in total per group are shown. Statistics were calculated using the nonparametric Mann–Whitney test, two-sided, +/1013 vs WT *p = 0.041, 1013/1013 vs WT **p = 0.0022, +/1013 (AMD) vs +/1013 (vehicle) &&p = 0.0087, 1013/1013 (AMD) vs 1013/1013 (vehicle) &p = 0.026. E Cortical thickness was measured in sections stained with Toluidine Blue. Both cortices were measured and data are presented as a mean of both cortices from 6 mice in total per group. Statistics were calculated using the nonparametric Mann–Whitney test, two-sided, 1013/1013 vs WT **p = 0.026. Data (means ± SEM) displayed in (D) and (E) are from 2 independent experiments. All mice were littermates, females and age-matched (8–12 wk-old). Source data are provided as a Source data file.
Fig. 8
Fig. 8. BM stromal cells from WS patients displayed in vitro impaired osteogenic capacities.
A Relative expression levels of osteogenic genes were determined by quantitative PCR at day 14 in osteogenic-induced cultures of two WS patients-derived BMSCs and 7 healthy donors-derived BMSCs. Each individual sample was run in triplicate and was standardized for 36B4 expression levels. Results (means ± SEM) are expressed as relative expression compared to healthy samples (set at 1 and representing the mean of the 7 healthy donors) and are from 2 independent experiments. Statistics were calculated using the nonparametric Mann–Whitney test, two-sided, **p = 0.0079 for OSX, RUNX2, and OCN; *p = 0.0179 for OPN. B Alizarin Red staining was performed 21 days after initiation of the culture of 1.5 × 103 healthy or WS BMSCs in pro-osteogenic medium (left panel). Representative images for healthy (H) and WS donors #1 and #2 are shown. Quantitative analyses of staining (means ± SEM) were performed using the osteogenesis assay kit in 3 independent cultures with 2 WS and 6 healthy donors (right panel). Statistics were calculated using the nonparametric Mann–Whitney test, two-sided, **p = 0.0022 for healthy. C Oil Red O staining was performed 21 days after initiation of cultures of healthy or WS BMSCs in pro-adipogenic differentiation medium. Bars: 200 μm. D Proposed model: Proper Cxcr4 signaling termination is essential for bone tissue homeostasis. Absence of Cxcr4 desensitization leads to imbalance in bone remodeling with decreased OBL-mediated bone formation and increased OCL-mediated bone resorption, leading to severe trabecular and cortical alterations and a subsequent osteoporotic-like phenotype. Mechanistically, impaired Cxcr4 desensitization disrupts the osteogenic commitment of SSCs, while strikingly increasing their pro-osteoclastogenic capacities. Graphical abstract was created using the Biorender software (Biorender.com, agreement number: EL255UV5RI). Source data are provided as a Source data file.

References

    1. Wei Q, Frenette PS. Niches for hematopoietic stem cells and their progeny. Immunity. 2018;48:632–648. doi: 10.1016/j.immuni.2018.03.024. - DOI - PMC - PubMed
    1. Bianco P. Stem cells and bone: a historical perspective. Bone. 2015;70:2–9. doi: 10.1016/j.bone.2014.08.011. - DOI - PubMed
    1. Baryawno N, et al. A cellular taxonomy of the bone marrow stroma in homeostasis and leukemia. Cell. 2019;177:1915–1932.e1916. doi: 10.1016/j.cell.2019.04.040. - DOI - PMC - PubMed
    1. Grassinger J, Haylock DN, Williams B, Olsen GH, Nilsson SK. Phenotypically identical hemopoietic stem cells isolated from different regions of bone marrow have different biologic potential. Blood. 2010;116:3185–3196. doi: 10.1182/blood-2009-12-260703. - DOI - PubMed
    1. Kiel MJ, et al. SLAM family receptors distinguish hematopoietic stem and progenitor cells and reveal endothelial niches for stem cells. Cell. 2005;121:1109–1121. doi: 10.1016/j.cell.2005.05.026. - DOI - PubMed

Publication types

Substances

Supplementary concepts