. 2023 Apr 12;14(1):2074.
doi: 10.1038/s41467-023-37494-w.

The RNA-binding protein landscapes differ between mammalian organs and cultured cells

Affiliations

The RNA-binding protein landscapes differ between mammalian organs and cultured cells

Joel I Perez-Perri et al. Nat Commun. .

Abstract

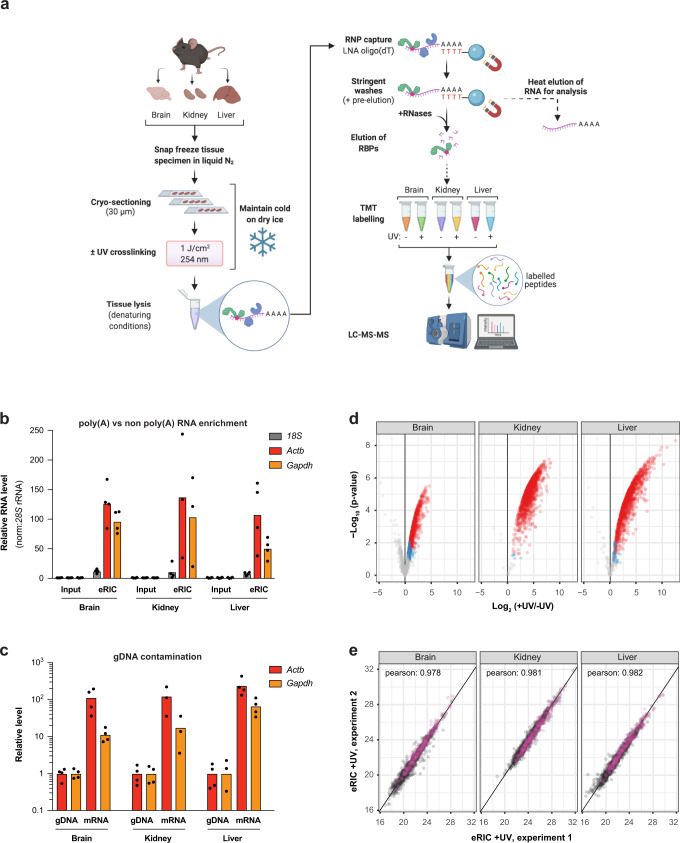
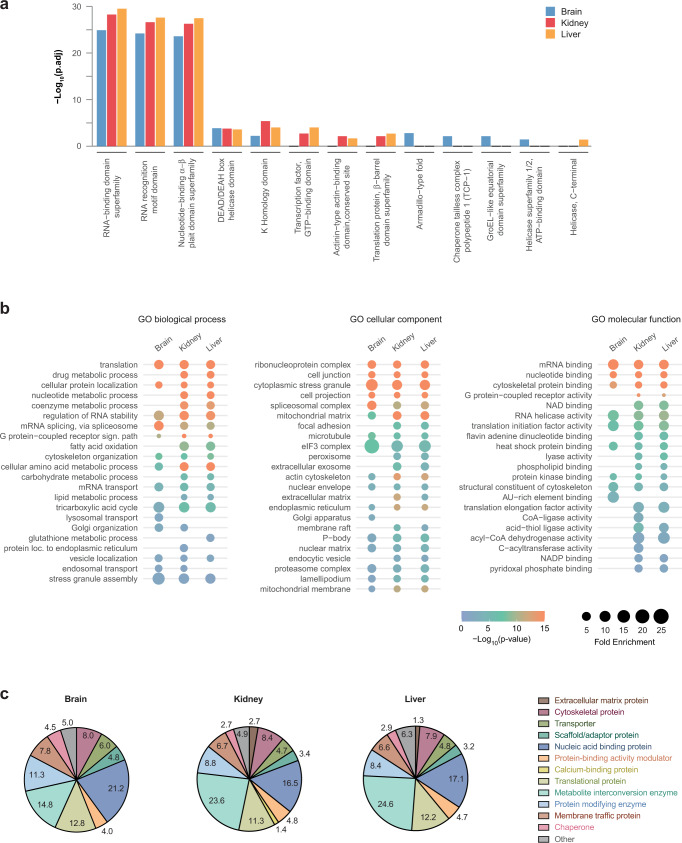
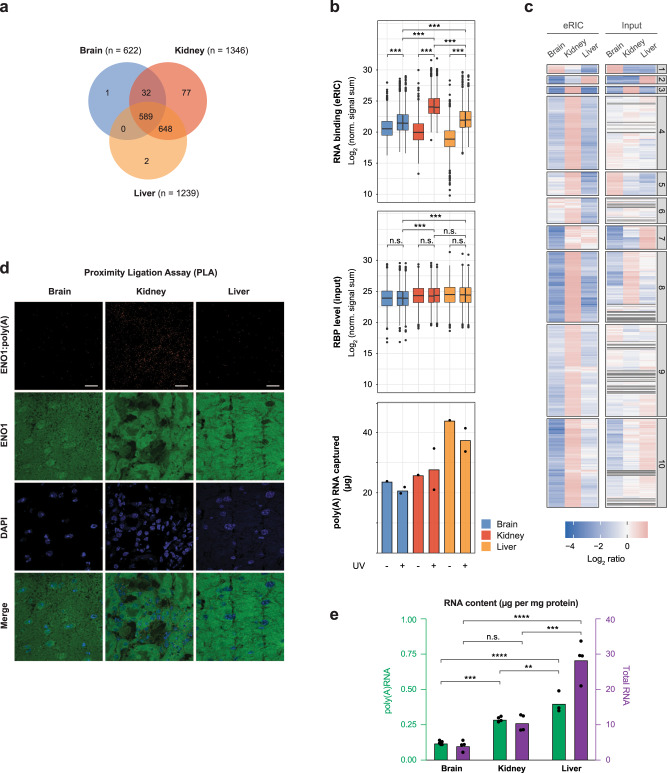
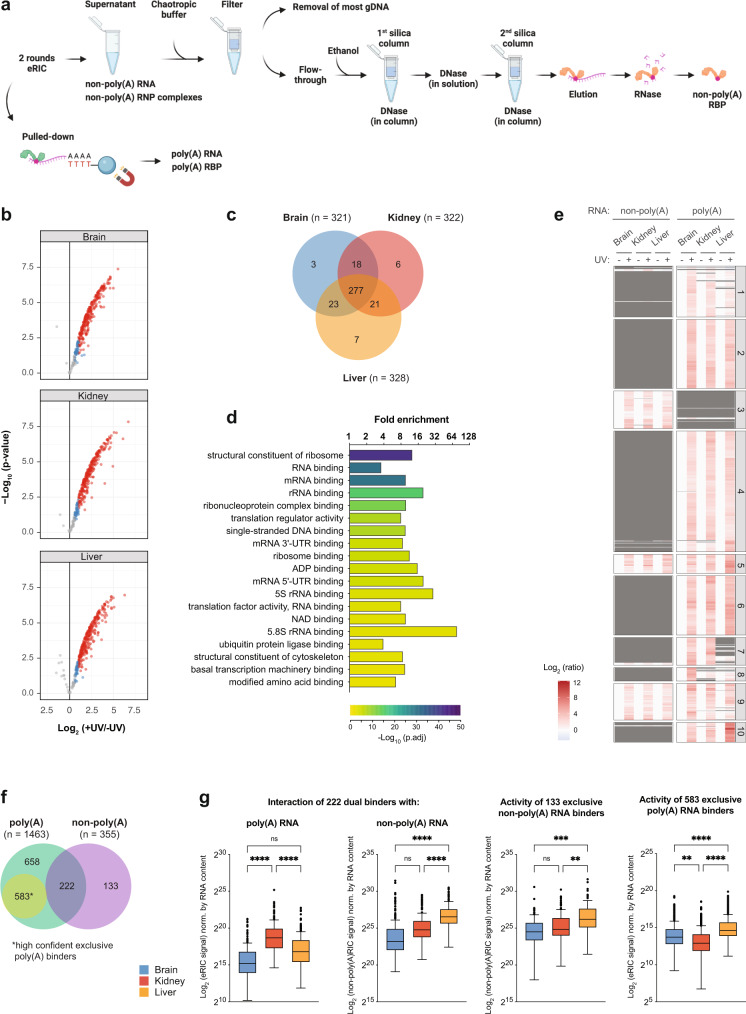
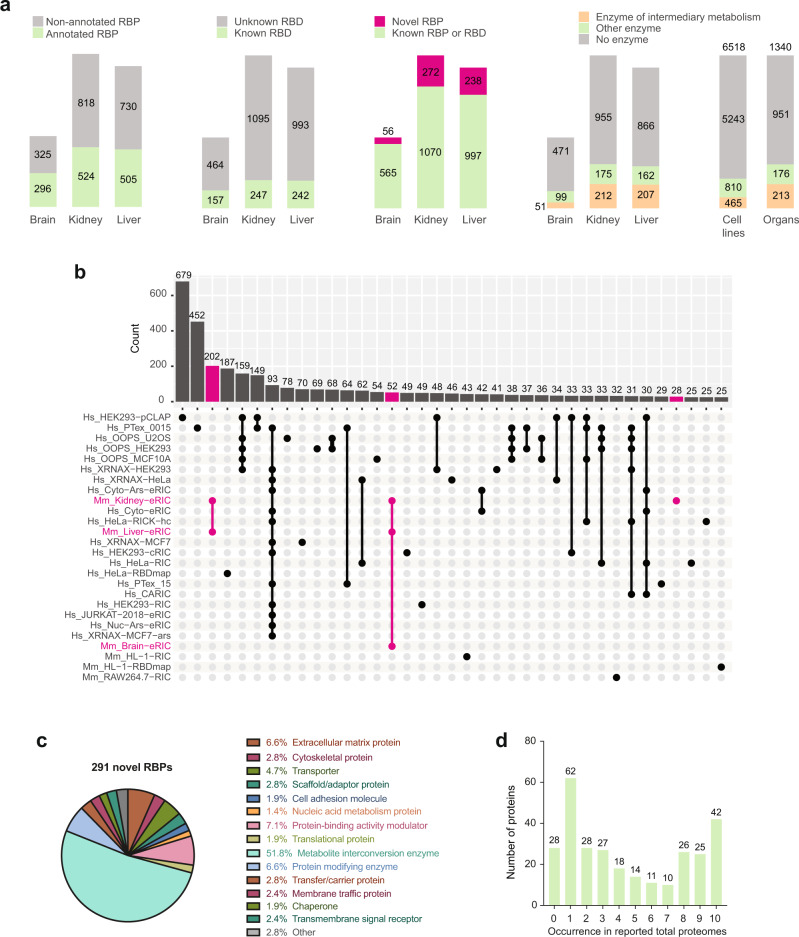
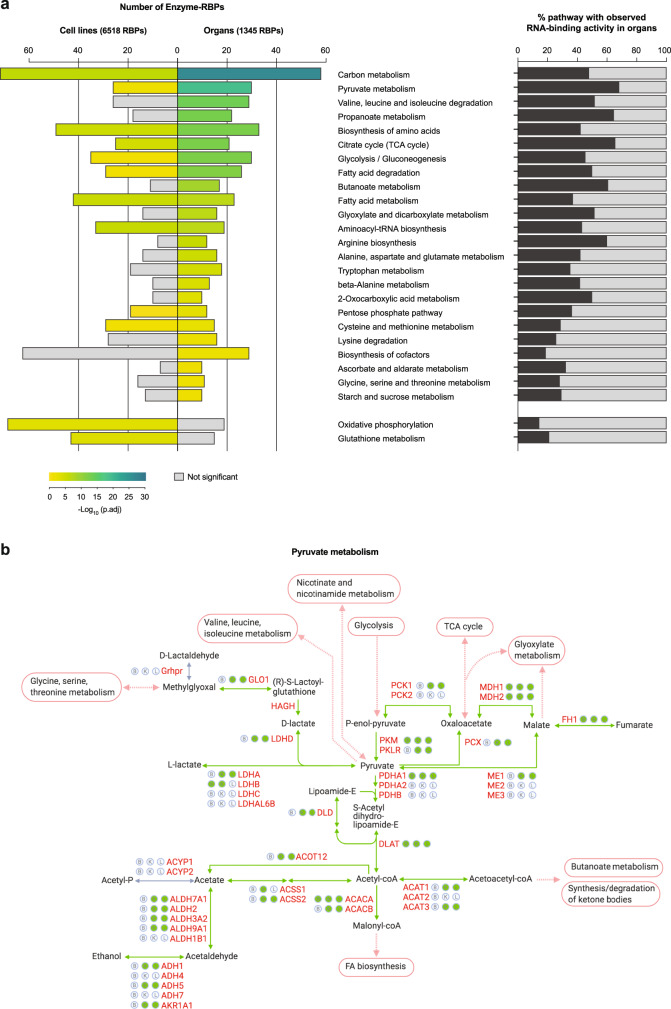
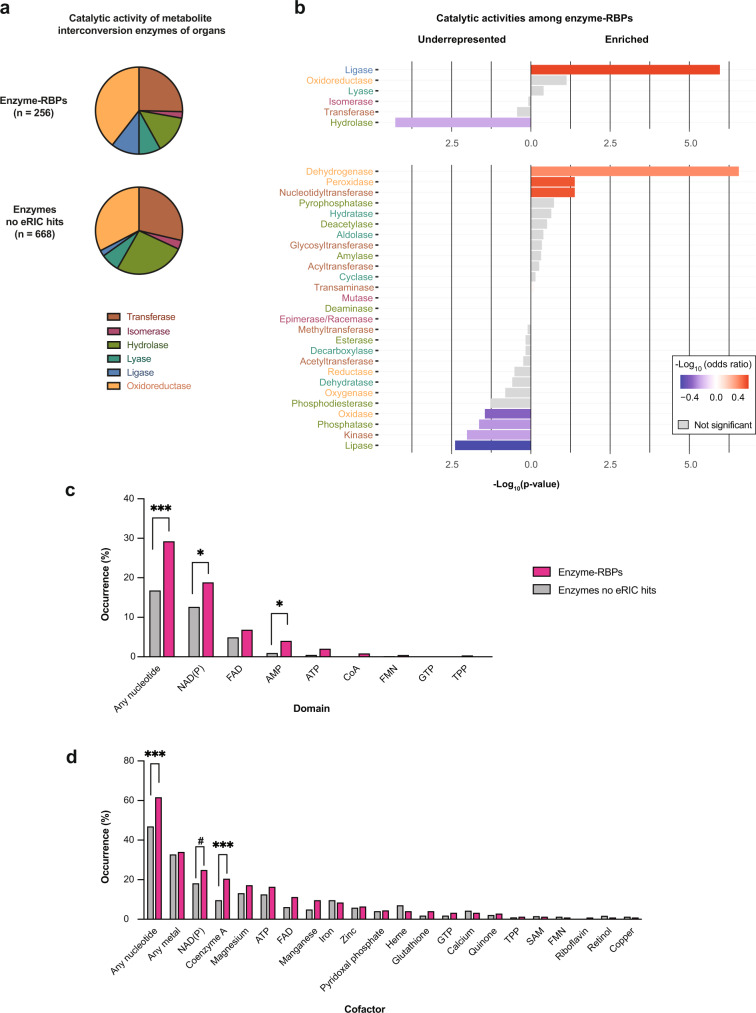
System-wide approaches have unveiled an unexpected breadth of the RNA-bound proteomes of cultured cells. Corresponding information regarding RNA-binding proteins (RBPs) of mammalian organs is still missing, largely due to technical challenges. Here, we describe ex vivo enhanced RNA interactome capture (eRIC) to characterize the RNA-bound proteomes of three different mouse organs. The resulting organ atlases encompass more than 1300 RBPs active in brain, kidney or liver. Nearly a quarter (291) of these had formerly not been identified in cultured cells, with more than 100 being metabolic enzymes. Remarkably, RBP activity differs between organs independent of RBP abundance, suggesting organ-specific levels of control. Similarly, we identify systematic differences in RNA binding between animal organs and cultured cells. The pervasive RNA binding of enzymes of intermediary metabolism in organs points to tightly knit connections between gene expression and metabolism, and displays a particular enrichment for enzymes that use nucleotide cofactors. We describe a generically applicable refinement of the eRIC technology and provide an instructive resource of RBPs active in intact mammalian organs, including the brain.


Conflict of interest statement

The authors declare no competing interests.

Figures

Fig. 1
Fig. 1. A method for the specific determination of the poly(A) RNA-bound proteomes of mammalian organs.
a Schematic representation of ex vivo eRIC (enhanced RNA interactome capture) applied to organs. Intact flash-frozen organs are sectioned into 30 µm slices amenable for UV irradiation. Following UV crosslinking (indicated by a red dot), tissue sections are lysed under denaturing conditions. RNA-binding proteins (RBPs) bound to polyadenylated RNA are subsequently isolated under highly stringent conditions using an LNA-modified oligo(dT) probe coupled to magnetic beads,. A fraction of the isolated material is used for RNA analysis. The rest is subjected to RNase digestion to retrieve RBPs. Following solid-phase-enhanced sample preparation (SP3),, peptides subjected to tandem mass tag (TMT) labeling are multiplexed and analyzed using LC-MS/MS (liquid chromatography/tandem mass spectrometry). Created with BioRender.com. b–e ex vivo eRIC was used to characterize the RNA-bound proteomes of the brain, kidney, and liver from adult C57BL6/J mice. b RT-qPCR analysis of 18S rRNA as well as Actb and Gapdh mRNA abundance in eRIC eluates versus input, demonstrating enrichment of mRNA. Values are expressed relative to the respective input (input mean corresponds to 1.0). c qPCR analysis of mRNA versus genomic DNA (gDNA) for the housekeeping genes Actb and Gapdh, showing that gDNA contamination is minor. b, c n = 4 biologically independent experiments. d Volcano plots showing significant enrichment of RBPs in UV crosslinked over non-irradiated samples. Red dots, hits: FDR <0.05, FC >2. Blue dots, candidates: FDR <0.2, FC >1.5 (moderated two-sided t-test with FDR multiple testing correction). The combined ex vivo eRIC data from the brain, kidney, and liver reveal more than 1300 hit RBPs (see Supplementary Data 1). e Scatter plots comparing the normalized signal sums in ex vivo eRIC eluates obtained from independent experiments performed with distinct animals. Pink dots, proteins harboring known RNA-binding domains (see section “eRIC uncovers organ RBPs not previously detected in cultured cells”). d, e for each organ, four +UV eRIC eluates were generated, each derived from a single mouse; eRIC eluates from two mice were combined, rendering n = 2. Organ sections from four mice were pooled to generate one -UV eRIC eluate per organ (n = 1). Source data are provided as a Source Data file.
Fig. 2
Fig. 2. Characteristic features of the RBPs from mouse brain, kidney, and liver.
a Protein domains highly represented among ex vivo eRIC hits (Fisher’s one-tailed test with independent hypothesis weighting (IHW) for multiple testing correction). Blue, brain; red, kidney; orange, liver. b Gene Ontology (GO)-term enrichment analysis (Fisher’s one-tailed test with Bonferroni correction for multiple testing). Selected GO terms corresponding to biological process, molecular function, and cellular component are displayed (see Supplementary Data 8 for the full list of GO terms). c Protein class distribution among the three tissues studied based on the PANTHER protein class ontology.
Fig. 3
Fig. 3. Comparative analysis of RBPs from mouse brain, kidney, and liver.
a Venn diagram showing the number of shared and organ-specific RBPs identified. b Normalized signal sum of identified RBPs in ex vivo eRIC eluates (upper panel) and the corresponding input samples (middle panel) for each organ analyzed. Blue, brain; red, kidney; orange, liver. Center lines indicate the median, box borders represent the interquartile range (IQR), and whiskers extend to ±1.5 time the IQR; outliers are shown as black dots (pairwise comparisons using two-sided t-test with FDR correction, ***p.adj <2e-16; n.s.: not significant). Bottom panel: amount of poly(A) RNA isolated from each organ by eRIC. Note that the retrieved mass of protein (upper panel) differs extensively across the tissues analyzed (with kidney > liver > brain) and does not correlate with the mass of RNA recovered (bottom panel) (see also Supplementary Data 2). For each organ, four +UV eRIC eluates were generated, each derived from a single mouse; eRIC eluates from two mice were combined, rendering n = 2. Organ sections from four mice were pooled to generate one -UV eRIC eluate per organ (n = 1). c Hierarchical clustering and heatmap of the RBPs identified in the brain, kidney, and liver, showing protein abundance in eRIC eluates (left columns) and inputs (right columns) across the three organs (shown as the Log.2 ratio of protein abundance in each eRIC or input sample relative to the average protein abundance in corresponding eRIC and input samples). d Representative images of three biologically independent experiments of the proximity ligation assay (PLA) for interactions of ENO1 and poly(A) RNA, nuclear staining (DAPI), and ENO1 immunofluorescence in the brain, kidney, and liver. Scale bar, 20 µM. See quantification in Supplementary Fig. 2b. e poly(A) (green) and total RNA (violet) levels, in the brain, kidney, and liver, expressed as µg of RNA per mg of total protein. non-poly(A) RNA, n = 4 biologically independent experiments. Poly(A) RNA, n = 3, 4, 5 biologically independent experiments for liver, kidney, and brain, respectively. **p.adj < 0.01, ***p.adj < 0.001, ****p.adj < 0.0001, n.s.: not significant (one-way ANOVA with Tukey post hoc test). Poly(A) RNA: BvsK, p.adj = 2.76e-4; BvsL, p.adj = 9e-6; KvsL, p.adj = 9.36e-3. Total RNA: BvsK, p.adj = 6.34e-2; BvsL, p.adj = 1.0e-5; KvsL, p.adj = 1.24e-4. Source data are provided as a Source Data file.
Fig. 4
Fig. 4. Determination of the non-poly(A) RNA-bound proteomes of mammalian organs.
a Schematic representation of non-poly(A)RIC. eRIC supernatants are depleted of poly(A) RNA by oligo(dT) bead selection and hence predominantly contain non-poly(A) RNA and non-poly(A) RNP complexes that were purified by modified 2C. Created with BioRender.com. b Volcano plots showing significant enrichment of RBPs in UV crosslinked over non-irradiated samples. Red dots, hits: FDR <0.05, FC >2. Blue dots, candidates: FDR <0.2, FC >1.5 (moderated two-sided t-test with FDR multiple testing correction). c Venn diagram showing the number of shared and organ-specific non-poly(A) RBPs identified. d Gene Ontology (GO)-term enrichment analysis (Fisher’s one-tailed test with g:SCS multiple testing correction). Selected GO terms corresponding to molecular function are displayed (see Supplementary Data 9 for the full list of GO terms). e Hierarchical clustering and heatmap of the poly(A) and non-poly(A) RBPs identified in the brain, kidney, and liver, shown as the Log.2 ratio of protein abundance in irradiated versus non-irradiated samples. f Venn diagram depicting the number of proteins interacting exclusively with poly(A) RNA or non-poly(A) RNA or with both biotypes of RNA. High-confident poly(A) RNA binders (in yellow) are defined as the eRIC hits that were not detected neither in the non-poly(A) RNA-bound proteomes described here nor in an in-depth analysis of non-poly(A) RNA binders performed in the liver (see below). g Normalized signal sum of identified poly(A), non-poly(A), and dual RBPs, as appropriate, in ex vivo eRIC eluates (first and fourth panels) and non-poly(A)RIC (middle two panels). Protein signal was adjusted by RNA content (Fig. 3e). Blue, brain; red, kidney; orange, liver. Center lines indicate the median, box borders represent the interquartile range (IQR), and whiskers extend to ±1.5 times the IQR; outliers are shown as black dots. For each organ, four +UV eRIC and four +UV non-poly(A)RIC eluates were generated, each derived from a single mouse; eRIC and non-poly(A)RIC eluates from two mice were combined, rendering n = 2. Organ sections from four mice were pooled to generate one -UV eRIC and one non-poly(A)RIC eluate per organ (n = 1). **p.adj < 0.01, ***p.adj < 0.001, ****p.adj < 0.0001, n.s.: not significant (one-way ANOVA with Tukey post hoc test).
Fig. 5
Fig. 5. Ex vivo eRIC uncovers many novel RBPs.
a For each organ, the number of eRIC hits that are annotated RBPs, that bear a known RNA-binding domain (RBD), and that are novel RBPs (i.e., not previously reported as RBP or as bearing an RBD, and not identified in any published study). Right: Number of RBPs identified in organs or cell lines that are (metabolic) enzymes. b Upset plot representing the number of RBPs (y-axis) shared between this study and published lists of mouse and human RBPs (only intersections comprising 25 or more RBPs are shown). a, b Pink, novel RBPs. c Protein class annotation of the novel RBPs identified in any of the three organs studied (based on PANTHER protein class ontology). Note that compared to the overall RBP dataset (see Fig. 2c), the class “translational protein” is under-represented, while the category “Metabolite interconversion enzyme” is over-represented. d The presence of the identified novel RBPs in total proteomes of ten different cell lines employed in previous RBP profiling studies was interrogated using public data (see methods). The number of novel RBPs (y-axis) identified in inputs across an increasing number of cell lines (x-axis) is shown.
Fig. 6
Fig. 6. Pervasive RNA binding of metabolic enzymes in mouse organs.
a On the left, KEGG pathway enrichment analysis among the RBPs identified in at least one organ or, for comparison, in at least one published RBP library in cultured cells (Fisher’s one-tailed test with g:SCS multiple testing correction). The most enriched metabolic pathways among organ RBPs are displayed; two pathways highly represented among cell culture RBPs but not among organ RBPs are shown at the bottom. The size of the bars indicates the number of proteins identified as RBP for a given KEGG pathway. On the right, fraction of proteins in a given KEGG pathway that have been identified as RBP by ex vivo eRIC in the brain, kidney, or liver. b Schematic representation (based on the KEGG database) of pyruvate metabolism in mouse. Filled green circles next to protein names denote the RNA-binding activity of the corresponding enzyme in the brain (B), kidney (K), or liver (L); empty circles denote the absence of evidence for RNA association. Reactions catalyzed by enzyme-RBPs are represented as green arrows.
Fig. 7
Fig. 7. Enzyme-RBPs broadly interact with nucleotide cofactors.
a Enzymes of intermediary metabolism (metabolite interconversion enzymes in PANTHER protein class) identified as eRIC hits in the brain, kidney, or liver (designated Enzyme-RBPs) were classified based on their catalytic activity; for comparison, the same classification was applied to enzymes of intermediary metabolism that were expressed in at least one organ but were not identified as eRIC hits. b Catalytic activity enrichment analysis among the enzyme-RBPs identified in mouse organs (Fisher’s one-tailed test without correction for multiple comparison). The upper and bottom panels show, respectively, the main types and corresponding subtypes of enzymatic activities (indicated by the same distinct color in both panels). c, d Bar graphs indicating the proportion of enzymes expressed in organs and identified (pink) or not (gray) as eRIC hits that bear typical nucleotide-binding domains (any nucleotide, p.adj = 4.29e-4; NAD(P), p.adj = 4.63e-2; AMP, p.adj = 1.18e-2) (c) or employ specific cofactors (any nucleotide, p.adj = 8,77e-4; CoA, p.adj = 6.01e-4) (d). *p.adj <0.05, ***p.adj <0.001, #p.adj = 0.065 testing specifically nucleotide cofactors in (d) (Fisher’s exact test with Benjamini–Hochberg correction).

Similar articles

Cited by

References

    1. Hentze MW, Castello A, Schwarzl T, Preiss T. A brave new world of RNA-binding proteins. Nat. Rev. Mol. Cell Biol. 2018;19:327–341. doi: 10.1038/nrm.2017.130. - DOI - PubMed
    1. Gebauer F, Schwarzl T, Valcarcel J, Hentze MW. RNA-binding proteins in human genetic disease. Nat. Rev. Genet. 2021;22:185–198. doi: 10.1038/s41576-020-00302-y. - DOI - PubMed
    1. Baltz AG, et al. The mRNA-bound proteome and its global occupancy profile on protein-coding transcripts. Mol. Cell. 2012;46:674–690. doi: 10.1016/j.molcel.2012.05.021. - DOI - PubMed
    1. Castello A, et al. Insights into RNA biology from an atlas of mammalian mRNA-binding proteins. Cell. 2012;149:1393–1406. doi: 10.1016/j.cell.2012.04.031. - DOI - PubMed
    1. Perez-Perri JI, et al. Discovery of RNA-binding proteins and characterization of their dynamic responses by enhanced RNA interactome capture. Nat. Commun. 2018;9:4408. doi: 10.1038/s41467-018-06557-8. - DOI - PMC - PubMed

Publication types