

Application of Mendelian randomization to explore the causal role of the human gut microbiome in colorectal cancer
- PMID: 37045850
- PMCID: PMC10097673
- DOI: 10.1038/s41598-023-31840-0
Application of Mendelian randomization to explore the causal role of the human gut microbiome in colorectal cancer
Erratum in
-
Author Correction: Application of Mendelian randomization to explore the causal role of the human gut microbiome in colorectal cancer.Sci Rep. 2023 Jul 26;13(1):12131. doi: 10.1038/s41598-023-38170-1. Sci Rep. 2023. PMID: 37495615 Free PMC article. No abstract available.
Abstract
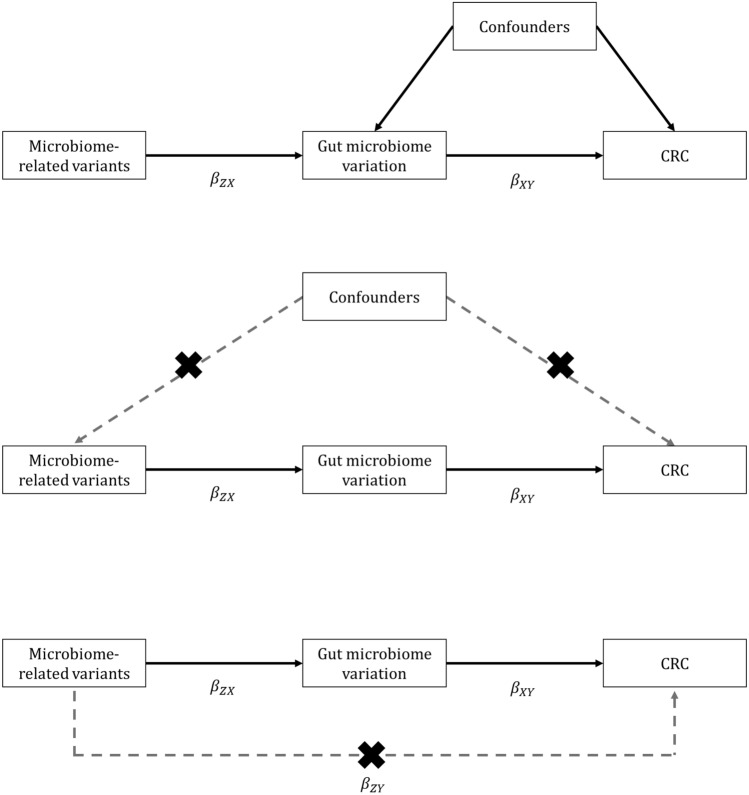
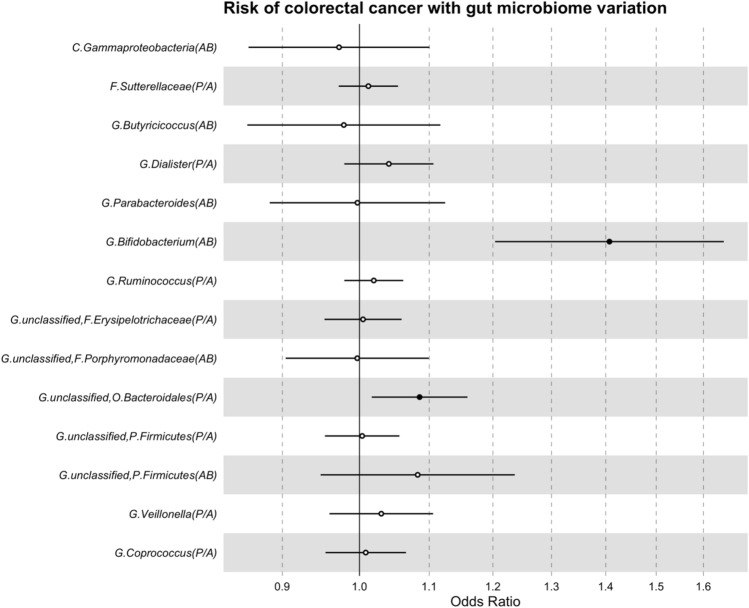
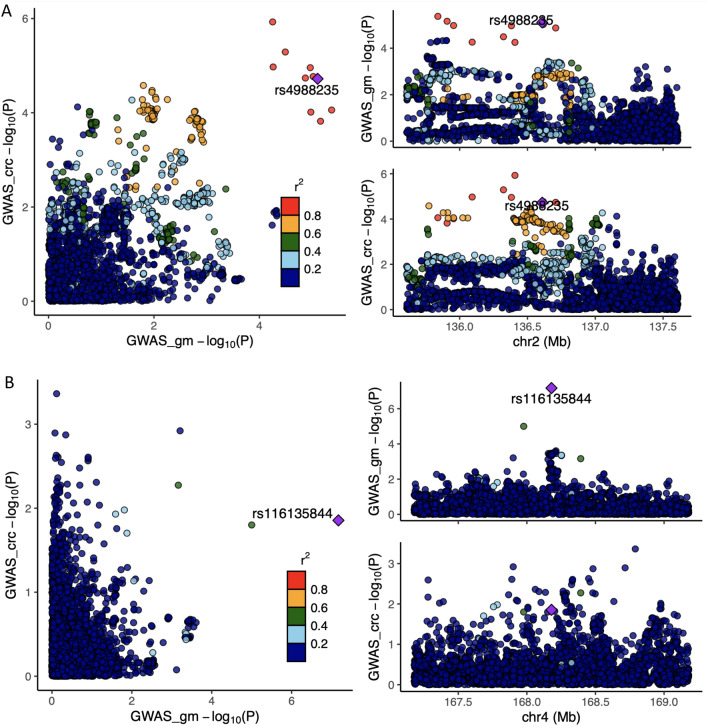
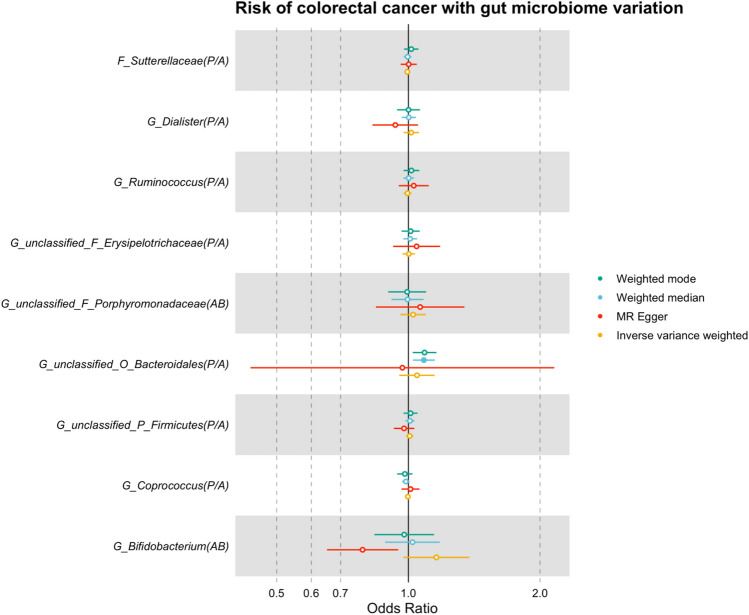
The role of the human gut microbiome in colorectal cancer (CRC) is unclear as most studies on the topic are unable to discern correlation from causation. We apply two-sample Mendelian randomization (MR) to estimate the causal relationship between the gut microbiome and CRC. We used summary-level data from independent genome-wide association studies to estimate the causal effect of 14 microbial traits (n = 3890 individuals) on overall CRC (55,168 cases, 65,160 controls) and site-specific CRC risk, conducting several sensitivity analyses to understand the nature of results. Initial MR analysis suggested that a higher abundance of Bifidobacterium and presence of an unclassified group of bacteria within the Bacteroidales order in the gut increased overall and site-specific CRC risk. However, sensitivity analyses suggested that instruments used to estimate relationships were likely complex and involved in many potential horizontal pleiotropic pathways, demonstrating that caution is needed when interpreting MR analyses with gut microbiome exposures. In assessing reverse causality, we did not find strong evidence that CRC causally affected these microbial traits. Whilst our study initially identified potential causal roles for two microbial traits in CRC, importantly, further exploration of these relationships highlighted that these were unlikely to reflect causality.
© 2023. The Author(s).
Conflict of interest statement
The authors declare no competing interests.
Figures
Similar articles
-
Identification of host gene-microbiome associations in colorectal cancer patients using mendelian randomization.J Transl Med. 2023 Aug 10;21(1):535. doi: 10.1186/s12967-023-04335-9. J Transl Med. 2023. PMID: 37563724 Free PMC article.
-
Causality Investigation between Gut Microbiome and Sleep-Related Traits: A Bidirectional Two-Sample Mendelian Randomization Study.Genes (Basel). 2024 Jun 12;15(6):769. doi: 10.3390/genes15060769. Genes (Basel). 2024. PMID: 38927705 Free PMC article.
-
Gene prediction of immune cells association between gut microbiota and colorectal cancer: a Mendelian randomization study.Front Immunol. 2025 Jan 31;16:1460936. doi: 10.3389/fimmu.2025.1460936. eCollection 2025. Front Immunol. 2025. PMID: 39958359 Free PMC article.
-
Causal relationship between gut microbiota and polycystic ovary syndrome: a literature review and Mendelian randomization study.Front Endocrinol (Lausanne). 2024 Feb 1;15:1280983. doi: 10.3389/fendo.2024.1280983. eCollection 2024. Front Endocrinol (Lausanne). 2024. PMID: 38362275 Free PMC article. Review.
-
Genetic liability of gut microbiota for idiopathic pulmonary fibrosis and lung function: a two-sample Mendelian randomization study.Front Cell Infect Microbiol. 2024 May 22;14:1348685. doi: 10.3389/fcimb.2024.1348685. eCollection 2024. Front Cell Infect Microbiol. 2024. PMID: 38841114 Free PMC article.
Cited by
-
Gut microbial subtypes and clinicopathological value for colorectal cancer.Cancer Med. 2024 Sep;13(17):e70180. doi: 10.1002/cam4.70180. Cancer Med. 2024. PMID: 39234654 Free PMC article.
-
Standardization of gut microbiome analysis in sports.Cell Rep Med. 2024 Oct 15;5(10):101759. doi: 10.1016/j.xcrm.2024.101759. Epub 2024 Oct 4. Cell Rep Med. 2024. PMID: 39368478 Free PMC article. Review.
-
Causality of the gut microbiome and atherosclerosis-related lipids: a bidirectional Mendelian Randomization study.BMC Cardiovasc Disord. 2024 Mar 2;24(1):138. doi: 10.1186/s12872-024-03804-3. BMC Cardiovasc Disord. 2024. PMID: 38431594 Free PMC article.
-
Addressing the credibility crisis in Mendelian randomization.BMC Med. 2024 Sep 11;22(1):374. doi: 10.1186/s12916-024-03607-5. BMC Med. 2024. PMID: 39256834 Free PMC article. Review.
-
Mendelian randomisation analysis for intestinal disease: achievement and future.eGastroenterology. 2024 Jun 17;2(2):e100058. doi: 10.1136/egastro-2023-100058. eCollection 2024 Apr. eGastroenterology. 2024. PMID: 39944470 Free PMC article. Review.
References
Publication types
MeSH terms
Grants and funding
- UG1 CA189974/CA/NCI NIH HHS/United States
- BRC-1215-2001/DH_/Department of Health/United Kingdom
- 202802/Z/16/Z/WT_/Wellcome Trust/United Kingdom
- WT_/Wellcome Trust/United Kingdom
- 001/WHO_/World Health Organization/International
- RCCPDF\100007/CRUK_/Cancer Research UK/United Kingdom
- P30 ES010126/ES/NIEHS NIH HHS/United States
- 217065/Z/19/Z/WT_/Wellcome Trust/United Kingdom
- U01 CA261961/CA/NCI NIH HHS/United States
- MC_UU_00011/1/MRC_/Medical Research Council/United Kingdom
- R01 CA263776/CA/NCI NIH HHS/United States
- 29019/CRUK_/Cancer Research UK/United Kingdom
- C18281/A29019/CRUK_/Cancer Research UK/United Kingdom
