. 2023 Apr 12;14(1):2092.
doi: 10.1038/s41467-023-37690-8.

Characterization of genome-wide STR variation in 6487 human genomes

Affiliations

Characterization of genome-wide STR variation in 6487 human genomes

Yirong Shi et al. Nat Commun. .

Abstract

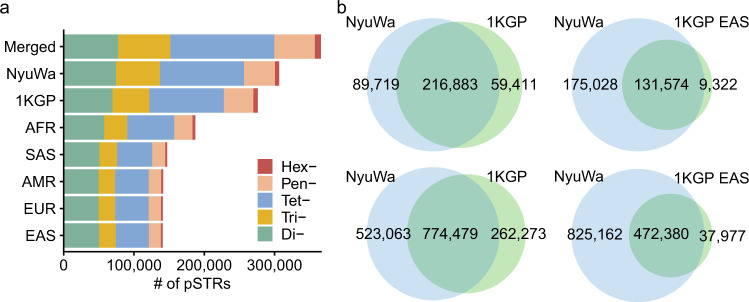
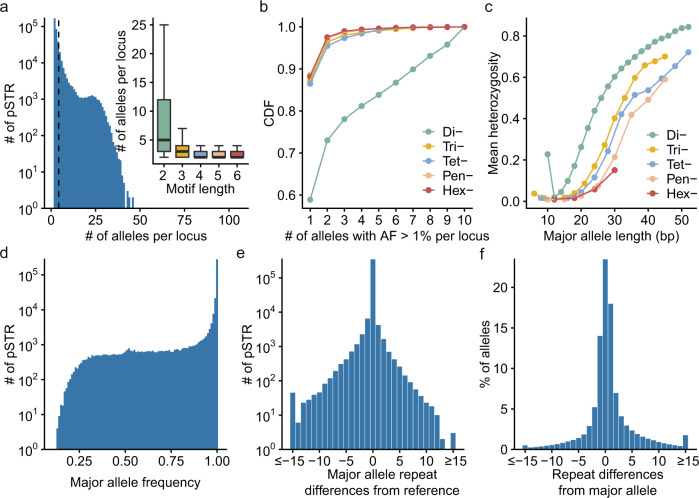
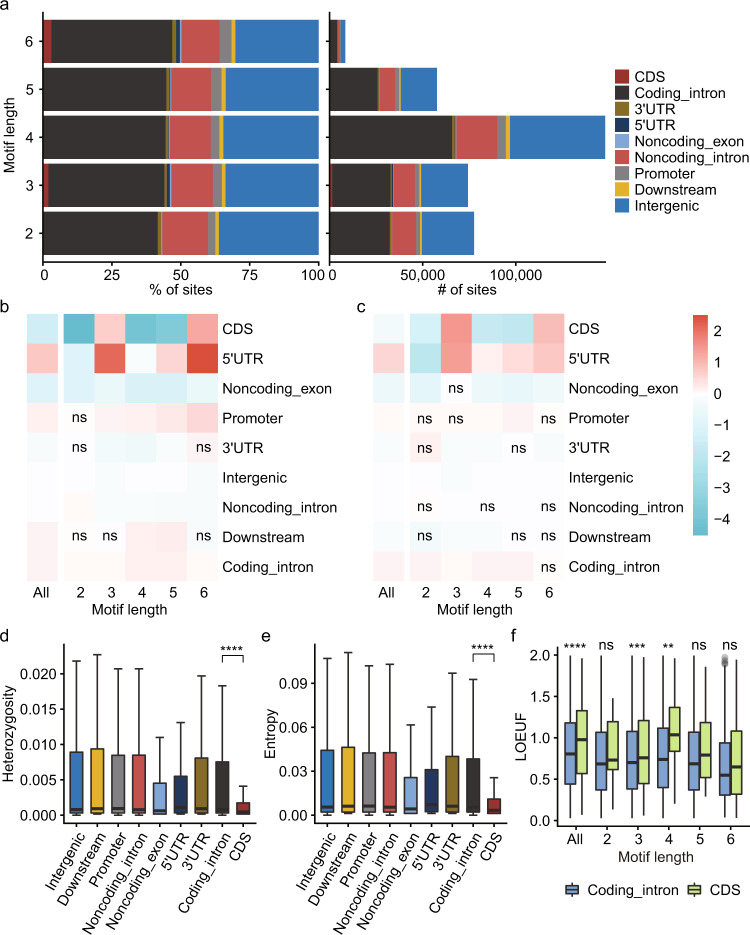
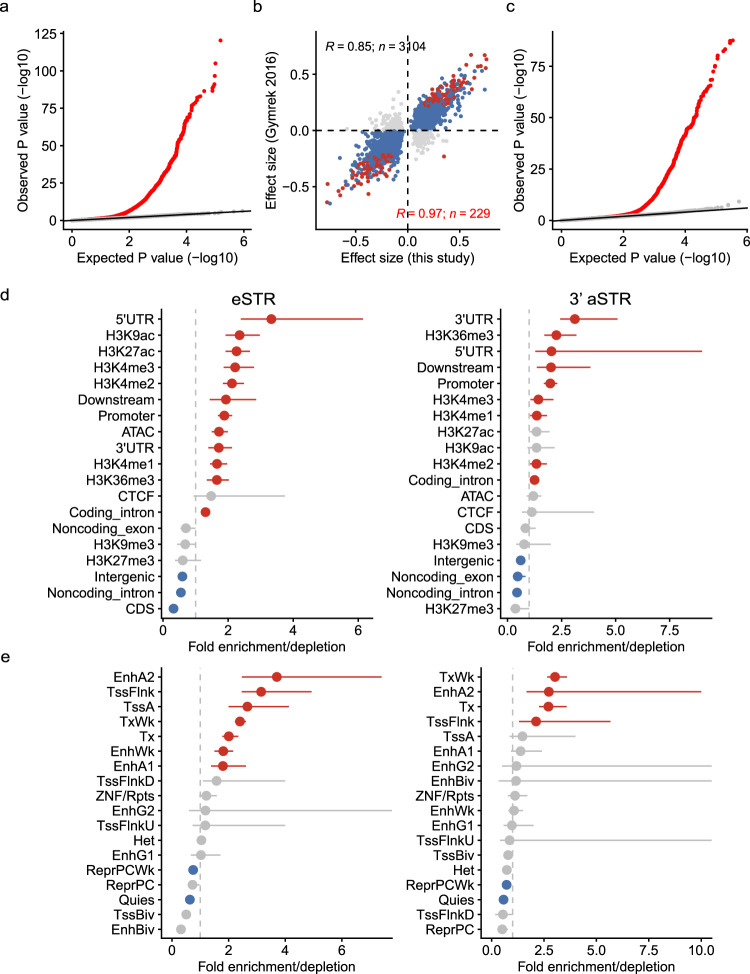
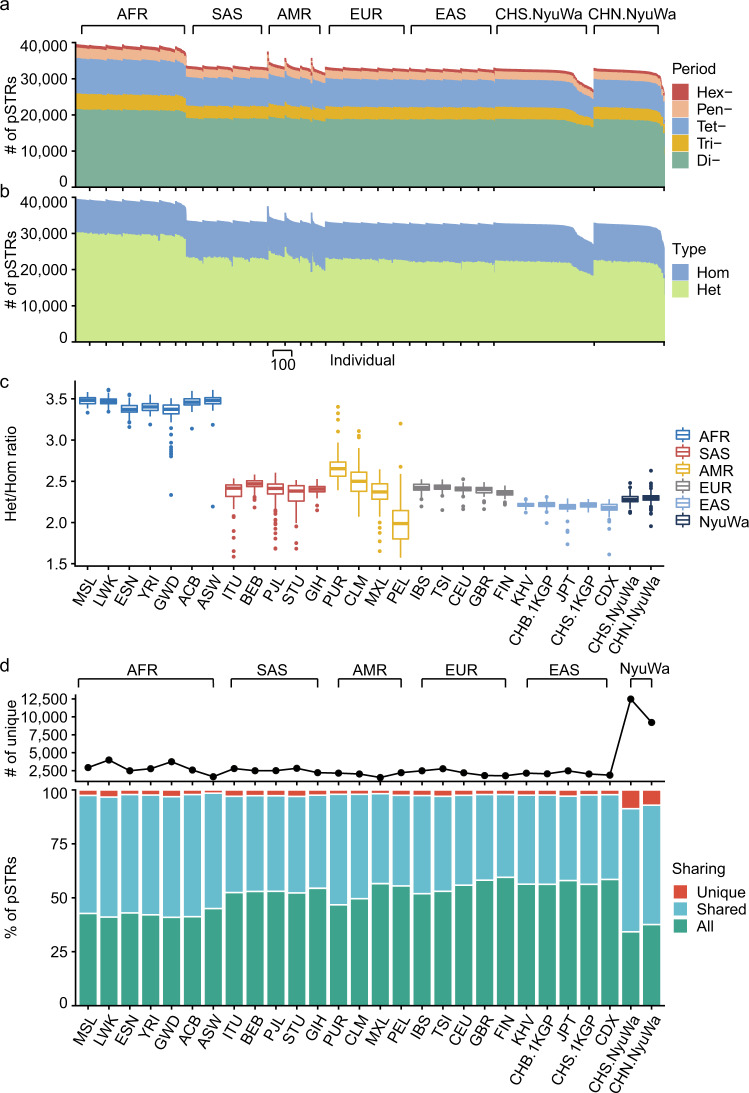
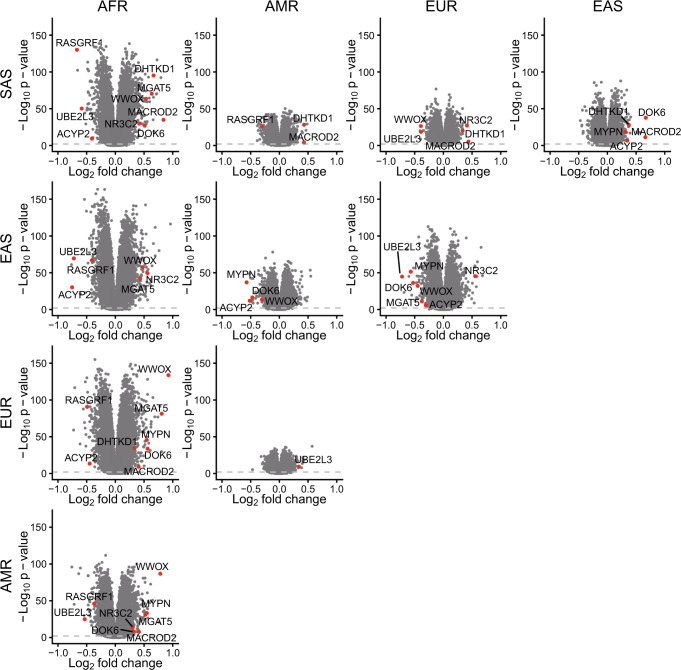
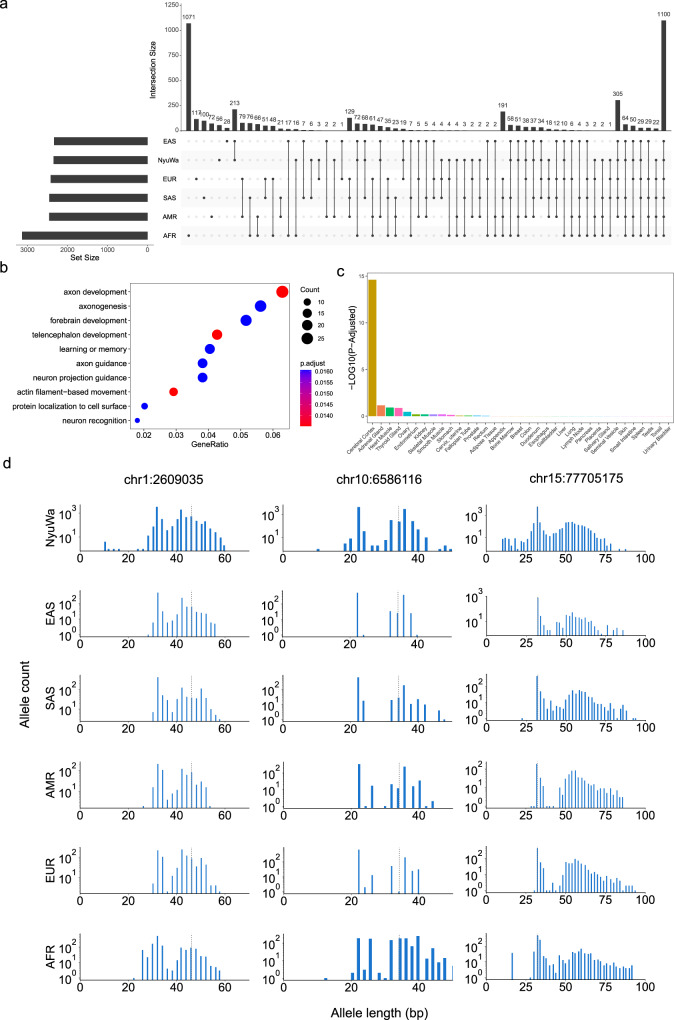
Short tandem repeats (STRs) are abundant and highly mutagenic in the human genome. Many STR loci have been associated with a range of human genetic disorders. However, most population-scale studies on STR variation in humans have focused on European ancestry cohorts or are limited by sequencing depth. Here, we depicted a comprehensive map of 366,013 polymorphic STRs (pSTRs) constructed from 6487 deeply sequenced genomes, comprising 3983 Chinese samples (~31.5x, NyuWa) and 2504 samples from the 1000 Genomes Project (~33.3x, 1KGP). We found that STR mutations were affected by motif length, chromosome context and epigenetic features. We identified 3273 and 1117 pSTRs whose repeat numbers were associated with gene expression and 3'UTR alternative polyadenylation, respectively. We also implemented population analysis, investigated population differentiated signatures, and genotyped 60 known disease-causing STRs. Overall, this study further extends the scale of STR variation in humans and propels our understanding of the semantics of STRs.


Conflict of interest statement

The authors declare no competing interests.

Figures

Fig. 1
Fig. 1. pSTR identified in this study.
a The cumulative number of pSTR loci broken down by dataset, superpopulation, and STR types. b Comparison of the pSTR loci (upper) and pSTR alleles (lower) identified from the NyuWa dataset with those identified from the 1KGP dataset (left) and the East Asian samples in the 1KGP dataset (right).
Fig. 2
Fig. 2. pSTR mutational patterns.
a Distribution of the number of alleles per pSTR locus (n = 366,013). The black dashed line indicates the mean value (4.26) of allele numbers of pSTRs. The inner boxplot shows the same variable grouped by motif length. Horizontal lines indicate the median and boxes span from the lower quartile (the 25th percentiles) to the upper quartile (the 75th percentiles). Whiskers extend to points that are within 1.5× IQR (interquartile range) from the upper or the lower quartiles. b Cumulative distribution function (CDF) of the number of alleles with frequency >0.1% per pSTR locus, which was classified by motif length. c pSTR heterozygosity as a function of the length of the major (most common) allele in base pairs, which was classified by motif length. d Distribution of the frequency of the major allele per pSTR locus. e Distribution of the differences in the repeat number of the major allele from the reference allele per pSTR locus. f Distribution of the difference in the repeat number of each pSTR allele from the major allele of the corresponding pSTR locus.
Fig. 3
Fig. 3. pSTR functional properties.
a Functional consequence for pSTRs stratified by motif length: (left) cumulative proportion and (right) cumulative number. Coding_intron, introns of protein-coding genes; Noncoding_exon, exons of noncoding genes; Noncoding_intron, introns of noncoding genes. b Log2-fold enrichment of the pSTR call set compared against the pSTRs permutated. c Log2-fold enrichment of the mSTR call set compared against the mSTRs permutated. For both Fig. b and c, a permutation test was repeated 1000 times, and empirical P values were computed together with the enrichment values by GAT v1.3.4 and adjusted using Benjamini–Hochberg method. ns, not significant (adjusted P value >0.05). d, e Heterozygosity (d) and entropy (e) of pSTR loci (n = 366,013) in different genomic regions. f LOEUF scores of protein-coding genes enclosing pSTRs in the CDS (n = 282) and introns (n = 11,349). For Figure df, horizontal lines indicate the median, boxes span from the lower quartile (the 25th percentiles) to the upper quartile (the 75th percentiles), and whiskers extend to points that are within 1.5 × IQR (interquartile range) from the upper or the lower quartiles; the two-sided Wilcoxon rank-sum test was used to compute P values. ns, P value ≥ 0.05; **P value < 0.01; ***P value < 0.001; ****P value < 0.0001.
Fig. 4
Fig. 4. eSTRs and 3′aSTRs identified in this study.
a Quantile‒quantile plot comparing observed P values for STR-gene association tests (two-sided t-test in linear model) versus the expected uniform distribution in eSTR analysis. The red dots represent the observed association tests, and the gray dots indicate P values for permutation control. The black line gives the expected P value distribution under the null hypothesis of no association. b Correlations of the effect size of eSTRs identified in this study and a previous study by Gymrek et al. The blue points indicate eSTRs whose directions of effect were concordant in two studies, and gray points denote eSTRs with discordant directions of effect for that eSTR. The eSTRs detected in both studies are colored red, regardless of the concordance of effect. c Quantile‒quantile plot comparing observed P values for STR-gene association tests (two-sided t-test in linear model) versus the expected uniform distribution in 3′aSTR analysis. d, e Fold enrichment of eSTRs (left; n = 3273) or 3′aSTRs (right; n = 1117) in designated genome regions (d) and chromatin states defined by ChromHMM (e) in the GM12878 cell line. A permutation test was repeated 1000 times, and empirical P values were computed together with the enrichment values by GAT v1.3.4. Points denote the enrichment values. Red and blue points denote significant enrichments or depletions (P < 0.05 after Benjamini & Hochberg correction), and bars show 95% confidence intervals.
Fig. 5
Fig. 5. pSTR counts per sample and population sharing across different populations.
a, b Number of pSTRs per individual stratified by motif length (a) or state (heterozygous or homozygous) (b) of pSTR loci. c Distributions of the heterozygote/homozygote ratio per individual (n = 3522) in populations of the 1KGP and NyuWa datasets. Horizontal lines indicate the median and boxes span from the lower quartile (the 25th percentiles) to the upper quartile (the 75th percentiles). Whiskers extend to points that are within 1.5 × IQR (interquartile range) from the upper or the lower quartiles. d Number of unique pSTRs (upper) and sharing of pSTRs (lower) across different populations of the 1KGP and NyuWa datasets. Unique, only exist in the corresponding population; Shared, exist in more than one but not all populations; All, exist in all populations. Abbreviations of populations are from 1KGP (Supplementary Data 1). CHN.NyuWa denotes Northern Han Chinese from the NyuWa dataset, and it is equivalent to Han Chinese in Beijing from the 1KGP dataset (CHB.1KGP). CHS.NyuWa denotes Southern Han Chinese from the NyuWa dataset, and it is equivalent to CHS.1KGP (Southern Han Chinese).
Fig. 6
Fig. 6. Comparing STR lengths across the five superpopulations in the 1KGP dataset.
Pairwise comparisons of average pSTR lengths between superpopulations from the 1KGP are shown using volcano plots. pSTRs with top length differences were labeled using the genes in which they reside. The sample size of each superpopulation is 347–661. AFR African superpopulation, AMR American superpopulation, EAS East Asian superpopulation, EUR European superpopulation, SAS South Asian superpopulation. P-values were derived from two-sided Wilcoxon rank-sum test and adjusted using the Benjamini & Hochberg correction.
Fig. 7
Fig. 7. Highly variable pSTRs within superpopulations.
a UpSet plot of highly variable pSTRs identified from the NyuWa dataset and the five superpopulations in the 1KGP. b Gene Ontology (GO) enrichment analysis for genes enclosing 1110 highly variable pSTRs detected in all superpopulations. The top ten most significant items are shown. c Bar plot showing the adjusted p value of tissue-specific gene enrichment. P-values were derived from hypergeometric test and corrected using the Benjamini & Hochberg correction by TissueEnrich v1.16.0. d Distribution of allele length for three examples of common highly variable pSTRs stratified by population. The gray vertical line indicates the reference allele length for the corresponding locus.

Similar articles

Cited by

References

    1. Lander ES, et al. Initial sequencing and analysis of the human genome. Nature. 2001;409:860–921. doi: 10.1038/35057062. - DOI - PubMed
    1. Subramanian S, Mishra RK, Singh L. Genome-wide analysis of microsatellite repeats in humans: their abundance and density in specific genomic regions. Genome Biol. 2003;4:R13. doi: 10.1186/gb-2003-4-2-r13. - DOI - PMC - PubMed
    1. Hannan AJ. Tandem repeats mediating genetic plasticity in health and disease. Nat. Rev. Genet. 2018;19:286–298. doi: 10.1038/nrg.2017.115. - DOI - PubMed
    1. Fan H, Chu J-Y. A brief review of short tandem repeat mutation. Genom. Proteom. Bioinform. 2007;5:7–14. doi: 10.1016/S1672-0229(07)60009-6. - DOI - PMC - PubMed
    1. Press MO, Hall AN, Morton EA, Queitsch C. Substitutions are boring: some arguments about parallel mutations and high mutation rates. Trends Genet. 2019;35:253–264. doi: 10.1016/j.tig.2019.01.002. - DOI - PMC - PubMed

Publication types