. 2023 Apr 12;13(1):5945.
doi: 10.1038/s41598-023-32594-5.

Mutant and curli-producing E. coli enhance the disease phenotype in a hSOD1-G93A mouse model of ALS

Affiliations

Mutant and curli-producing E. coli enhance the disease phenotype in a hSOD1-G93A mouse model of ALS

Zimple Kurlawala et al. Sci Rep. .

Abstract

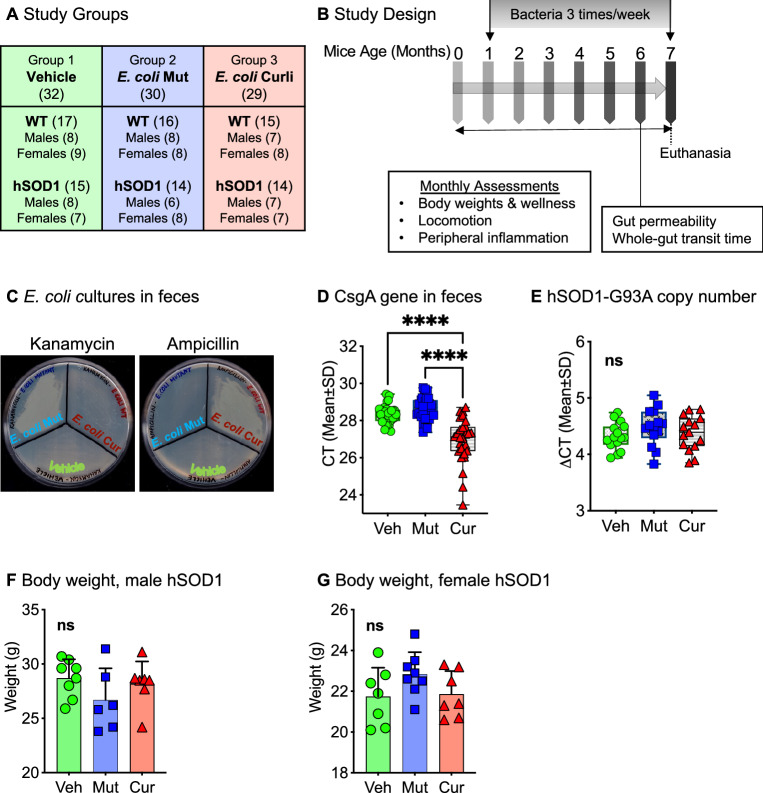
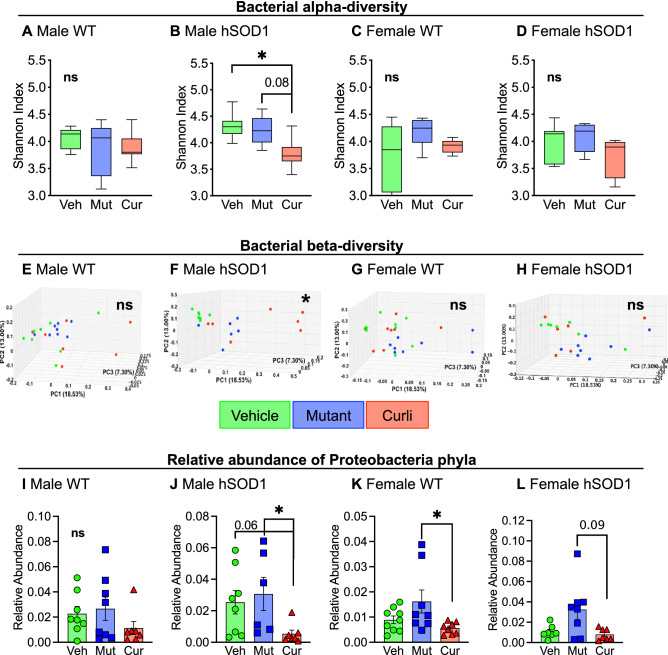
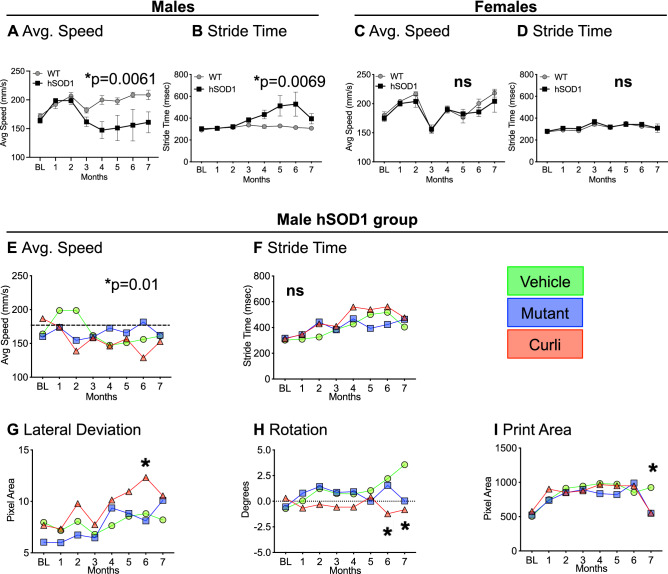
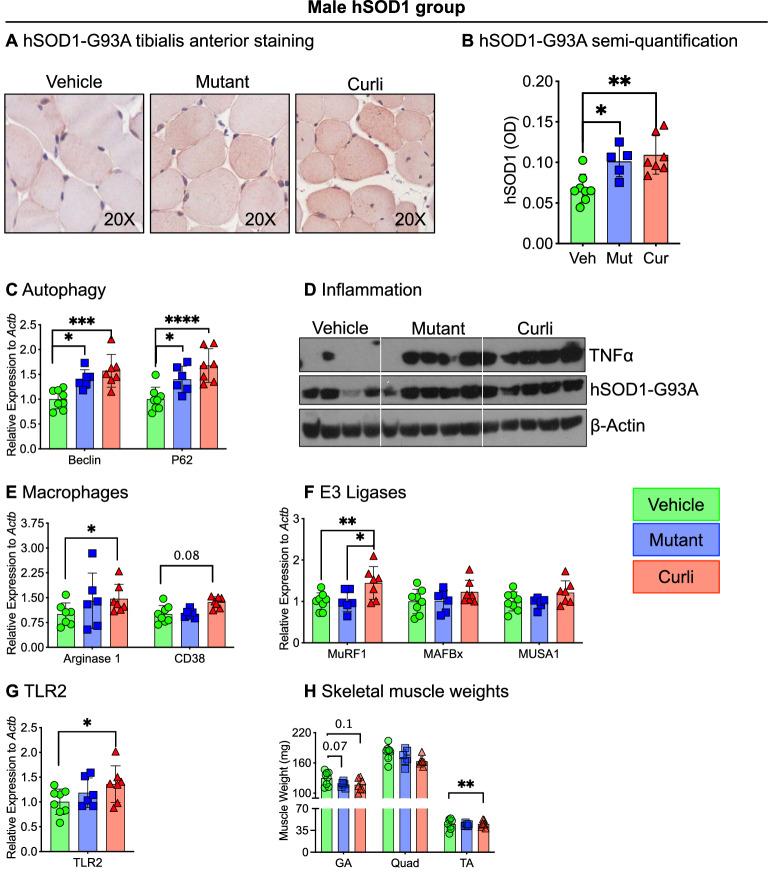
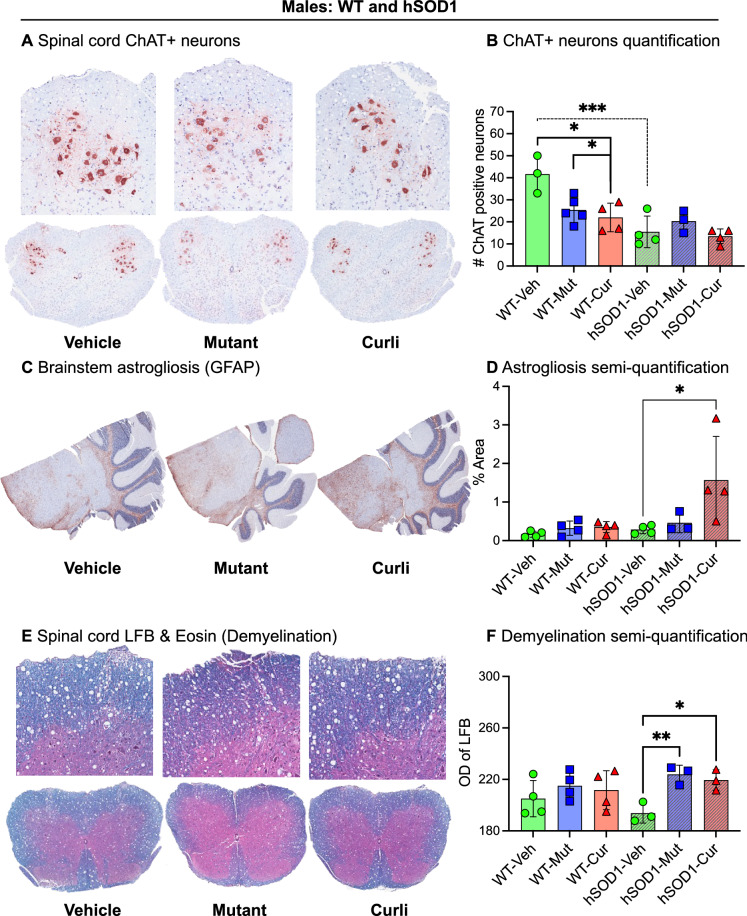
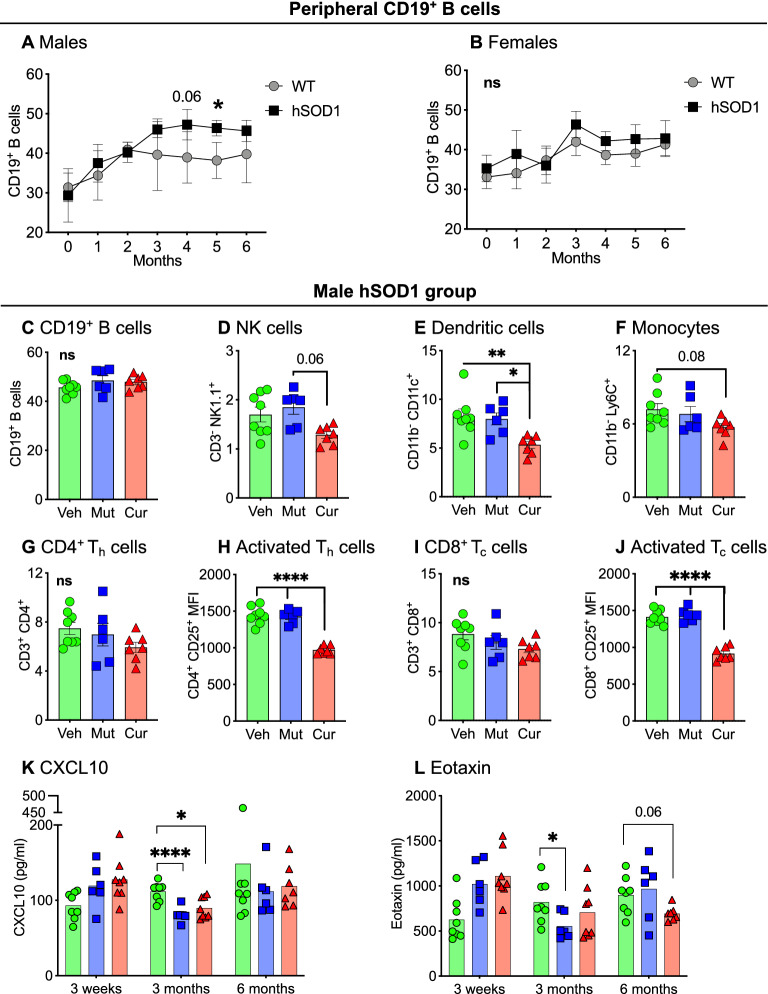
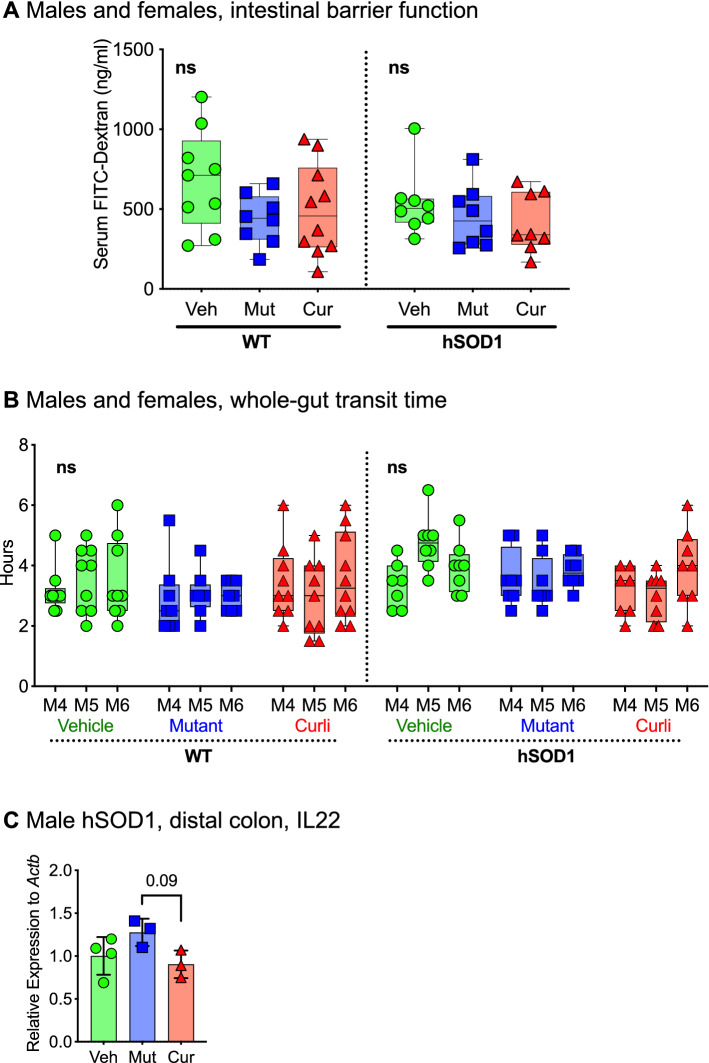
The gut microbiome is a potential non-genetic contributing factor for Amyotrophic Lateral Sclerosis. Differences in gut microbial communities have been detected between ALS subjects and healthy controls, including an increase in Escherichia coli in ALS subjects. E. coli and other gram-negative bacteria produce curli proteins, which are functional bacterial amyloids. We examined whether long-term curli overexposure in the gut can exacerbate the development and progression of ALS. We utilized the slow-developing hSOD1-G93A mouse model of ALS with their C57BL/6J WT littermate controls, including males and females, with a total of 91 animals. These mice were on a normal chow diet and fed curli-producing or curli-nonproducing (mutant) E. coli in applesauce (vehicle) 3 times/week, from 1 through 7 months of age. Male hSOD1 mice demonstrated gradual slowing in running speed month 4 onwards, while females exhibited no signs of locomotive impairment even at 7 months of age. Around the same time, male hSOD1 mice showed a gradual increase in frequency of peripheral CD19+ B cells. Among the male hSOD1 group, chronic gut exposure to curli-producing E. coli led to significant shifts in α- and β-diversities. Curli-exposed males showed suppression of immune responses in circulation, but an increase in markers of inflammation, autophagy and protein turnover in skeletal muscle. Some of these markers were also changed in mutant E. coli-exposed mice, including astrogliosis in the brainstem and demyelination in the lumbar spinal cord. Overall, chronic overexposure to a commensal bacteria like E. coli led to distant organ pathology in our model, without the presence of a leaky gut at 6 months. Mechanisms underlying gut-distant organ communication are of tremendous interest to all disciplines.


Conflict of interest statement

Robert P. Friedland is a stockholder in Axial Therapeutics. ZK, JDM, RAS, JM, SMS, ED, DAB, LJB, and LJS have no competing interests to declare.

Figures

Figure 1
Figure 1
Study design. (A) There were a total of 91 animals in 3 main experimental groups—Group 1: Vehicle (applesauce only), Group 2: E. coli mutant in applesauce (lacking CsgA gene), Group 3: E. coli curli in applesauce (CsgA/curli producing). (B) Mice were assessed at baseline (3 weeks of age) and monthly for several functional measures as indicated. Feeding of bacteria or vehicle was started at 1 month of age, three times/week, for 6 months. (C) Confirmation of feeding—bacteria from fecal pellets were cultured in kanamycin and ampicillin agar plates, demonstrating resistance of E. coli-mutant to kanamycin and E. coli-curli to ampicillin antibiotics, respectively. (D) Confirmation of feeding—presence of CsgA gene were evaluated in DNA isolated from feces. qPCR was run from equal starting amount of DNA from all 3 feeding groups, which detected overexpression of CsgA in the curli-fed group, as well as endogenous expression in the vehicle and mutant groups (E) Copy numbers of hSOD1-G93A transgene in mice in all 3 feeding groups were not significantly different (F and G) There were no significant differences in body weights of mice at 7 months of age between bacterial fed groups. ns = not significant, ****p < 0.001, one-way ANOVA, n = 6–8 per group.
Figure 2
Figure 2
Whole-genome shallow shotgun sequencing analyses of fecal pellets at 6 months. (AD) Within-group bacterial species diversity measured with Shannon alpha-diversity index demonstrated poorer species richness and abundance in curli-fed animals in the male hSOD1 cohort, *p < 0.05, Wilcoxon Rank Sum test. (EH) Between-group bacterial beta-diversity measured with JACCARD index demonstrated distinct clustering of curli-fed animals in the male hSOD1 group. **p = 0.001, PERMANOVA test. (IL) Relative abundance of Proteobacteria phyla were significantly reduced in curli-fed male hSOD1 and female WT groups, *p < 0.05, Kruskal–Wallis test. n = 6–8 per group.
Figure 3
Figure 3
Gait kinematics and locomotion characteristics. (AD) Average running speed and stride time measured with TreadScan analyses showed significant slowing of pace in hSOD1 males compared to WT controls (A). This finding was absent in females (C). Stride time, defined as the time elapsed between two successive initiations of stances, showed significant increases in hSOD1 males compared to WT controls (B). This finding was absent in females (D). Data represented as mean + /-SEM for (AD). (E) Within the male hSOD1 cohort, the ANOVA was significant for effect of time on running speed, but bacterial feeding did not have a significant effect. (F) Bacterial feeding also did not significantly effect stride time. Within the male hSOD1 group, curli-fed mice showed significant differences for maximum lateral deviation of hind feet from the axis of the body (G), inability to efficiently move body from a straight axis (H), and a smaller print area of the hind feet (I) towards later months. *p < 0.05, Repeated measures two-way ANOVA or mixed-effects model analyses (REML) with Tukey’s multiple comparisons. n = 6–8 per group.
Figure 4
Figure 4
Markers of skeletal muscle atrophy by histochemical staining (tibialis anterior), Western blot analysis (gastrocnemius) and qRT-PCR (gastrocnemius) in the male hSOD1 group. (A,B) Mutant and curli-fed groups showed significantly increased immunostaining for hSOD1 in tibialis anterior muscles. Images were quantified in ImageJ utilizing optical density for positive staining. (C) qRT-PCR analysis demonstrated significantly increased expression of autophagy markers, Beclin and p62 mRNA in mutant and curli-fed mice compared to vehicle. (D) Western blot analysis showed increased expression of pro-inflammatory TNFα protein in mutant and curli-fed groups compared to vehicle. (E) Inflammatory macrophage populations M1 (CD38) and M2 (Arginase 1), were both significantly elevated in gastrocnemius of curli-fed mice compared to vehicle. (F) mRNA expression of an E3 ligase MurF1 was increased 1.5-fold in curli-fed male hSOD1 mice compared to mutant and vehicle groups. (G) mRNA expression of TLR2, a pathogen recognition receptor was significantly increased 1.4-fold in curli-fed group compared to vehicle. (H) Skeletal muscle weights of gastrocnemius (GA), quadriceps (Quad) and tibialis anterior (TA) were measured post-mortem and curli-fed mice had significantly lower weights of the tibialis anterior muscles compared to vehicle and mutant-fed groups. *p < 0.05, **p < 0.01, ***p < 0.001, one or two-way ANOVA. n = 6–8 per group.
Figure 5
Figure 5
Neurodegeneration, inflammation, and demyelination in the nervous system. (A,B) Within the male WT group, mutant and curli-fed mice showed significantly decreased cholinergic (ChAT+) neurons compared to vehicle. Within the vehicle group, hSOD1 males had fewer ChAT+ neurons compared to WT controls. (C,D) Within the male hSOD1 cohort, curli-fed mice showed increased astrogliosis in brainstem compared to vehicle. Images were quantified in ImageJ utilizing percent positive signal of staining. (E,F) Within the male hSOD1 cohort, mutant and curli-fed mice showed significant demyelination in white matter of spinal cords compared to vehicle groups (encroachment of pink cytoplasmic stain eosin into areas of Luxol Fast Blue stained myelin). *p < 0.05, **p < 0.01, ***p < 0.001, one-way ANOVA. n = 3–5 per group.
Figure 6
Figure 6
Peripheral blood immune responses. (A) Immunophenotyping of peripheral blood demonstrated significantly increased CD19+ B cells in hSOD1 males compared to WT controls, month 4 onwards, This phenomenon was not observed in female mice (B), mixed-effects model analyses (REML). (CJ) Within the male hSOD1 cohort, curli-fed mice exhibited significantly decreased markers of NK cells, dendritic cells, monocytes, activated Th cells and activated TC cells. (K, L) Pro-inflammatory cytokines CXCL10 (3 months) and eotaxin (6 months, trending) were decreased in both bacterial-fed male hSOD1 mice compared to vehicle groups. ns = not significant, *p < 0.05, **p < 0.01, ****p < 0.001, one- or two-way ANOVA, n = 6–8 per group.
Figure 7
Figure 7
Functional characteristics of the gastrointestinal system (A) Gut barrier integrity was assessed by oral administration of FITC-Dextran and measuring its absorption in circulating blood 4 h later. No differences in serum FITC signal was detected between any groups. n = 8–10 per feeding group, males and females, randomly selected for the assay, one-way ANOVA. (B) There were no significant differences in whole-gut transit time at months 4, 5, and 6 between genotypes, sex or bacterial feeding groups measured as time taken (hours) to excrete carmine red dye administered orally. n = 8–10 per feeding group, males and females, randomly selected for the assay, one-way ANOVA. (C) Within the male hSOD1 cohort, mRNA expression of IL22 was decreased (trending) in curli-fed male hSOD1 mice compared to the mutant group, Kruskal–Wallis test, n = 3–4 per group.

Similar articles

Cited by

References

    1. Trojsi F, Monsurro MR, Tedeschi G. Exposure to environmental toxicants and pathogenesis of amyotrophic lateral sclerosis: State of the art and research perspectives. Int. J. Mol. Sci. 2013;14:15286–15311. doi: 10.3390/ijms140815286. - DOI - PMC - PubMed
    1. Kim S, Kwon SH, Kam TI, Panicker N, Karuppagounder SS, Lee S, Lee JH, Kim WR, Kook M, Foss CA, Shen C, Lee H, Kulkarni S, Pasricha PJ, Lee G, Pomper MG, Dawson VL, Dawson TM, Ko HS. Transneuronal propagation of pathologic alpha-synuclein from the gut to the brain models Parkinson’s disease. Neuron. 2019;103(627–641):e627. doi: 10.1016/j.neuron.2019.05.035. - DOI - PMC - PubMed
    1. Miraglia F, Colla E. Microbiome, Parkinson’s disease and molecular mimicry. Cells. 2019;8:222. doi: 10.3390/cells8030222. - DOI - PMC - PubMed
    1. Santos SF, de Oliveira HL, Yamada ES, Neves BC, Pereira A., Jr The gut and Parkinson’s disease-a bidirectional pathway. Front. Neurol. 2019;10:574. doi: 10.3389/fneur.2019.00574. - DOI - PMC - PubMed
    1. Borghammer P, Van Den Berge N. Brain-first versus gut-first Parkinson’s disease: A hypothesis. J. Parkinsons Dis. 2019;9:S281–S295. doi: 10.3233/JPD-191721. - DOI - PMC - PubMed

Publication types

Substances