Comparative Study
. 2023 Apr;616(7956):378-383.
doi: 10.1038/s41586-023-05808-z. Epub 2023 Apr 12.

Sensory specializations drive octopus and squid behaviour

Affiliations
Comparative Study

Sensory specializations drive octopus and squid behaviour

Guipeun Kang et al. Nature. 2023 Apr.

Abstract

The evolution of new traits enables expansion into new ecological and behavioural niches. Nonetheless, demonstrated connections between divergence in protein structure, function and lineage-specific behaviours remain rare. Here we show that both octopus and squid use cephalopod-specific chemotactile receptors (CRs) to sense their respective marine environments, but structural adaptations in these receptors support the sensation of specific molecules suited to distinct physiological roles. We find that squid express ancient CRs that more closely resemble related nicotinic acetylcholine receptors, whereas octopuses exhibit a more recent expansion in CRs consistent with their elaborated 'taste by touch' sensory system. Using a combination of genetic profiling, physiology and behavioural analyses, we identify the founding member of squid CRs that detects soluble bitter molecules that are relevant in ambush predation. We present the cryo-electron microscopy structure of a squid CR and compare this with octopus CRs1 and nicotinic receptors2. These analyses demonstrate an evolutionary transition from an ancestral aromatic 'cage' that coordinates soluble neurotransmitters or tastants to a more recent octopus CR hydrophobic binding pocket that traps insoluble molecules to mediate contact-dependent chemosensation. Thus, our study provides a foundation for understanding how adaptation of protein structure drives the diversification of organismal traits and behaviour.


Conflict of interest statement

Competing interests The authors declare no competing interests.

Figures

Extended Data Fig. 1|
Extended Data Fig. 1|. Comparative chemotactile behaviour.
a, Squid have two long tentacles for catching prey, in addition to eight arms like octopus. b, Octopuses explore their home tank, moving throughout recordings while squid are stationary and often buried, n=8–9 trials. c, Octopuses move toward their prey for capture while squid wait for prey to approach and then strike, n=4 trials, p<0.0001 for octopus versus squid movement, two-tailed Student’s t-test. d, Octopuses spread their arms in relatively dark conditions and contract in the light, n=10 trials, p<0.0001 for octopus versus squid movement, two-tailed Student’s t-test. e, Octopuses pounce on and consume live crabs from a distance in the light and must first touch freshly dead crabs before consuming. In the dark, octopuses must first touch live or dead crabs before pouncing and consuming. These results suggest octopuses use somatosensation for predation in the absence of strong visual cues, n=9–13 trials. f, Squid use ambush predation to hide and strike shrimp in light or relatively dark conditions with a similar success rate but require that prey are at a much closer distance in the dark. These results suggest squid primarily use vision to strike prey. p<0.0001 for strike distance in light versus dark, two-tailed Student’s t-test. n=18–24 trials. Data represented as mean ± SEM.
Extended Data Fig. 2|
Extended Data Fig. 2|. Comparative chemosensory cell electrical properties.
a, Quantification of chemosensory cells from octopus or squid that responded to 3 kDa fish and shrimp extract in voltage- or current-clamp. b, Shrimp-sensitive octopus chemoreceptor cell currents were blocked by 1 mM mecamylamine. p < 0.05, two-tailed Student’s t-test. n=7 cells. Scale bar: 5 μm. c, Representative fish-evoked action potentials in an octopus chemosensory cell. d, 1 μM tetrodotoxin (TTX) blocked voltage-gated inward currents (INav) in octopus chemosensory cells, n=6–11 cells, p<0.0001, two-way ANOVA with post hoc Bonferroni test. e, Octopus chemosensory cell INav voltage dependence: Va1/2=5.1±0.7mV. Vi1/2=38.0±1.8mV, n=4. f, Octopus chemosensory cell INav, activation and inactivation kinetics, n=6. g, 1 μM tetrodotoxin (TTX) blocked voltage-gated inward currents (INav) in squid chemosensory cells. n=6–11 cells, p<0.0001, two-way ANOVA with post hoc Bonferroni test. h, Squid chemosensory cell INav voltage dependence: Va1/2=6.5±0.8mV, Vi1/2=40.3±1.3mV, n=4 cells. i, Squid chemosensory cell lN3V activation and inactivation kinetics, n=6 cells. j, Voltage gated outward currents measured in the presence of intracellular potassium (1KV) in squid and octopus chemosensory cells, n=5 cells for squid and 6 for octopus. k, Both squid and octopus chemosensory cells produced action potentials in response to current injection. Squid had slightly higher frequency in response to the same injection step. n=5 cells for squid and 7 for octopus. l, comparison of spike amplitude and input resistance in squid and octopus chemosensory cells, n=5 cells for squid and 7 for octopus. Data represented as mean ± SEM.
Extended Data Fig. 3|
Extended Data Fig. 3|. Squid CR properties.
a, Alignment of predicted loops A, B and C from analysed octopus and cuttlefish CRs and the human α7 nicotinic acetylcholine receptor demonstrated that CRs lack most residues that contribute to the canonical acetylcholine (ACh) binding side (highlighted in red). b, Squid CRs localized to the sensory epithelium of arm suckers (left, merge in Fig. 1) and tentacle suckers (right), as visualized by RNAscope in situ hybridization. Nuclei were stained with DAPI (blue). Representative of 3 animals. c, Expressed octopus (CRS18, CRT1) and cuttlefish CRs (CR192, CRB1) were insensitive to acetylcholine (ACh, 1 mM) but robustly responded to fish or shrimp extract. Extract responses were blocked by mecamylamine (1 mM) and were not observed in untransfected cells. n=6–7 cells, p<0.0001 for extract responses versus mecamylamine, two-way ANOVA with post-hoc Tukey test. d, Octopus CRT1 exhibited dose-dependent sensitivity to the terpene costunolide, while squid CRB1 was insensitive. Octopus CRT1ECSO = 30.8 μM, 95% Cl = 30.0–33.9 μM, n=7 cells for octopus and 5 for squid. Data represented as mean ± SEM. e, Minimal desensitization was measured in response to low concentration of denatonium while higher concentrations produced inhibition with large wash-off currents that were absent at positive voltage. These properties are consistent with moderate pore block, p<0.0001 for concentration, two-tailed student’s t-test (n=6). Data represented as mean ± SEM.
Extended Data Fig. 4|
Extended Data Fig. 4|. Comparative squid and octopus nerve and arm chemosensory responses.
a, (Top) arm and tentacle axial nerves stained with anti-horseradish peroxidase antibody (purple) and nuclearstain (DAPI, blue). Representative of at least 3 animals. Scale bars: 1 mm. (Bottom) Corresponding nerve recordings in response to the indicated stimuli: control (sea water), 3 kDa fish extract, 1 mM nootkatone, 1 mM denatonium. b, Amputated arm behaviour in response to control (sea water), 3 kDa fish extract, 1 mM denatonium, or 1 mM nootkatone. c, Heat map of normalized axial nerve and arm responses. Octopus and squid were sensitive to terpenes but only squid arms and tentacles responded to denatonium. p<0.05 for denatonium sensitivity in squid. n=3 arms. d, Representative axial nerve recordings from longfin (D. pealii) and bobtail squid (E. berryi) arms in response to control (sea water), 3 kDa fish extract, 1 mM denatonium. e, Heat map of normalized axial nerve responses in longfin and bobtail squid. f, Normalized surface area of octopus arms touching agar coated floors was reduced on the side containing polygodial (100 μM, n=7). Octopuses touched both control sides the same, p < 0.01, paired Student’s t test, n=8 trials per condition. g, Squid touched agar-coated floors with the same frequency and surface area when both sides were coated with sea water-filled agar or one side contained denatonium (also see Figure 2). n=7 trials.
Extended Data Fig. 5|
Extended Data Fig. 5|. EM data processing.
a-d, 2D slices through TMDs from reconstructions of CRB1 in different membrane mimetics. e, Representative cryo-electron micrograph of CRB1 in GDN detergent micelles from a dataset of16,042 dose-fractionated micrographs. Scale bar = 100 nm. f, Projection images from the selected 2D classes. g, 3D classification results; good 3D classes selected for separate processing are boxed in red and yellow. h-i, 3D classification results; 3D classes selected are boxed in red, and particles from selected 3D classes were aligned and combined for 3D refinement. j, 3D classification results using local angular searches; best 3D class with strong TMD density boxed in red was selected for additional 3D classification. k, TMD-focused 3D classification results; particles from best 3D class (boxed in red) were used in final refinement. I, 3D reconstructed map from the final 3D classification, which is shown in both side and top views. Density of M1-M4 for each subunit is outlined with a black dashed line. m, Sharpened map coloured by local resolution. n, Half-map FSC plot for masked and unmasked maps with global resolution indicated at FSC = 0.143.
Extended Data Fig. 6|
Extended Data Fig. 6|. Representative density map segmentation.
a, Cryo-EM density map of CRB1 for representative adjacent subunits coloured in gold and yellow. Density map of denatonium coloured in cyan and waters in red at a threshold level of 0.03. b, Orthosteric binding site of CRB1 boxed in a, where residues within 5 Å of denatonium and negatively charged residues near waters are shown as sticks. c, Calculated interface areas and interaction energies (ΔiG) for protein and denatonium using PDBePISA. Calculated solvent accessible area and volume of the binding pocket for CRB1 using CASTp3.0. d-i, Cryo-EM density segments of Loops A-F at the orthosteric binding site at a threshold level of 0.03. j-o, Cryo-EM density segments ofCys-loop, β8-β9-loop, β1-β2-loop, β4-β5-loop, M1M2 loop, and M2M3 loop at a threshold level of 0.03. p-t, Cryo-EM density segments of M1-M3 and two M4 helices (chains C and E) at a threshold level of 0.03.
Extended Data Fig. 7|
Extended Data Fig. 7|. Squid CR ion permeation pathway.
a, Pore radii as a function of distance along the pore axis; CRB1 is coloured in yellow and CRT1 in blue. Structures were aligned using the M2 helix GIu-1′ at the bottom of M2, which is defined as y = 0. b, CRB1 ion permeation pathway coloured by hydrophobicity with D102 and F46 indicated as spheres, the two most constricted points in the ECD; front subunit removed for clarity. c, Top view of CRB1 shows negatively charged D102 points toward the channel axis. d, Representative current-voltage (I-V) relationships of WT and D102A mutant CRB1 channels in response to denatonium during equimolar cation substitution. e, D102A did not change permeation but did affect current amplitude measured at +60 mV in the presence of all permeant cations. Outward currents in external NMDG+ were the same in WT versus D102A. n=7–10 cells, p<0.0001 two-way ANOVA with post-hoc Bonferroni test. Data represented as mean ± SEM. f, Structure-based sequence alignment of β4-β5 loop (Ω loop) for CRB1, CRT1, and 5-HT3A (PDB: 6NP0). g, Comparison of Ω loop conformation of CRB1 coloured in pink and 5-HT3A (Ω-open) coloured in grey; D102 of CRB1 is shown as sticks. h, Comparison of Ω loop conformation of CRT1 coloured in pink and 5-HT3A (Ω-open) coloured in grey; E104 of CRT1 is shown as sticks. i, Structure-based sequence alignment of Ω loop for α7 (PDB: 7KOX), α3 (PDB: 6PV7), α4 nicotinic receptor (PDB: 5KXI). j, Comparison of Ω loop conformation of α7 nicotinic receptor coloured in light blue and 5-HT3A (Ω-open) coloured in grey; E97 of α7 is shown as sticks. k, Comparison of Ω loop conformation of α7 nicotinic receptor coloured in light blue and α4 nicotinic receptor (Ω-in) coloured in light green. m,n, Comparison of pore shapes analysed by HOLE2. o, p, Comparison of relative symmetry in the TMD (o) and ECD (p) for CRT1 and CRB1. q,r, α7 receptor electrostatics analysed by APBS, where r is a cutaway to show electrostatics of the permeation pathway, calculated with 140 mM NaCl. s-v, Electrostatics for CRB1 and CRT1, calculated with 0.5 M NaCl.
Extended Data Fig. 8|
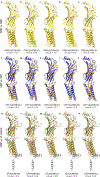
Extended Data Fig. 8|. Superposition of subunits from CRs and α7 nicotinic receptor.
a-e, Superposition of subunits within CRB1, aligned by ECD region using UCSF Chimera. The r.m.s.d values in Å are for Cα atoms over the whole chain, calculated by secondary structure-based alignment using Coot. Chain IDs are indicated in parentheses. f-j, Subunits of CRB1 are compared to a subunit of CRT1. k-o, Subunits of CRB1 are compared to a subunit of α7 nicotinic receptor (activated state, PDB:7KOX).
Extended Data Fig. 9|
Extended Data Fig. 9|. Squid CR hydrophobic cluster and hydrogen bond network.
a, Single subunit structure of squid CR predicted by Alpha Fold and coloured by confidence. b, Experimental cryo-EM structure of single subunit with two disulfide bonds shown as spheres. c, Details of CRBl boxed in b, and a 180° rotated view. Hydrophobic residues contacting the two disulfide bonds are shown as sticks. d, Structure-based sequence alignment of β8-β9 loop and Loop C of CRB1, CRT1, and human α7 nicotinic acetylcholine receptor. A novel disulfide bond in CRB1 is highlighted in a yellow box, and the corresponding residue on the β8-β9 loop in CRTl and α7 is indicated in a magenta-coloured box. e, Hydrogen bond network between β9, β10, β7 and β6 in CRB1 shown as black dashed line. f, Hydrogen bond network between β9, β10, and β7 in CRT1 at the same view as e. The β9 strand shifts upward as indicated by the magenta arrow due to insertion of the Y166 sidechain between β9 and β10, which breaks the hydrogen bond network in this region. g, Hydrogen bond network between β9, β10, and β7 in α7 in the same orientation as e. h-m, In the TMD, density for the most peripheral M4 helix was notably absent in CRT1, in all tested detergents, but it was predicted to be present by AlphaFold. h,j, and 1 show predicted structures of TMD bundles for CRB1, α7, and CRT1. i, k, and m show interactions as lines from PDBe PISA server analysis; solid lines indicate interactions found in both the experimental structures and in the AlphaFold model; dashed lines indicate those found in only the experimental structures. In panel m, solid lines indicate interactions found only in the AlphaFold model. Analysis of molecular interactions among M1/M3/M4 helices from the experimental and predicted models sheds light on the basis for the presence or absence of an ordered M4 helix. In CRB1 and α7, plentiful aromatic contacts among helices stabilize M4 packing in the TMD bundle, while the most recently diverged CRT1 lacks the abundance of hydrophobic contacts.
Extended Data Fig. 10|
Extended Data Fig. 10|. Comparative squid and octopus CR phylogeny.
a, Phylogenetic tree of acetylcholine-receptor-like protein sequences from Octopus bimaculoides (Obim), Octopus sinensis (Osin), Sepioloidea lineolata (Siin), Doryteuthis pealeii (Dpea), Euprymna berryi (Eber), Nautilus pompilius (Npom), and Lottia gigantea (Lgig) showing that CRs diverged from acetylcholine-like receptors, are unique to coleoid cephalopods, and comprise three major lineages: CRB (CR-Bitter), CRT (CR-Terpenes), and CRX (CR with unknown ligands). b. Density distributions of neutral genetic diversity (fourfold degenerate site distances, 4DTv) estimated for all pairs of genes between CRB and CRT clades. Dotted lines correspond to the mode of distributions for pairwise comparisons between CRTs and CRBs, suggesting CRTs have undergone a more recent diversification. c, Densitree of the distribution of bootstrap topologies for the CR clade showing that CRB is robustly supported as the earliest divergent lineage of CRs and sister to the CRT-CRX clade.
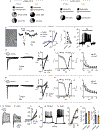
Fig. 1|
Fig. 1|. Squid express arm and tentacle CRs.
a, Image of O. bimaculoides (left). Middle, octopuses have large smooth suckers with numerous ciliated receptor cells. Scale bars, 500 μm and 200 nm. Right, octopuses use chemotactile taste-by-touch sensation for explorative predation. b, Image of S. lineolata (left). Middle, squid have rough spiked tentacle suckers with putative ciliated receptor cells. Scale bars, 500 μm and 200 nm. Right, squid use ambush predation to strike and trap unsuspecting prey. c, Filtered shrimp extract (3 kDa) elicited mecamylamine (Mec.)-sensitive (1 mM) responses from chemosensory cells isolated from squid sucker sensory epithelium, n=4 out of 8 responded. Statistical analysis was performed using a paired two-tailed Student’s t-test; P<0.05 (inhibition). Scale bar, 5 μm. d, Shrimp extract elicited action potentials in 3 out of 4 chemosensory cells. e, Octopus and squid CRmRNA transcripts were enriched in the sucker sensory epithelium relative to other sampled tissues. The colour scale shows transcripts per million normalized (norm.) to sensory epithelium. f, Squid CRs localized to the sensory epithelium, as visualized by RNAscope in situ hybridization. Representative of three animals. Nuclei were stained with DAPI (blue). Scale bar, 20 μm.
Fig. 2|
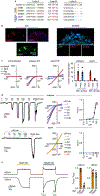
Fig. 2|. Squid use a bitter CR to taste by trap.
a, Patch-clamp screen in HEK293 cells expressing squid CRB1 revealed sensitivity to the bitter tastant denatonium (Den.), n=38 cells. 1mM of tested compound. b, Native chemoreceptor cells were activated by 10 μM denatonium. n=5 out of 11 cells. Atr., atractylon; Cos., costunolide; Ntk., nootkatone; Pol., polygodial. c, Squid CRB1 robustly responded to the bitter tastant denatonium but was insensitive to octopus CRT1 terpene agonists, n=6 cells. Statistical analysis was performed using two-way analysis of variance (ANOVA) with post hoc Bonferroni test; P<0.0001. d, Both octopus and squid arms responded to fish extract but only squid responded to 1 mM denatonium. n=3 arms. Statistical analysis was performed using a two-tailed Student’s t-test; P<0.05 (denatonium versus sea water). e, Denatonium (1 mM) elicited robust autonomous movement in amputated squid arms and tentacles, but not in octopus arms (see also Extended Data Fig. 4). n=3 arms. Statistical analysis was performed using a two tailed Student’s t-test; P<0.05 (denatonium versus control). Scale bar, 3 cm. f, Octopuses used taste by touch to differentially explore terpene agonist (polygodial)-infused (100 μM) surfaces, n=18 octopus and 8 squid trials. Statistical analysis was performed using a two-tailed Student’s t-test; P<0.001 (octopus touch number and duration in polygodial versus control). Scale bar, 3 cm. g, Squid did not explore infused surfaces in a denatonium dependent manner, but differentially handled denatonium-covered (1 mM) shrimp after capturing with ambush predation, n=9 trials. Statistical analysis was performed using a two-tailed Student’s t-test; P<0.05 (denatonium versus sea water). Scale bar, 3 cm. Data are mean ± s.e.m.
Fig. 3|
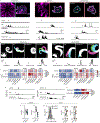
Fig. 3|. The structureof agonist-bound squid CRB1.
a, Cryo-EM map and atomic model of squid CRB1 with a single subunit highlighted from the homopentamer and denatonium indicated in cyan. N-glycans and denatonium are shown as sticks. b, Single-subunit structure of squid CRB1 oriented as in a and rotated 90° about the pore axis. Disulfide bonds are shown as spheres. c, Details of the CRB1 agonist-binding site showing residues that are involved in denatonium binding as sticks. d, CRB1 ligand sensitivity was reduced by mutating residues that coordinate denatonium. Denatonium sensitivity (half maximal effective concentration (EC50)=6.48μM, 95% confidence interval = 5.70–7.25 μM) was decreased by the E39A and W120A mutations, n=8 cells. Data are mean ± s.e.m.
Fig. 4|
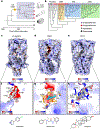
Fig. 4|. Structural specializations underlie an evolutionary transition from neurotransmission to distinct chemotactile sensory functions.
a, Time-calibrated phylogeny of Cephalopoda inferred from whole mitochondrion genomes, including L. gigantea as an outgroup. Blue shading highlights coleoid cephalopods (octopus, squid, cuttlefish) and the inferred origin of CR sensory receptors at the base of this clade. Node bars (blue) indicate 95% confidence intervals for divergence time estimates at nodes. b, A phylogenetic tree of nicotinic acetylcholine-receptor-like proteins from Octopodiformes (O. bimaculoides and O. sinensis); Decapodiformes (S. lineolate, D. pealeii, E. berryi); nautiloids (Nautilus pompilius); and gastropods (Lottia gigantea) shows that CRs diverged from acetylcholine-like receptors are unique to coleoid cephalopods, and comprise three major lineages: CRB (CR-bitter), CRT (CR-terpenes) and CRX (CR with unknown ligands). c-e, Side view of α7 (c), CRB1 (d) and CRT1 (e) coloured by Coulombic electrostatic potential; negatively and positively charged surfaces are coloured in red and blue, respectively. The black boxes indicate the orthosteric binding site. f, Details of the α7 nicotinic receptor neurotransmitter site with the agonist epibatidine bound. Aromatic residues near epibatidine (<5 Å) are shown as sticks. Interactions between epibatidine and carbonyl oxygen (Trp148) or hydroxyl oxygen (Tyr187) are shown as green lines. g, Details of CRB1 agonist-binding site with aromatic or charged residues near denatonium (<5 Å) shown as sticks. The green lines indicate electrostatic interaction between denatonium and Glu39. The black dotted lines in f and g indicate residues that form an aromatic cage in α7 and CRB1. h, Details of CRT1 agonist site with aromatic residues near diosgenin (<5 Å) shown as sticks.

References

    1. van Giesen L, Kilian PB Allard CAH & Bellono NW Molecular basis of chemotactile sensation in octopus. Cell 183, 594–604.e14 (2020). - PMC - PubMed
    1. Noviello CM et al. Structure and gating mechanism of the α7 nicotinic acetylcholine receptor. Cell 1184, 2121–2134(2021). - PMC - PubMed
    1. Albertin CB et al. The octopus genome and the evolution of cephalopod neural and morphological novelties. Nature 524, 220–224 (2015). - PMC - PubMed
    1. Mollo E, Garson MJ, Polese G. Amodeo P. & Ghiselin MT Taste and smell in aquatic and terrestrial environments. Nat. Prod. Rep 34, 496–513 (2017). - PubMed
    1. Mollo E. et al. Sensing marine biomolecules: smell taste, and the evolutionary transition from aquatic to terrestrial life. Front. Chem 2, 92 (2014). - PMC - PubMed

Publication types

MeSH terms

Substances