. 2023 Apr 12;13(1):5984.
doi: 10.1038/s41598-023-32757-4.

Identification and panoramic analysis of drug response-related genes in triple negative breast cancer using as an example NVP-BEZ235

Affiliations

Identification and panoramic analysis of drug response-related genes in triple negative breast cancer using as an example NVP-BEZ235

Jia Feng et al. Sci Rep. .

Abstract

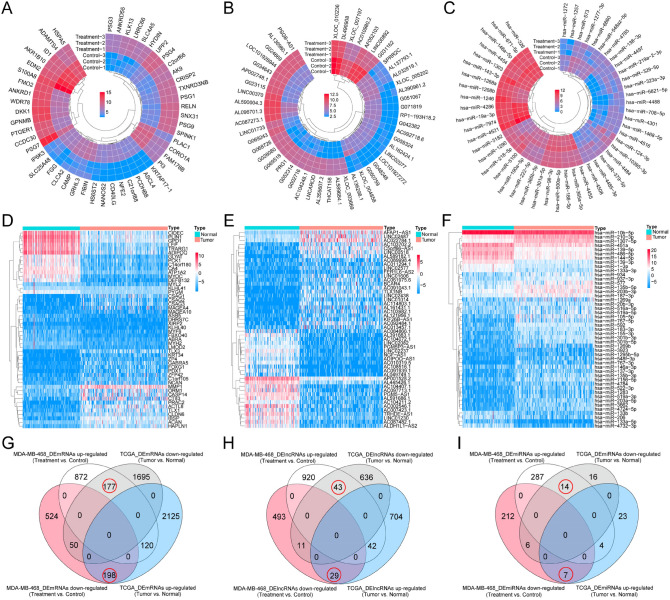
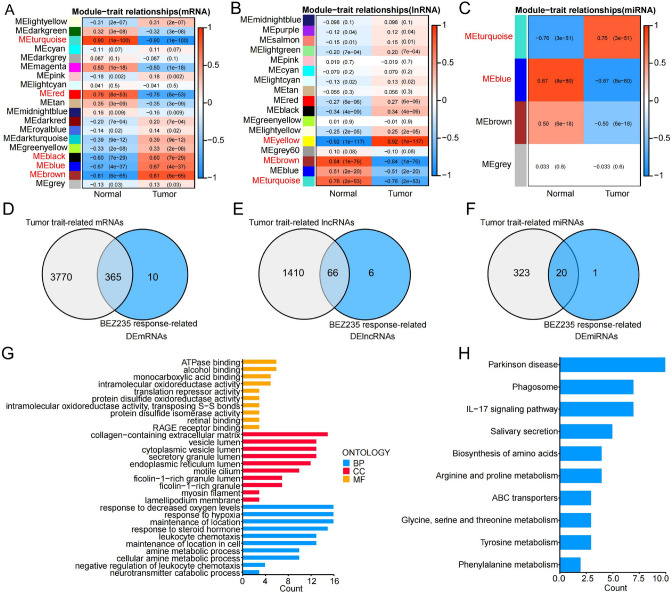
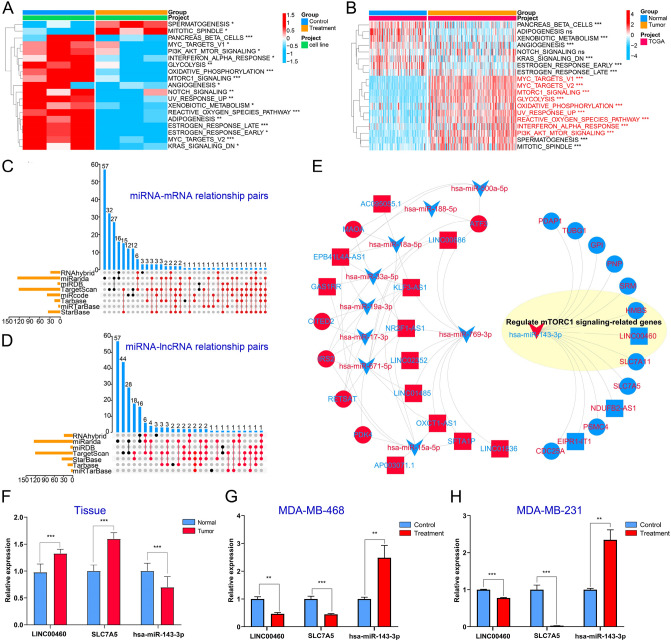
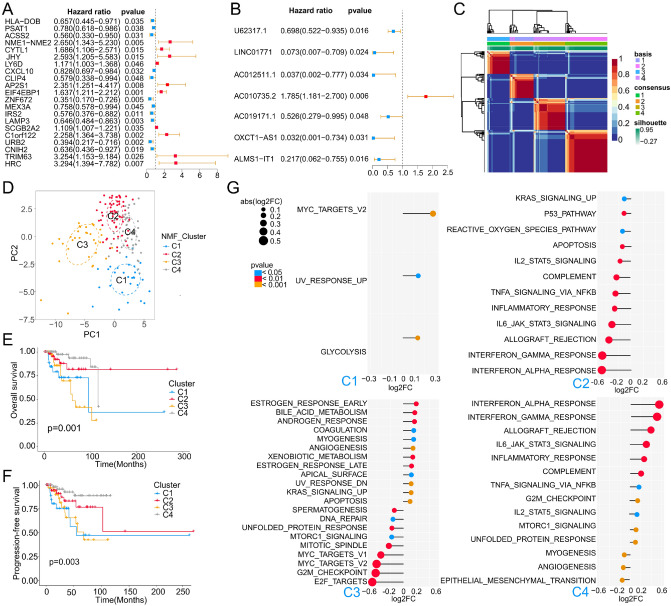
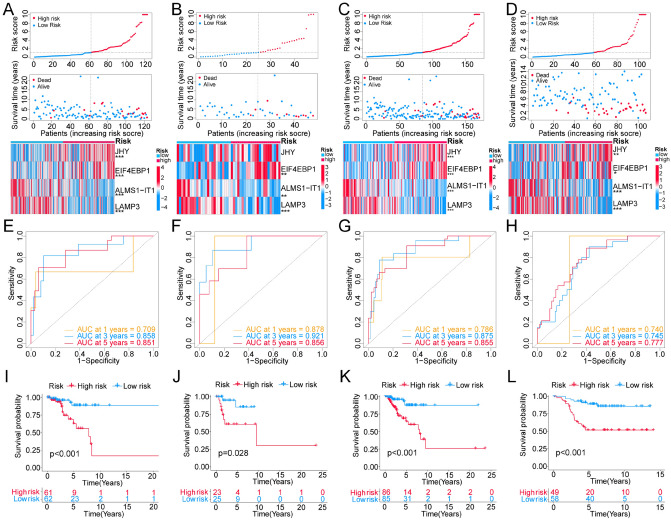
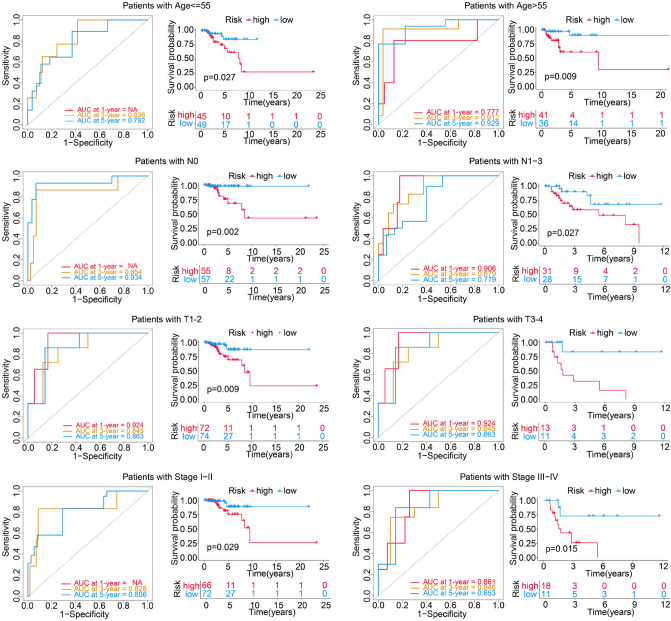
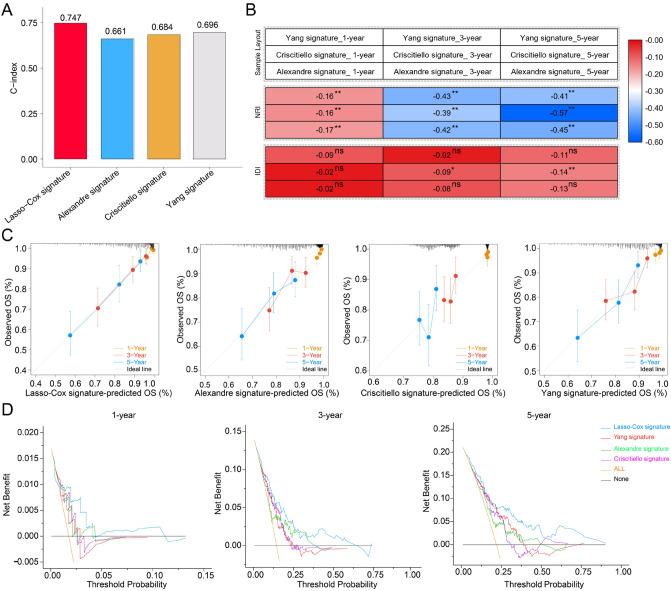
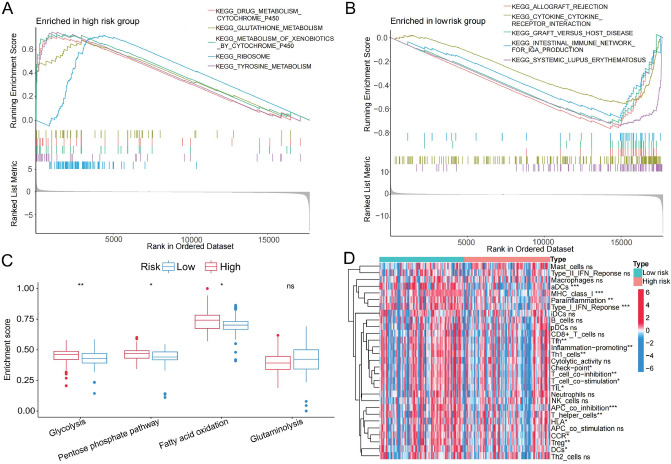
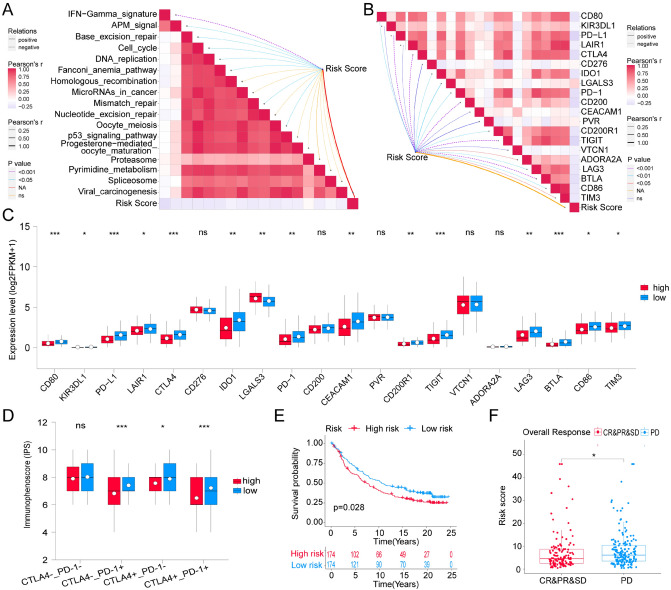
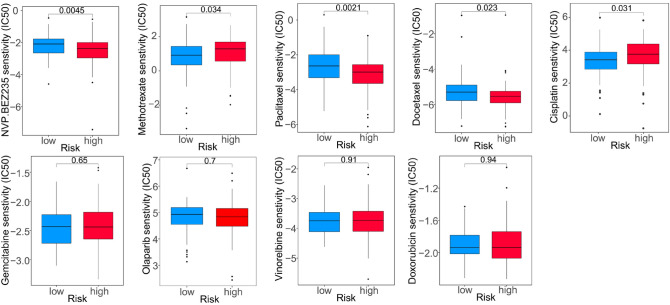
Taking NVP-BEZ235 (BEZ235) as an example to screen drug response-related genes (DRRGs) and explore their potential value in triple-negative breast cancer (TNBC). Through high-throughput technique, multidimensional transcriptome expression data (mRNA, miRNA and lncRNA) of BEZ235-treated and -untreated MDA-MB-468 cell lines were obtained. Combined with transcriptome data of the MDA-MB-468 cells and TCGA-TNBC tissues, differential gene expression analysis and WGCNA were performed to identify DRRGs associated with tumor trait by simulating the drug response microenvironment (DRM) of BEZ235-treated patients. Based on DRRGs, we constructed a ceRNA network and verified the expression levels of three key molecules by RT-qPCR, which not only demonstrated the successful construction of a BEZ235-treated cell line model but also explained the antitumor mechanism of BEZ235. Four molecular subtypes related to the DRM with survival difference were proposed using cluster analysis, namely glycolysis subtype, proliferation depression subtype, immune-suppressed subtype, and immune-activated subtype. A novel prognostic signature consisting of four DRRGs was established by Lasso-Cox analysis, which exhibited outstanding performance in predicting overall survival compared with several excellent reported signatures. The high- and low-risk groups were characterized by enrichment of metabolism-related pathways and immune-related pathways, respectively. Of note, the low-risk group had a better response to immune checkpoint blockade. Besides, pRRophetic analysis found that patients in the low-risk group were more sensitive to methotrexate and cisplation, whereas more resistant to BEZ235, docetaxel and paclitaxel. In conclusion, the DRRGs exemplified by BEZ235 are potential biomarkers for TNBC molecular typing, prognosis prediction and targeted therapy. The novel DRRGs-guided strategy for predicting the subtype, survival and therapy efficacy, might be also applied to more cancers and drugs other than TNBC and BEZ235.


Conflict of interest statement

The authors declare no competing interests.

Figures

Figure 1
Figure 1
Screening for the BEZ235 response-related genes. (AC) The heatmap showing the top 50 DEmRNAs, DElncRNAs, and DEmiRNAs between BEZ235-treated and control group, respectively. (DF) The heatmap showing the top 50 DEmRNAs, DElncRNAs, and DEmiRNAs between tumor and normal group, respectively. (GI) The Venn diagram was utilized to obtain BEZ235 response-related DElncRNAs, DEmRNAs and DEmiRNAs, respectively. DEmRNAs/DElncRNAs/DEmiRNAs: differentially expressed mRNAs/lncRNAs/miRNAs.
Figure 2
Figure 2
Screening for the BEZ235 response-related genes associated with tumor trait and function analysis. (AC) The correlation of the modules with the tumor traits was shown in the heatmap. Each cell contained the corresponding correlation and P value. The red font represents the selected modules. (DF) The Venn diagram was utilized to obtain tumor-related and BEZ235 response-related DERNAs. (GH) Enrichment of GO and KEGG terms for BEZ235 response-related genes associated tumor trait. DERNAs: differentially expressed RNAs.
Figure 3
Figure 3
Construction of BEZ235-related ceRNA network. (A,B) GSVA analysis screened for differential Hallmark pathways between tumor and normal, and between BEZ235-treated and control group, respectively. The upset diagrams were used to screen the intersection miRNA-mRNA pairs (C) and miRNA-lncRNA pairs (D), and the dot-lines in red represented the selected relationship pairs. (E) BEZ235-related ceRNA network was built by Cytoscape. The red shape/font represents the genes upregulated in BEZ235-treated cell lines/TNBC tissue, and the blue shape is the opposite. (FH) The RT-qPCR analysis was used to verify the expression levels of 3 genes, including LINC00460, SLC7A5and hsa-miR-143-3p. “***”P < 0.001, “**”P < 0.01, “*”P < 0.05.
Figure 4
Figure 4
Identification of TNBC molecular subtype. (A,B) Univariate Cox analysis of mRNAs and lncRNAs, respectively. (C) Unsupervised clustering analysis of the TCGA-TNBC specimens using non-negative matrix factorization (NMF) and 23 BEZ235 response-related genes. An optimal rank of 4 was selected based on high cophenetic and silhouette coefficients (see Fig. S6). shown is the NMF matrix at rank of 4, and the subgroup assignments derived from this cluster solution are color-coded at top. (D) Principal component analysis (PCA) of TCGA-TNBC specimens using 23 BEZ235 response-related genes. (E,F) Kaplan–Meier overall survival (OS) curve and progression-free survival (PFS) curve for TCGA-TNBC patients of different clusters. (G) Based on the Hallmark gene set, GSVA analysis was utilized to mine the functional characteristics of each cluster relative to the other 3 clusters.
Figure 5
Figure 5
Evaluation of the Lasso–Cox model in four data sets. (AD) The risk stratification diagram (including risk status map, risk point map and risk heat map) showed that patients in the high-risk group had worse overall survival (OS) in internal training set (A), internal validation set (B), entire TCGA-TNBC cohort (C) and GSE58812 cohort (D). (EH) Time dependent ROC analysis of Lasso–Cox model in internal training set (E), internal validation set (F), entire TCGA-TNBC cohort (G) and GSE58812 cohort (H). (IL) Kaplan–Meier survival analysis of Lasso–Cox model in internal training set (I), internal validation set (J), entire TCGA-TNBC cohort (K) and GSE58812 cohort (L). *P < 0.05; **P < 0.01; ***P < 0.001.
Figure 6
Figure 6
Time dependent ROC analysis and Kaplan–Meier survival analysis of the four-gene risk model in different clinical subgroups. NA: For less than two outcome events, no ROC curve was drawn.
Figure 7
Figure 7
Evaluation of Lasso–Cox versus reported models in the integrated dataset (includig TCGA-TNBC, GSE58812 and GSE135561). (A) C-index analysis of the Lasso–Cox Signature, Criscitiello Signature, Alexandre Signature and Yang Signature. (B) INR and IDI analysis between reported models and Lasso–Cox model. (C,D) 1-year, 3-year and 5-year of calibration curve analysis and decision curve analysis (DCA) among Lasso–Cox Signature, Criscitiello Signature, Alexandre Signature and Yang Signature. *: P < 0.05; **: P < 0.01; ns: no significance.
Figure 8
Figure 8
Functional enrichment analysis between high-risk group and low-risk group. (A) Top 10 of KEGG enrichment analysis showed that the low-risk group was enriched in pathways associated with immune full activation; (B) The high-risk group was prominently enriched in metabolism pathways. (C) Differential analysis of ssGSEA enrichment scores of four energy metabolism pathways between high- and low- risk group. (D) Differences in the ssGSEA enrichment scores of immune-related cells/pathways between high- and low-risk group in TCGA-TNBC cohort. *P < 0.05; **P < 0.01; ***P < 0.001; ns: no significance.
Figure 9
Figure 9
Roles of Risk score in predicting immune phenotypes in TCGA-TNBC cohort. (A) Correlations between Risk score and the enrichment scores of immunotherapy-predicted pathways. (B) Correlations between Risk score and immune checkpoints. (C) Analysis of differential expression level of immune checkpoints between high- and low-risk groups in TCGA-TNBC cohort. (D) The association between immunophenoscore (IPS) and the Risk score of TNBC patients in TCGA. (E) Kaplan–Meier survival analysis of Lasso–Cox Signature in IMvigor210 cohort for overall survival. (F) The difference of Risk score in the subgroup of PD-1 treatment response in IMvigor210 cohort. *P < 0.05; **P < 0.01; ***P < 0.001; ns: no significance; NA: not applicable.
Figure 10
Figure 10
Evaluation of chemosensitivity by the risk model.

Similar articles

Cited by

References

    1. Smolarz B, Nowak AZ, Romanowicz H. Breast cancer-epidemiology, classification, pathogenesis and treatment (review of literature) Cancers. 2022 doi: 10.3390/cancers14102569. - DOI - PMC - PubMed
    1. Andre F, Zielinski CC. Optimal strategies for the treatment of metastatic triple-negative breast cancer with currently approved agents. Ann. Oncol. 2012;23(Suppl 6):vi46–vi51. doi: 10.1093/annonc/mds195. - DOI - PubMed
    1. Sanchez-Munoz A, et al. Targeted therapy of metastatic breast cancer. Clin. Transl. Oncol. 2009;11:643–650. doi: 10.1007/s12094-009-0419-6. - DOI - PubMed
    1. Guney Eskiler G. The interaction of PI3K inhibition with homologous recombination repair in triple negative breast cancer cells. J. Pharm. Pharm. Sci. 2019;22:599–611. doi: 10.18433/jpps30684. - DOI - PubMed
    1. Costa RLB, Han HS, Gradishar WJ. Targeting the PI3K/AKT/mTOR pathway in triple-negative breast cancer: A review. Breast Cancer Res. Treat. 2018;169:397–406. doi: 10.1007/s10549-018-4697-y. - DOI - PubMed

Publication types

MeSH terms