. 2023 Apr;29(4):833-845.
doi: 10.1038/s41591-023-02230-w. Epub 2023 Apr 12.

Evolutionary characterization of lung adenocarcinoma morphology in TRACERx

Takahiro Karasaki #  1   2   3 David A Moore #  1   2   4 Selvaraju Veeriah  1 Cristina Naceur-Lombardelli  1 Antonia Toncheva  1 Neil Magno  1 Sophia Ward  1   2   5 Maise Al Bakir  1   2 Thomas B K Watkins  2 Kristiana Grigoriadis  1   2   6 Ariana Huebner  1   2   6 Mark S Hill  2 Alexander M Frankell  1   2 Christopher Abbosh  1 Clare Puttick  1   2   6 Haoran Zhai  1   2 Francisco Gimeno-Valiente  1 Sadegh Saghafinia  1 Nnennaya Kanu  1 Michelle Dietzen  1   2   6 Oriol Pich  2 Emilia L Lim  1   2 Carlos Martínez-Ruiz  1   6 James R M Black  1   6 Dhruva Biswas  1   2   7 Brittany B Campbell  2 Claudia Lee  2 Emma Colliver  2 Katey S S Enfield  2 Sonya Hessey  1   3   8 Crispin T Hiley  1   2 Simone Zaccaria  1   8 Kevin Litchfield  1   9 Nicolai J Birkbak  1   2   10   11   12 Elizabeth Larose Cadieux  13   14 Jonas Demeulemeester  13   15   16 Peter Van Loo  13   17   18 Prasad S Adusumilli  19   20 Kay See Tan  21 Waseem Cheema  19 Francisco Sanchez-Vega  21 David R Jones  19 Natasha Rekhtman  22 William D Travis  22 Allan Hackshaw  23 Teresa Marafioti  4 Roberto Salgado  24   25 John Le Quesne  26   27   28 Andrew G Nicholson  29   30 TRACERx ConsortiumNicholas McGranahan  31   32 Charles Swanton  33   34   35 Mariam Jamal-Hanjani  36   37   38
Collaborators, Affiliations

Evolutionary characterization of lung adenocarcinoma morphology in TRACERx

Takahiro Karasaki et al. Nat Med. 2023 Apr.

Abstract

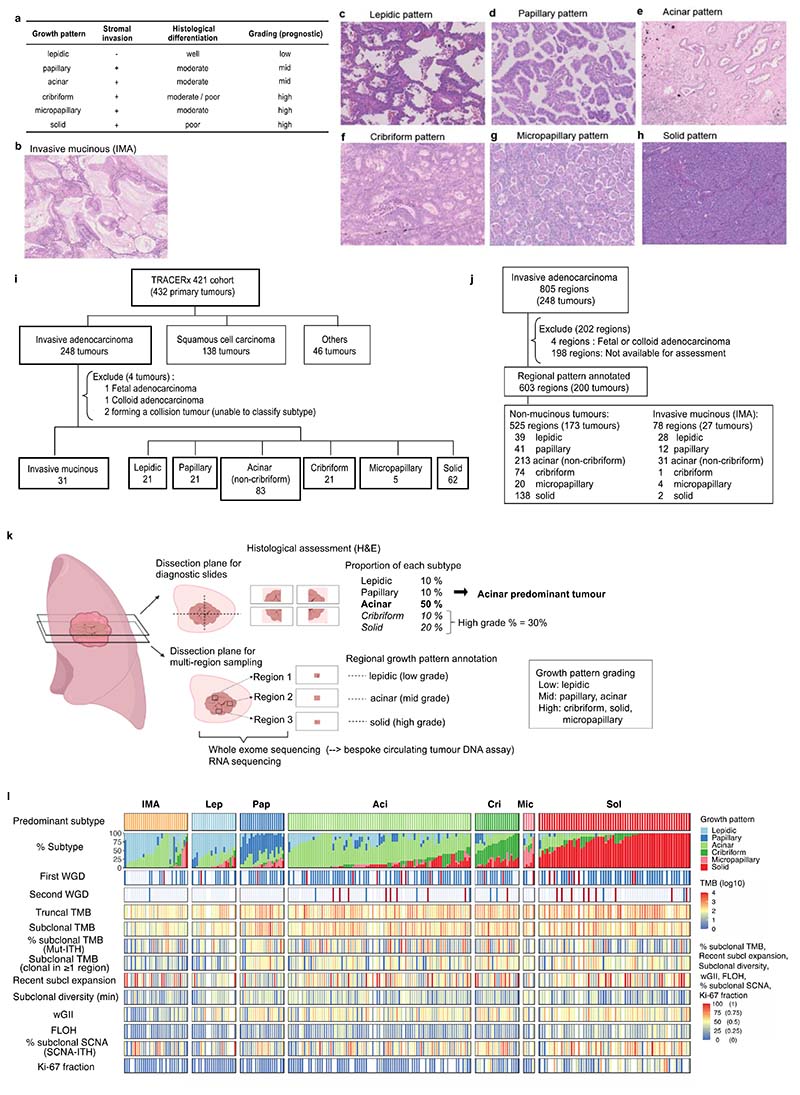
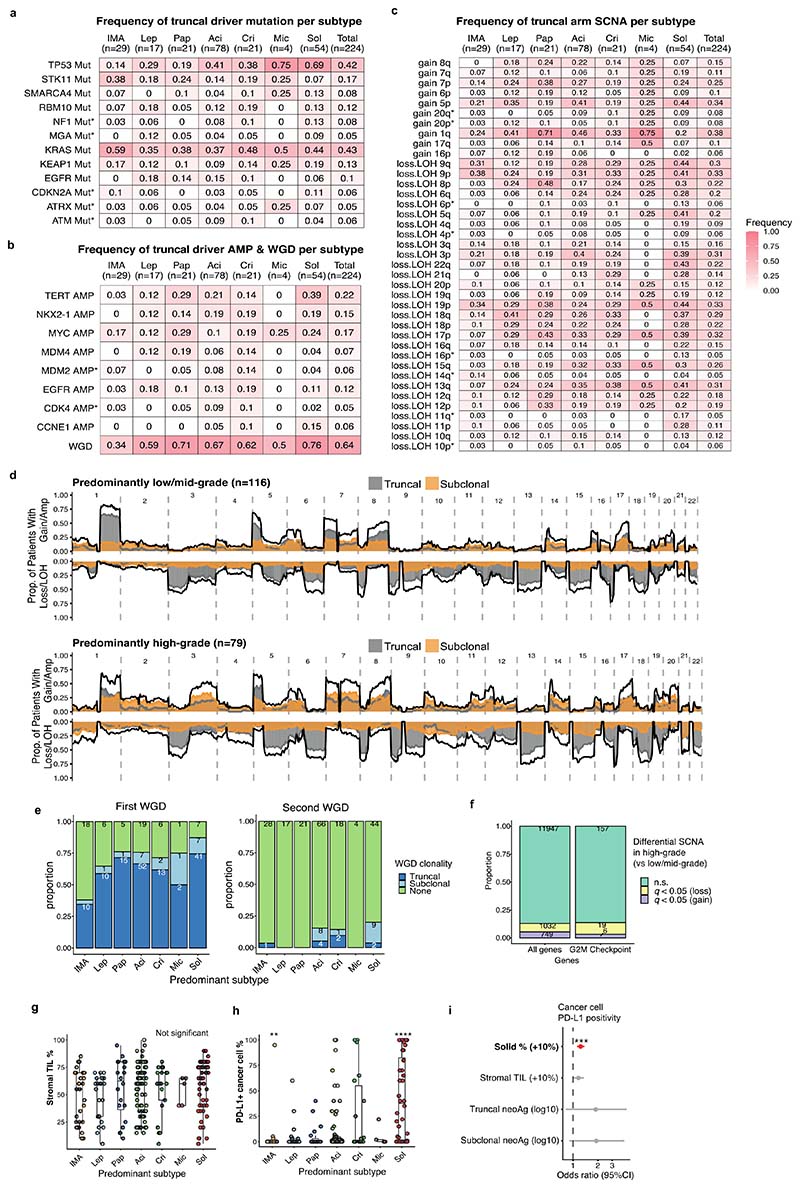
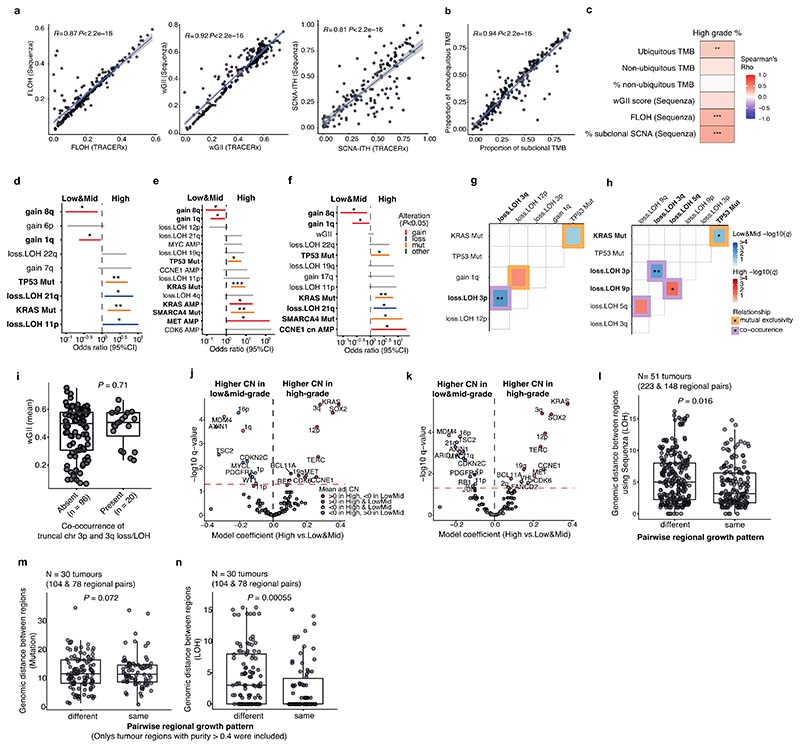
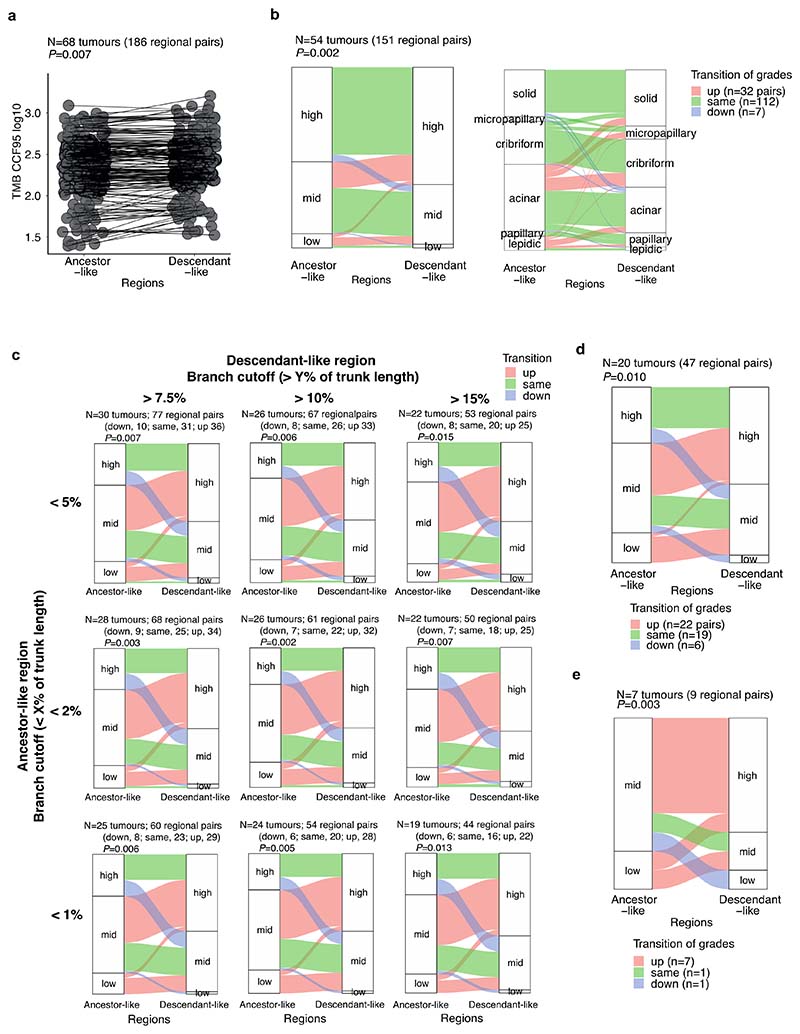
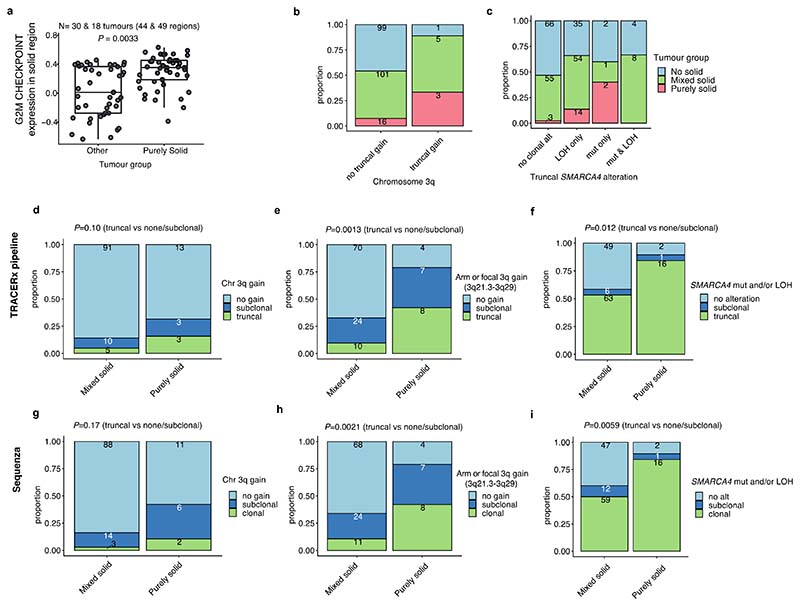
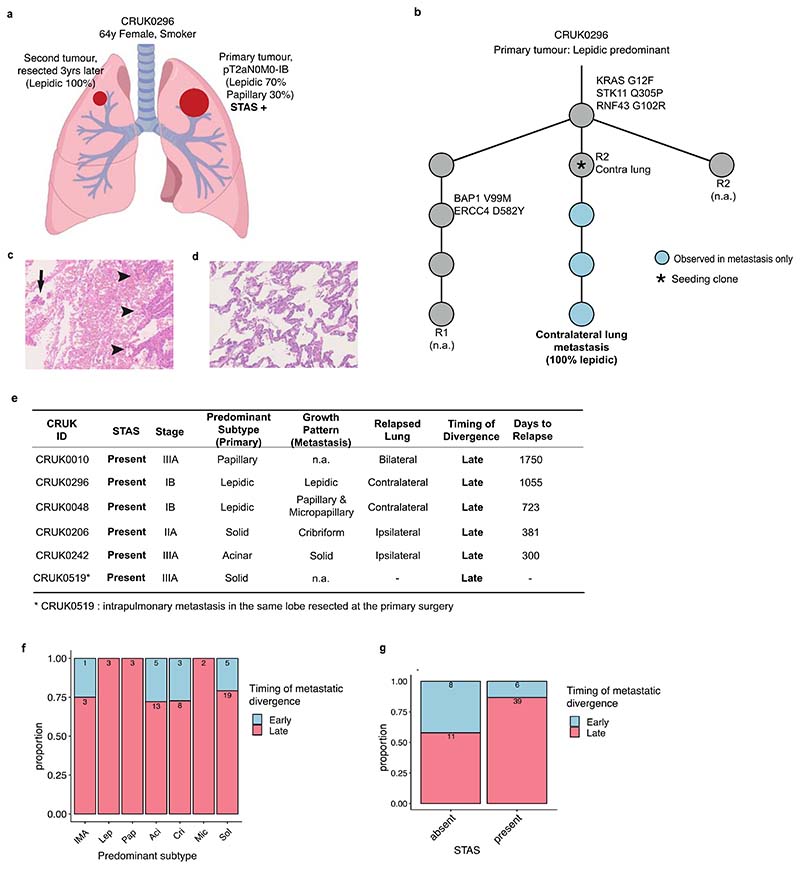
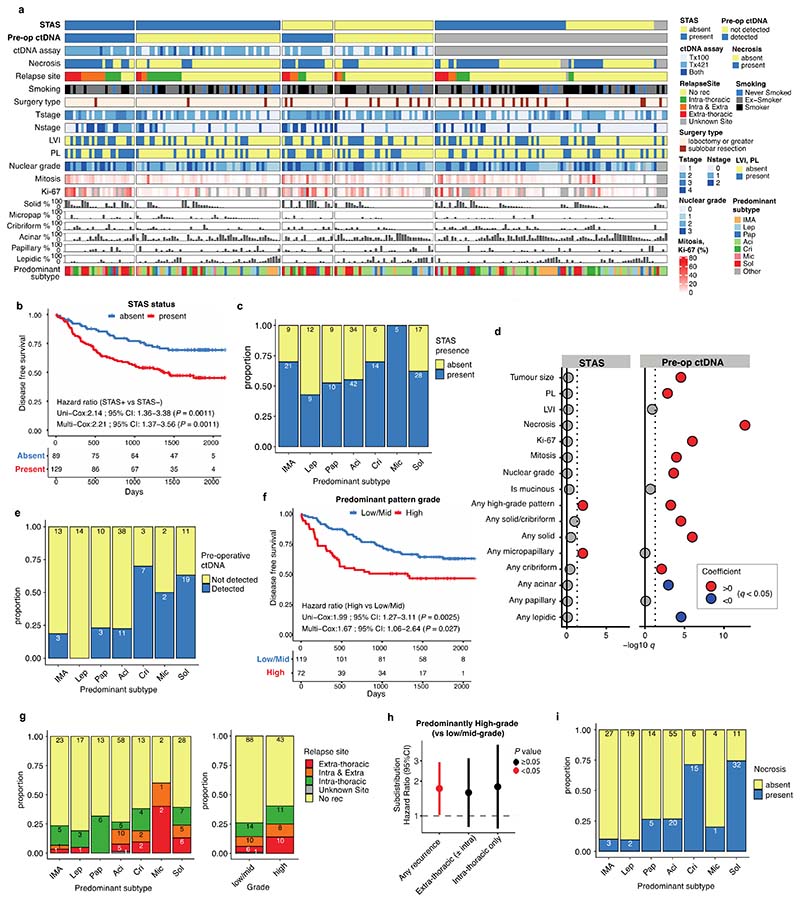
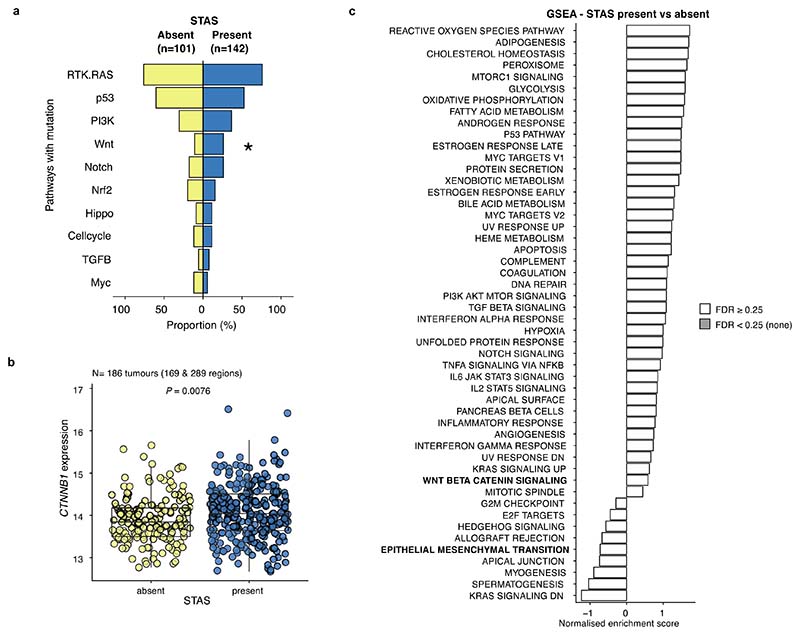
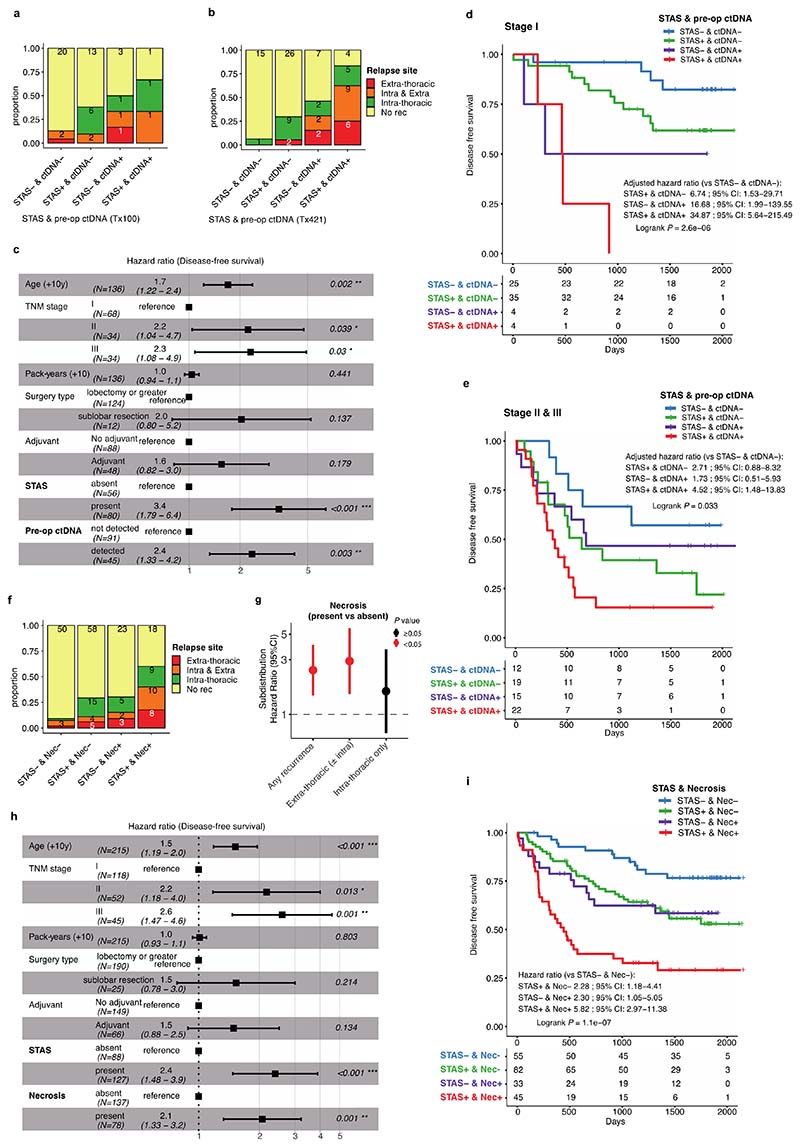
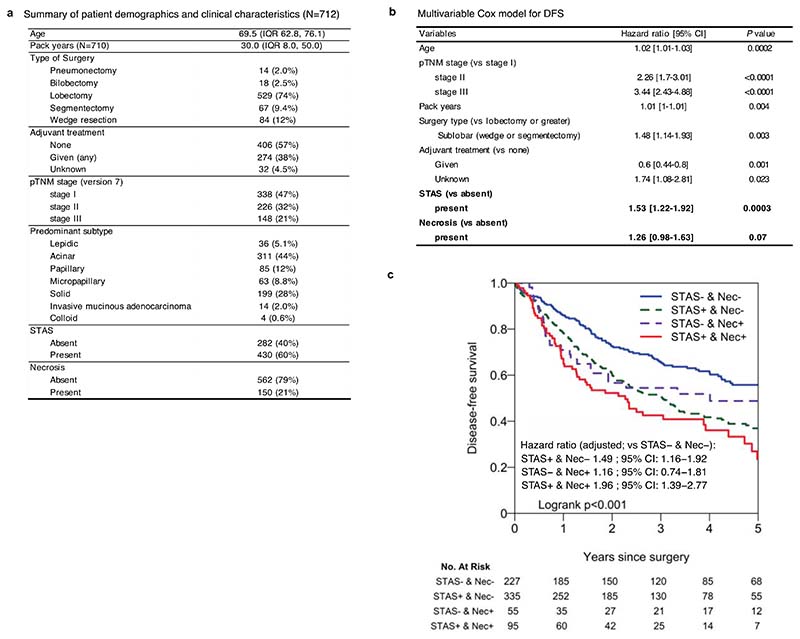
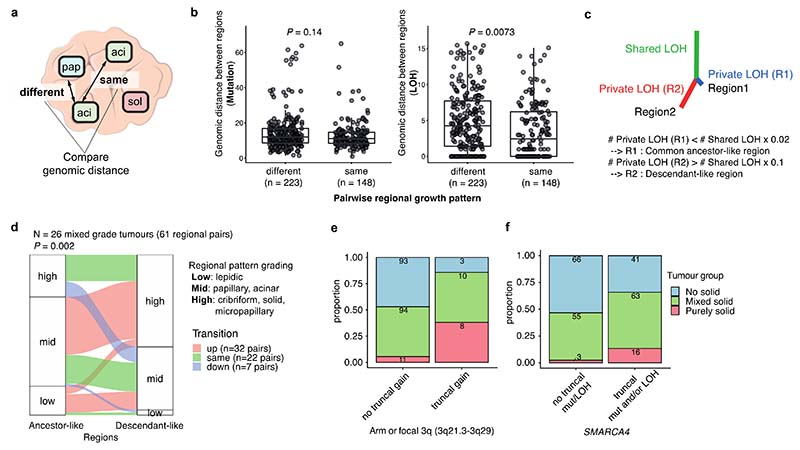
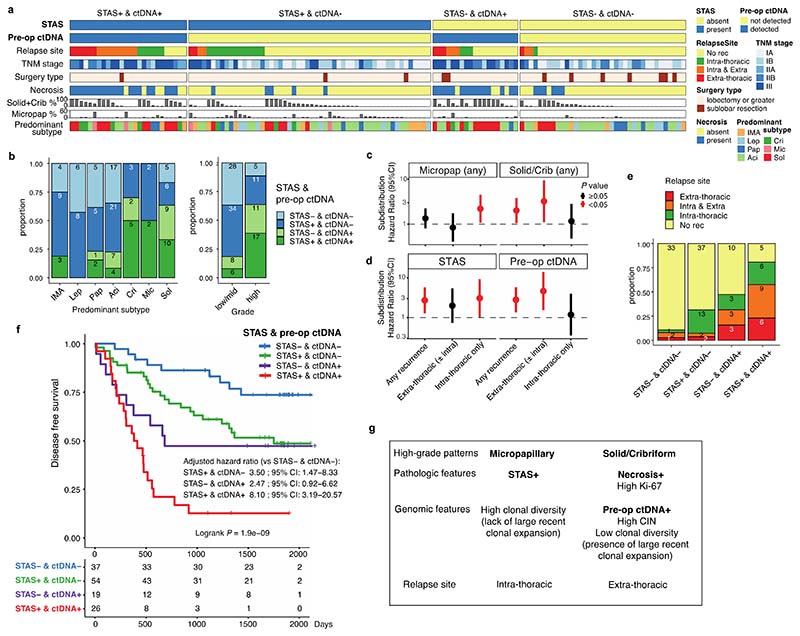
Lung adenocarcinomas (LUADs) display a broad histological spectrum from low-grade lepidic tumors through to mid-grade acinar and papillary and high-grade solid, cribriform and micropapillary tumors. How morphology reflects tumor evolution and disease progression is poorly understood. Whole-exome sequencing data generated from 805 primary tumor regions and 121 paired metastatic samples across 248 LUADs from the TRACERx 421 cohort, together with RNA-sequencing data from 463 primary tumor regions, were integrated with detailed whole-tumor and regional histopathological analysis. Tumors with predominantly high-grade patterns showed increased chromosomal complexity, with higher burden of loss of heterozygosity and subclonal somatic copy number alterations. Individual regions in predominantly high-grade pattern tumors exhibited higher proliferation and lower clonal diversity, potentially reflecting large recent subclonal expansions. Co-occurrence of truncal loss of chromosomes 3p and 3q was enriched in predominantly low-/mid-grade tumors, while purely undifferentiated solid-pattern tumors had a higher frequency of truncal arm or focal 3q gains and SMARCA4 gene alterations compared with mixed-pattern tumors with a solid component, suggesting distinct evolutionary trajectories. Clonal evolution analysis revealed that tumors tend to evolve toward higher-grade patterns. The presence of micropapillary pattern and 'tumor spread through air spaces' were associated with intrathoracic recurrence, in contrast to the presence of solid/cribriform patterns, necrosis and preoperative circulating tumor DNA detection, which were associated with extra-thoracic recurrence. These data provide insights into the relationship between LUAD morphology, the underlying evolutionary genomic landscape, and clinical and anatomical relapse risk.


Conflict of interest statement

Competing Interests

D.A.M. reports speaker fees from AstraZeneca and Takeda, consultancy fees from AstraZeneca, Thermo Fisher, Takeda, Amgen, Janssen and Eli Lilly and has received educational support from Takeda and Amgen. S.V is a co-inventor to a patent to detecting molecules in a sample (Patent # 10578620). M.A.B. has consulted for Achilles Therapeutics D.B. reports personal fees from NanoString and AstraZeneca. He has a patent PCT/GB2020/050221 issued on methods for cancer prognostication. K.S.S.E. received research grant funding from BMS. C.A. has received speaking honoraria or expenses from Novartis, Roche, AstraZeneca and BMS; has patents issued to detect tumour recurrence (PCT/GB2017/053289) and methods for lung cancer detection (PCT/US2017/028013); and is a current employee of AstraZeneca. C.T.H. has received speaker fees from AstraZeneca. K.L. has a patent on indel burden and CPI response pending and speaker fees from Roche tissue diagnostics, research funding from CRUK TDL/Ono/LifeArc alliance, and a consulting role with Monopteros Therapeutics. N.J.B. is a co-inventor to a patent to identifying responders to cancer treatment (PCT/GB2018/051912). E.L.C. is employed by and holds shares of Achilles Therapeutics. P.S.A. is a Scientific Advisory Board Member and Consultant for ATARA Biotherapeutics, Bayer, Carisma Therapeutics, Imugene, ImmPactBio, Johnston & Johnston, Orion, OutpaceBio; declares patents, royalties and intellectual property on mesothelin-targeted CAR and other T-cell therapies, which have been licensed to ATARA Biotherapeutics, issued patent method for detection of cancer cells using virus, and pending patent applications on PD-1 dominant negative receptor, wireless pulse-oximetry device, and on an ex vivo malignant pleural effusion culture system. D.R.J. has consulted for AstraZeneca and is a member of Clinical Trial Steering Committee for Merck. N.R. serves on an NCI Thoracic Malignancies Steering Committee (which is a compensated role). W.D.T. is a non-paid consultant for the LCMC3 and LCMC4 neoadjuvant clinical trials. A.Ha. has received fees for member of Independent Data Monitoring Committees for Roche-sponsored clinical trials, and academic projects co-ordinated by Roche. R.S. reports research funding by Roche, Merck, and Puma Biotechnology; travel and congress-registration support by Roche, Merck, and Astra Zeneca; and was part of Advisory Boards for Bristol Myers Squibb and Roche. A.G.N reports personal fees from Merck, Boehringer Ingelheim, Novartis, Astra Zeneca, Bristol Myer Squib, Roche, Abbvie, Oncologica, Uptodate, European Society of Oncology, Takeda UK, and Liberium, and personal fees and grants from Pfizer. N.M. has stock options in and has consulted for Achilles Therapeutics and holds a European patent in determining HLA LOH (PCT/GB2018/052004), and is a co-inventor to a patent to identifying responders to cancer treatment (PCT/GB2018/051912). M.J-H is a CRUK Career Establishment Awardee and has received funding from CRUK, IASLC International Lung Cancer Foundation, Lung Cancer Research Foundation, Rosetrees Trust, UKI NETs, NIHR, NIHR UCLH Biomedical Research Centre. M.J-H. has consulted, and is a member of the Scientific Advisory Board and Steering Committee, for Achilles Therapeutics, has received speaker honoraria from Astex Pharmaceuticals, Oslo Cancer Cluster, and holds a patent PCT/US2017/028013 relating to methods for lung cancer detection. C.S. acknowledges grant support from Pfizer, AstraZeneca, Bristol Myers Squibb, Roche-Ventana, Boehringer-Ingelheim, Archer Dx Inc. (collaboration in minimal residual disease sequencing technologies) and Ono Pharmaceutical; is an AstraZeneca Advisory Board Member and Chief Investigator for the MeRmaiD1 clinical trial; has consulted for Amgen, Pfizer, Novartis, GlaxoSmithKline, MSD, Bristol Myers Squibb, AstraZeneca, Illumina, Genentech, Roche-Ventana, GRAIL, Medicxi, Bicycle Therapeutics, Metabomed and the Sarah Cannon Research Institute; has stock options in Apogen Biotechnologies, Epic Bioscience and GRAIL; and has stock options and is co-founder of Achilles Therapeutics. C.S. holds patents relating to assay technology to detect tumour recurrence (PCT/GB2017/053289); to targeting neoantigens (PCT/EP2016/059401), identifying patent response to immune checkpoint blockade (PCT/EP2016/071471), determining HLA LOH (PCT/GB2018/052004), predicting survival rates of patients with cancer (PCT/GB2020/050221), to treating cancer by targeting Insertion/deletion mutations (PCT/GB2018/051893); identifying insertion/deletion mutation targets (PCT/GB2018/051892); methods for lung cancer detection (PCT/US2017/028013); and identifying responders to cancer treatment (PCT/GB2018/051912). A.M.F., C.A. and C.S. are named inventors on a patent application to determine methods and systems for tumour monitoring (GB2114434.0).

Figures

Extended Data Fig. 1 |
Extended Data Fig. 1 |. Histopathological assessment of the TRACERx 421 LUAD cohort
a. Definition and categorisation of LUAD growth patterns. b. Representative haematoxylin and eosin (H&E) photo of invasive mucinous adenocarcinoma (IMA). c-h. Representative H&E photos of lepidic (c), papillary (d), acinar (e), cribriform (f), micropapillary (g), and solid (h) pattern observed in LUAD. i. Number of each predominant subtype tumour in the TRACERx 421 cohort. j. Number of regions with growth pattern assessment. k. Schematic of histological assessment in the TRACERx study. Proportions of each subtype in the diagnostic slides were reported, and the predominant subtype was used to label each tumour. Multi-region sampling specimens were processed for whole exome sequencing, and each region was annotated with the representative growth pattern. l. Overview of TRACERx 421 LUAD cohort including invasive mucinous adenocarcinoma. Each column represents one tumour (n = 244). The proportion of each growth pattern based on diagnostic sectional area, genomic variables, and Ki-67 fraction by immunohistochemical staining are summarised. WGD, whole genome doubling; TMB, tumour mutational burden; ITH, intra-tumour heterogeneity; Mut, mutational; wGII, weighted genome instability index; FLOH, fraction of the genome subject to loss of heterozygosity; SCNA, somatic copy number alteration.
Extended Data Fig. 2 |
Extended Data Fig. 2 |. Genomic correlates of LUAD predominant subtypes
a-c. Frequency of truncal driver mutations (a), truncal driver gene somatic copy number alterations (SCNAs) (AMP, amplification) and whole genome doubling (WGD) (b), and chromosomal arm level SCNAs (gain/loss&LOH) (c) in LUAD predominant subtypes. Recurrent truncal alterations observed in more than 5% of the tumours in the cohort are shown. Asterisks represent the alterations observed in fewer than 10 tumours in both predominantly high- and low/mid-grade predominant tumours. Colour scale represents the frequency of the alteration observed within each subtype. d. Across-genome plots showing the frequency of truncal and subclonal SCNAs of low/mid-grade predominant tumours (top) and high-grade predominant tumours (bottom). Within each tumour type, the proportion of patients with gains or amplifications (top) and loss/LOH events (bottom) for each chromosome are described. The black line indicates the total (namely the sum of truncal and subclonal) proportion of tumours with SCNAs; the yellow and grey lines or shades indicate the proportion of tumours with subclonal and truncal gains, respectively. e. The frequency of first and second WGD across LUAD predominant subtypes. f. Number of genes with differential SCNA between high-grade and low/mid-grade predominant tumours. G2M checkpoint-related genes were not differentially gained in predominantly high-grade tumours (P = 0.20, chi-square goodness of fit test). g,h. Comparison of stromal TIL scores (g) and PD-L1 expression on cancer cells measured by IHC staining (h) across LUAD predominant subtypes. Each predominant subtype was compared against all other subtype tumours. Centre line, median; box limits, upper and lower quartiles; whiskers, 1.5× interquartile range. P values were corrected for multiple testing according to Benjamini-Hochberg and asterisks indicate q value ranges * q < 0.05, ** q <0.01, *** q < 0.001, **** q < 0.0001. i. Adjusted odds ratios for cancer cell PD-L1 positivity (≥ 1%) estimated by multivariable logistic regression model. Asterisks indicate type II ANOVA P value ranges * P < 0.05, ** P <0.01, *** P < 0.001. Statistically significant covariates are indicated in bold.
Extended Data Fig. 3 |
Extended Data Fig. 3 |. Validation of SCNA analysis using orthogonal methods
a-b. Comparison of ITH metrics calculated using TRACERx analytical pipeline vs orthogonal methods. (a) Comparison of fraction of the genome subject to loss of heterozygosity (FLOH), weighted genome instability index (wGII), and somatic copy number aleration intra-tumour heterogeneity (SCNA-ITH) by SCNA profiles generated by the TRACERx pipeline (based on ASCAT with additional multi-sample SCNA estimation approach,) against SCNA profiles generated by Sequenza and (b) a comparison of % subclonal tumour mutational burden (TMB) using the TRACERx pipeline (clonality inferred by the modified version of PyClone) vs % non-ubiquitous TMB. c. Correlation of genomic variables calculated using orthogonal methods and the proportion of high-grade patterns within each tumour. Colour scale reflects Spearman’s rank correlation coefficient (rho). Correlation P values were corrected for multiple testing according to Benjamini-Hochberg (BH) and asterisks indicate q value ranges * q < 0.05, ** q <0.01, *** q < 0.001, **** q < 0.0001. d-f. Adjusted odds ratios of truncal genomic alterations associated with the predominance of high-grade patterns. Genomic alterations selected by the model simplification are shown when (d) truncal alterations observed in more than 10% of the tumours in the cohort are included in the analysis, or when (e) SCNA profiles generated by Sequenza are used, or when (f) wGII is added to the model shown in Fig. 1d. Asterisks indicate type II ANOVA P value ranges * P < 0.05, ** P <0.01, *** P < 0.001. Colour represents the type of genomic alteration. Statistically significant alterations are indicated in bold. g-h. Mutual exclusivity and cooccurrence of truncal driver gene alterations and chromosome arm somatic copy number alterations when (g) truncal alterations observed in more than 10% of the tumours in the cohort are included in the analysis, or when (h) SCNA profiles generated by Sequenza are used. Colour of the edge represents the relationship (mutual exclusivity vs co-occurrence) and the negative log of the q value (BH method) is represented in blue colour scale in predominantly low/mid-grade tumours and red colour scale in predominantly high-grade tumours. Relationships with q < 0.1 are shown and asterisks indicate q value ranges * q < 0.05, ** q <0.01. Covariates in statistically significant relationships are indicated in bold. i. Comparison of wGII between tumours with and without co-occurrence of truncal loss/LOH of chromosome 3p and 3q in predominantly low/mid-grade tumours. P value was calculated using Wilcoxon rank sum test. j-k. Comparison of ploidy adjusted mean copy number of chromosomal arm and driver genes between high-grade and low/mid-grade predominant tumours, (j) using SCNA profiles generated by Sequenza, and (k) adding wGII to the regression model. Fixed effect coefficients of the linear mixed effect model with each tumour as a random effect are displayed on the x-axis, and the negative log of the q value (BH method) is displayed on the y-axis. Colour represents the sign or the mean ploidy adjusted copy number, stratified with high-grade and low/mid-grade predominance. Data points with q value ≥ 0.05 are coloured in grey. Horizontal red dashed line represents q = 0.05. l-n. Genomic distance between regions calculated by LOH detected by Sequenza (l, n = 51 tumours) and genomic distance calculated by mutation (m) and LOH (n) only including tumour regions with purity > 0.4 (n = 30 tumours). Each point represents a distance between a pair of regions in a tumour. Tumours with regions containing both different subtype pair(s) and same subtype pair(s) are included in the analysis. Centre line, median; box limits, upper and lower quartiles; whiskers, 1.5× interquartile range. P values were calculated using a linear mixed effects model, with each tumour as a random effect.
Extended Data Fig. 4 |
Extended Data Fig. 4 |. Inference of ancestor-like and descendant-like regional pairs in the primary tumour
a. Comparison of tumour mutational burden (TMB) between ancestor-like and descendant-like regions. Each line represents an ancestor-descendant-like regional pair. Each point represents one region and the plotted points were duplicated for regions associated with multiple ancestor-descendant-like pairs within a tumour. To assess the mutational burden shared in the majority of the cancer cells in the region, mutations with estimated cancer cell fraction ≥ 95% were counted (TMB CCF95). Enrichment of higher TMB in descendant-like regions compared with the paired ancestor-like regions was evaluated by permutation test (1000 permutations, randomising TMB within each tumour, Monte-Carlo procedure). b. Comparison of growth pattern by grades (left) and by the six growth patterns (right) between inferred ancestral-like and descendant-like regions. Tumours with single grades are included in the analysis. Colour represents the transition of grade from ancestral-like to descendant-like region. Empirical P value was calculated using a permutation test (1000 permutations, randomising growth patterns within each tumour, Monte-Carlo procedure). c. Comparison of regional growth pattern grade in ancestor-descendant-like pairs, inferred by various cutoffs of private LOH branch length proportional to the trunk (shared LOH). All combinations of cutoff for ancestor-like and descendant-like inference shown in the figure yielded empirical P value < 0.05 (1000 permutations, Monte-Carlo procedure) when the enrichment of lower-to-higher grade transition (upward transition) was tested. P values were not adjusted for the multiple comparisons shown in this panel. d. Comparison of regional pattern grade in ancestor-descendant-like pairs, inferred by LOH profile generated by Sequenza . e. Comparison of regional pattern grade in ancestor-descendant-like pairs, inferred by both LOH profile and mutational profile (CCF ≥ 95%).
Extended Data Fig. 5 |
Extended Data Fig. 5 |. Characterisation of purely (homogenously) solid tumours
a. Comparison of G2M checkpoint gene expression in solid-pattern regions within purely solid tumours and mixed pattern tumours as defined by both diagnostic and regional growth pattern assessment. Centre line, median; box limits, upper and lower quartiles; whiskers, 1.5× interquartile range. P values were calculated using a linear mixed effects model, with each tumour as a random effect. b-c. Proportion of tumours which are purely solid, mixed pattern with solid component, and without any solid component, compared (b) between tumours with and without truncal gain of chromosome arm 3q and (c) across the tumours stratified by truncal SMARCA4 mutation and/or loss of heterozygosity (LOH). d-e. Comparison of the frequency of truncal copy number gain of (d) chromosome arm 3q and (e) arm or focal 3q (3q21.3-3q29) between mixed pattern tumours with solid component and purely solid tumours. f. Comparison of the frequency of truncal SMARCA4 mutation and LOH between mixed pattern tumours with solid component and purely solid tumours. g-h. Comparison of the frequency of copy number gain of (g) chromosome arm 3q and (h) arm or focal 3q (3q21.3-3q29) between mixed pattern tumours with solid component and purely solid tumours using somatic copy number alteration (SCNA) profiles generated by Sequenza. i. Comparison of the frequency of SMARCA4 mutation and LOH between mixed pattern tumours with solid component and purely solid tumours using SCNA profiles generated by Sequenza.
Extended Data Fig. 6 |
Extended Data Fig. 6 |. Analysis of morphology and genomics in metastasis samples
a. Schematic of primary and secondary lung tumours in CRUK0296. Phylogenetic analysis confirmed the contralateral lung lesion to be a metastasis from the resected primary tumour three years ago. Tumour spread through air spaces (STAS) was positive in the primary tumour. b. Phylogenetic tree of a case having lung metastasis with pure lepidic appearance (CRUK0296). Driver mutations are shown in the figure at the concordant mutational cluster. Regional growth pattern is indicated in brackets; n.a., not available. c. Representative haematoxylin and eosin (H&E) slide of a primary tumour of CRUK0296 showing tumour border (arrowheads) and STAS (arrow). d. Representative H&E slide of metastasis tumour in the contralateral lung of CRUK0296, which showed a pure lepidic pattern. e. Characteristics of five patients having lung recurrence samples sequenced and one patient having an intrapulmonary metastasis resected and sequenced at the time of primary surgery. All six patients showed positive STAS in the primary tumours and phylogenetic analysis revealed late metastatic divergence. f. Proportion of the timing of seeding clone divergence across predominant subtypes of primary tumours. g. Frequency of late or early divergence of the metastatic clone compared between tumours with and without STAS.
Extended Data Fig. 7 |
Extended Data Fig. 7 |. Characterisation of tumours with STAS and pre-operative ctDNA shedding
a. Overview of the TRACERx421 LUAD cohort, ordered by the positivity of STAS, pre-operative ctDNA detection, and the site of the relapse (n = 223). Patients with synchronous primary lung cancers were excluded. Colloid and fetal adenocarcinomas are included (predominant sutbype = Other). Each column represents each patient. IMA, invasive mucinous adenocarcinoma; LVI, lymphovascular invasion; PL, pleural invasion. Tumours that did not relapse before death or the development of a new primary cancer are treated as no recurrence (No rec). b. Kaplan-Meier curve of disease-free survival, comparing STAS present vs absent. Numbers at risk are described at the bottom. For the patients with multiple tumours, only patients having LUAD as the most advanced tumour were included in the analysis. Hazard ratio (HR) adjusted for age, stage, pack-years, surgery type, and adjuvant therapy is shown. c. STAS positivity across predominant subtypes of the primary tumour. d. Histopathological features associated with STAS positivity (left) and pre-operative ctDNA detection (right). Negative log of the q values (Benjamini-Hochberg method) in univariable logistic regression analyses are presented. Vertical dotted lines represent q = 0.05, and variables with q < 0.05 are presented in points with colours which represent the direction of the correlation. e. Pre-operative ctDNA positivity across predominant subtypes of the primary tumour. f. Kaplan-Meier curve of disease-free survival, comparing patients with predominantly high-grade tumours vs low/mid-grade tumours. Numbers at risk are described at the bottom. Hazard ratio (HR) adjusted for age, stage, pack-years, surgery type, and adjuvant therapy is shown. g. Frequency of the relapse site (intra- and/or extra-thoracic) across predominant subtypes (left) and grades of the predominant subtype (right) of primary tumour. Tumours that did not relapse before death or the development of a new primary cancer are treated as no recurrence (No rec). h. Relapse-site specific (subdistribution) hazard ratio for predominantly high-grade tumours compared with low/mid-grade tumours in all LUADs, adjusted for age, stage, pack-years, surgery type, and adjuvant therapy (n = 185). P < 0.05 are described in red (unadjusted for FDR). i. Positivity of necrosis across predominant subtypes of the primary tumour.
Extended Data Fig. 8 |
Extended Data Fig. 8 |. Genomic and transcriptomic analyses of STAS in LUAD
a. Frequency of driver mutations in 10 canonical oncogenic signalling pathways in STAS present and absent tumours. P values (Fisher’s exact test) were corrected for multiple testing according to Benjamini-Hochberg (BH) and the asterisk indicates q value range * q < 0.05. b. Comparison of CTNNB1 gene expression (variance stabilisation normalised count) between STAS positive and negative tumours. Centre line, median; box limits, upper and lower quartiles; whiskers, 1.5× interquartile range. P value was calculated using a linear mixed effect model, with each tumour as a random effect. c. Gene set enrichment analysis of Hallmark gene sets between STAS positive and negative tumours. Normalised enrichment score is displayed on the x-axis and indicates the enrichment for a given gene set. None of the gene sets showed q < 0.25 (BH method).
Extended Data Fig. 9 |
Extended Data Fig. 9 |. Impact of STAS, pre-operative ctDNA positivity, and necrosis on sites and risk of recurrence
a-b. Frequency of the relapse site (intra- and/or extra-thoracic), stratified by the positivity of STAS and pre-operative ctDNA detection. Pre-operative ctDNA data were based on (a) the assay previously reported by Abbosh et. al (Tx100 cohort) and (b) the assay reported in our companion manuscript (Tx421 cohort), including 7 patients who underwent both assays in each cohort. Tumours that did not relapse before death or the development of a new primary cancer are treated as no recurrence (No rec). c. Positivity of STAS and pre-operative ctDNA detection are incorporated with other tumour and clinical characteristics in a multivariable Cox proportional hazards model (disease-free survival). Hazard ratios (HRs) of each variable with 95% confidence intervals (CIs) are shown on the horizontal axis. d-e. Kaplan–Meier curves of disease-free survival, split by the positivity of STAS and pre-operative ctDNA detection in (d) stage I patients and (e) stage II & III patients. HRs were adjusted for age, stage, pack-years, and adjuvant therapy. Surgery type was also added as a covariate for stage I patients but not for stage II & III patients, because only 1 patient underwent sublobar resection in stage II & III patients. The number of patients in each group for every time point is indicated below the time point. f. Frequency of the relapse site (intra- and/or extra-thoracic), stratified by the presence of STAS and necrosis in all LUADs. g. Relapse-site specific (subdistribution) HR for positivity of necrosis in all LUADs, adjusted for age, stage, pack-years, surgery type, and adjuvant therapy (n=211). P < 0.05 are shown in red (unadjusted for FDR). h. Positivity of STAS and necrosis are incorporated with other tumour and clinical characteristics in a multivariable Cox proportional hazards model for disease-free survival. HRs of each variable with 95% CIs are shown. i. Kaplan–Meier curve of disease-free survival, split by the positivity of STAS and the presence of necrosis. HRs were adjusted for age, stage, pack-years, surgery type, and adjuvant therapy. The number of patients in each group for every time point is indicated below the time point.
Extended Data Fig. 10 |
Extended Data Fig. 10 |. External validation of the impact of STAS and necrosis on disease-free survival
a. Summary of patient demographics and clinical characteristics of the Memorial Sloan Kettering Cancer Center cohort (n = 712). b. Positivity of STAS and necrosis are incorporated with other tumour and clinical characteristics in a multivariable Cox proportional hazards model of disease-free survival. c. Kaplan–Meier curve of disease-free survival, split by the positivity of STAS and the presence of necrosis (n = 712). Hazard ratios were adjusted for age, stage, pack-years, surgery type, and adjuvant therapy. The number of patients in each group for every time point is indicated below the time point.
Fig. 1 |
Fig. 1 |. Determinants of inter-tumoural growth pattern heterogeneity
a. Overview of TRACERx 421 LUAD cohort (n = 244 tumours). Each column represents one tumour. Invasive mucinous adenocarcinomas (IMAs) were included. Fetal adenocarcinoma, colloid adenocarcinoma, and two tumours from a collision tumour determined by genomic analysis were excluded from the analysis. The proportion of each growth pattern based on diagnostic sectional area, the growth pattern per region, and basic clinical information are summarised. b-c. Correlation of genomic variables and (b) proportion of high-grade patterns and (c) proportion of each growth pattern within each tumour, with high-grade patterns indicated in bold. Colour scale reflects Spearman’s rank correlation coefficient (rho). Correlation P values were corrected for multiple testing according to Benjamini-Hochberg (BH) and and asterisks indicate q value ranges * q < 0.05, ** q <0.01, *** q < 0.001, **** q < 0.0001. TMB, tumour mutational burden; ITH, intra-tumour heterogeneity; LOH, loss of heterozygosity; SCNA, somatic copy number alteration. d. Adjusted odds ratios (OR) of truncal genomic alterations associated with the predominantly high-grade pattern tumours. Genomic alterations selected by the model simplification are shown, with statistically significant alterations indicated in bold. The OR and P values (type II ANOVA) in the figure come from single multivariable logistic regression analysis. Asterisks indicate P value ranges * P < 0.05, ** P <0.01, *** P < 0.001. Colour represents the type of genomic alteration. e. Mutual exclusivity and co-occurrence of truncal driver gene mutations and chromosome arm somatic copy number alterations in predominantly low/mid-grade tumours (n = 116). Colour of the edge represents the relationship (mutual exclusivity vs co-occurrence). The negative log of the q value (BH method) is represented in colour scale within each tile. Relationships with q < 0.1 are shown and asterisks indicate q value ranges * q < 0.05, ** q <0.01. f. Comparison of ploidy adjusted mean copy number of chromosomal arm and driver genes between high-grade and low/mid-grade predominant tumours. Fixed effect coefficients of the linear mixed effect model with each tumour as a random effect are displayed on the x-axis, and the negative log of the q value (BH method) is displayed on the y-axis. Colour represents the sign of the mean ploidy adjusted copy number, stratified with predominance of high-grade and low/mid-grade patterns. Data points with q value ≥ 0.05 are coloured in grey. Horizontal red dashed line represents q = 0.05. g. Gene set enrichment analysis of Hallmark gene sets between predominantly high- and low/mid-grade tumours. The normalised enrichment score is displayed on the x-axis and indicates the enrichment for a given gene set. Gene sets with q < 0.25 (BH method) are shown.
Fig. 2 |
Fig. 2 |. Morphological intra-tumoural heterogeneity reflects genomic heterogeneity
a. Schematic illustrating regions with different or the same growth patterns within each tumour. b. Genomic distance between regions calculated by presence of somatic mutation (left, n = 51 tumours) and LOH (right, n = 51 tumours). Genomic distances between identical (same) growth pattern regions and different growth pattern regions were compared. Each point represents a distance between a pair of regions in a tumour, and the number of regional pairs is shown under each group. Tumours with regions containing both different growth pattern pair(s) and same growth pattern pair(s) are included in the analysis. Centre line, median; box limits, upper and lower quartiles; whiskers, 1.5× interquartile range. P values were calculated using a linear mixed effects model, with each tumour as a random effect. c. Schematic illustrating inference of ancestor-like and descendant-like regional pairs using shared and private LOH profiles per cytoband. After building a LOH tree, if a branch length of Region1 (R1) is shorter than 2% of the trunk length, namely if R1 has private LOH burden less than 2% of the shared LOH burden, then R1 is inferred as a common ancestor-like region. Conversely, if a branch length of Region2 (R2) is longer than 10% of trunk length, namely if R2 has private LOH burden more than 10% of shared LOH burden, then R2 is inferred as a descendant-like region. d. Comparison of growth pattern (grade) between inferred ancestral-like and descendant-like regions. Only tumours with mixed pattern grades are included in the analysis. Colour represents the transition of grade from ancestor-like to descendant-like region. Empirical P value was calculated using a permutation test (1000 permutations, randomising growth patterns within each tumour, Monte-Carlo procedure). e-f. Proportion of tumours which are purely solid, mixed pattern with solid component, and without any solid component, compared between the tumours with and without (e) truncal gain of arm or focal 3q (3q21.3-3q29) and (f) truncal SMARCA4 mutation and/or LOH.
Fig. 3 |
Fig. 3 |. Evolution of LUAD growth patterns through metastasis
a. Overview of metastasis samples in the TRACERx LUAD cohort (n = 65 tumours). Growth pattern and the presence of seeding clones in primary tumour, growth pattern and the site of metastasis samples, timing of divergence of the metastasising clone, and presence of the tumour spread through air space (STAS) in the primary tumour are shown. b. Frequency of metastasis samples analysed according to the growth pattern at metastasis. The y-axis represents the proportion of the metastatic samples, with the colour representing the predominant subtype of the primary tumour. Multiple metastasis samples from the same primary tumour are counted independently. c. Schematic showing the calculation of mean grade scores of non-seeding regions and seeding regions in the primary tumour, as well as metastatic samples. Grade scores of 1, 2, and 3 were given for low-, mid- and high-grade patterns respectively, and mean scores per group were calculated for each tumour. d. Comparison of growth patterns between seeding and non-seeding regions in primary tumours. Growth patterns were transformed into scores (1: low-grade, 2 : mid-grade and 3: high-grade) and mean scores of non-seeding region(s) and seeding region(s) were calculated for each tumour, as described in Fig. 3c. Tumours harbouring at least one seeding and non-seeding region with growth pattern annotation were included in the analysis (n = 30). Mean scores of growth patterns in seeding and non-seeding regions were calculated. The median is indicated by the red horizontal line. A two-sided Wilcoxon signed-rank test was used. e. Comparison of growth pattern between metastasis and the primary tumour seeding regions (n = 60). The median is indicated by the red horizontal line. A two-sided Wilcoxon signed-rank test was used. f. Example of phylogenetic tree (CRUK0543) including multiple metastases to lymph nodes resected at surgery. Each node in the tree represents a mutational cluster and their colour indicates the following: blue, mutational cluster only seen in papillary region (primary tumour regions R2, 3, 4, 5, 6, 7); pink, mutational clusters only seen in micropapillary region (primary tumour region R1); green, mutational clusters only seen in cribriform regions (metastatic LN #8); yellow, mutational clusters seen in regions with different patterns. LN#10 (acinar) and LN#7 (cribriform) were predicted to have identical mutational clones. Asterisks represent most recent common ancestors of primary tumour regions and metastases (seeding clones). Terminal clusters of each branch and seeding clones are annotated with the region name where the cluster is harboured and with the growth pattern of the region in the brackets. g. Representative haematoxylin and eosin staining images from CRUK0543. R1, primary region with micropapillary pattern; R5 and R7, primary regions with papillary pattern; LN#10, metastatic lymph node with acinar pattern; LN#7 and #8, metastatic lymph nodes with cribriform pattern.
Fig. 4 |
Fig. 4 |. Impact of tumour morphology upon site and risk of recurrence
a. Overview of the TRACERx 421 LUAD cohort with STAS assessment and pre-operative ctDNA data (n = 136 patients), excluding the patients with synchronous primary lung cancers. Each column represents each patient. IMA, invasive mucinous adenocarcinoma. Tumours that did not relapse before death or the development of a new primary cancer are treated as no recurrence (No rec). b. Frequency of STAS and pre-operative ctDNA positivity across predominant subtypes (left) and grades of the predominant subtype (right) of primary tumour. c-d. Relapse-site specific (subdistribution) hazard ratio (HR) for (c, left) the presence of micropapillary pattern and (c, right) the presence of solid and/or cribriform patterns (n = 215), and (d, left) the positivity of STAS and (d, right) pre-operative ctDNA detection in patients with pre-operative ctDNA data (n = 131). HR were adjusted for age, stage, pack-years, surgery type, and adjuvant therapy using Fine-Gray regression model. P < 0.05 are shown in red (unadjusted for FDR). e. Frequency of the relapse site (intra- and/or extra-thoracic), stratified by the positivity of STAS and pre-operative ctDNA detection. Tumours that did not relapse before death or the development of a new primary cancer are treated as no recurrence (No rec). f. Kaplan–Meier curves of disease-free survival, split by the positivity of STAS and pre-operative ctDNA detection. Hazard ratios were adjusted for age, stage, pack-years, surgery type, and adjuvant therapy. The number of patients in each group for every time point is indicated below the time point. g. Summary of the findings related to high-grade patterns, pathologic and genomic features, and relapse site. Factors with prognostic impact investigated in the study are highlighted in bold.

Comment in

References

    1. Nicholson AG, et al. The 2021 WHO Classification of Lung Tumors: Impact of Advances Since 2015. J Thorac Oncol. 2022;17:362–387. - PubMed
    1. Chang JC, et al. Comprehensive Molecular and Clinicopathologic Analysis of 200 Pulmonary Invasive Mucinous Adenocarcinomas Identifies Distinct Characteristics of Molecular Subtypes. Clin Cancer Res. 2021;27:4066–4076. - PMC - PubMed
    1. Kadota K, et al. Tumor Spread through Air Spaces is an Important Pattern of Invasion and Impacts the Frequency and Location of Recurrences after Limited Resection for Small Stage I Lung Adenocarcinomas. J Thorac Oncol. 2015;10:806–814. - PMC - PubMed
    1. AbdulJabbar K, et al. Geospatial immune variability illuminates differential evolution of lung adenocarcinoma. Nat Med. 2020;26:1054–1062. - PMC - PubMed
    1. Moreira AL, et al. A Grading System for Invasive Pulmonary Adenocarcinoma: A Proposal From the International Association for the Study of Lung Cancer Pathology Committee. J Thorac Oncol. 2020;15:1599–1610. - PMC - PubMed

Publication types