

Body composition and lung cancer-associated cachexia in TRACERx
- PMID: 37045997
- PMCID: PMC7614477
- DOI: 10.1038/s41591-023-02232-8
Body composition and lung cancer-associated cachexia in TRACERx
Abstract
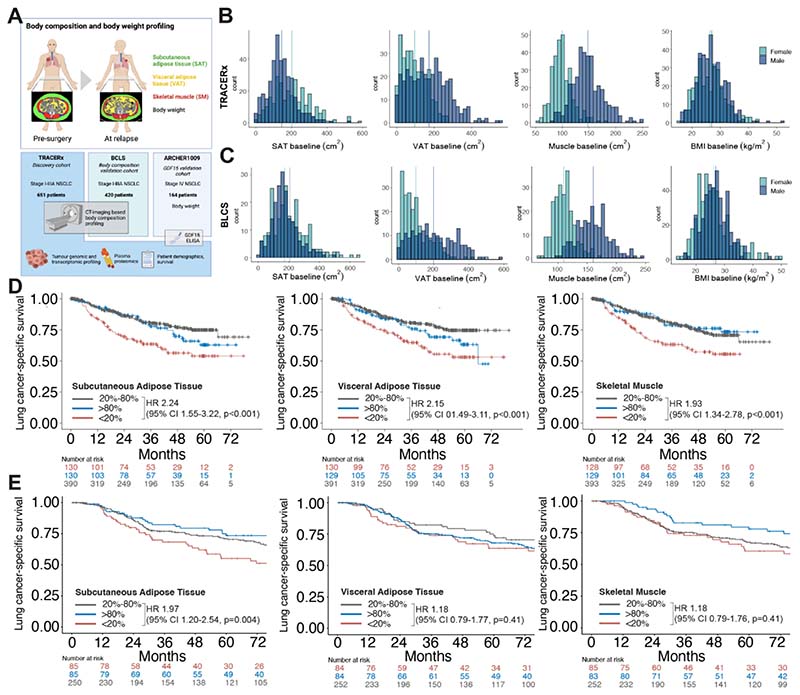
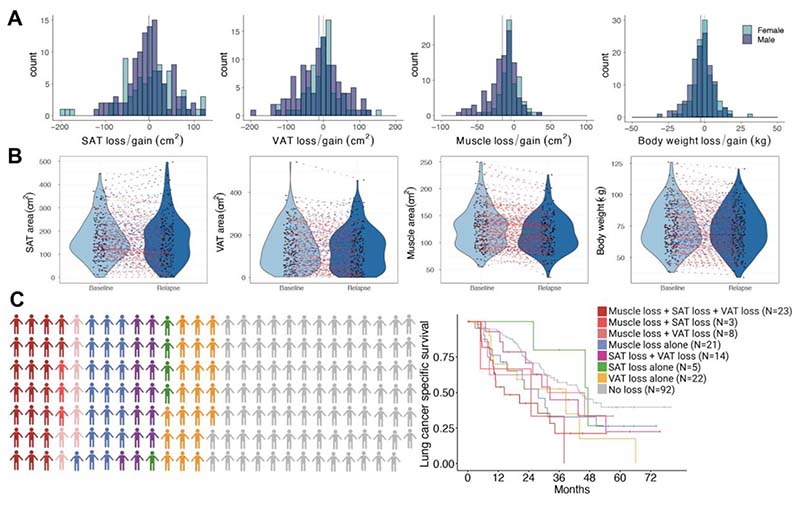
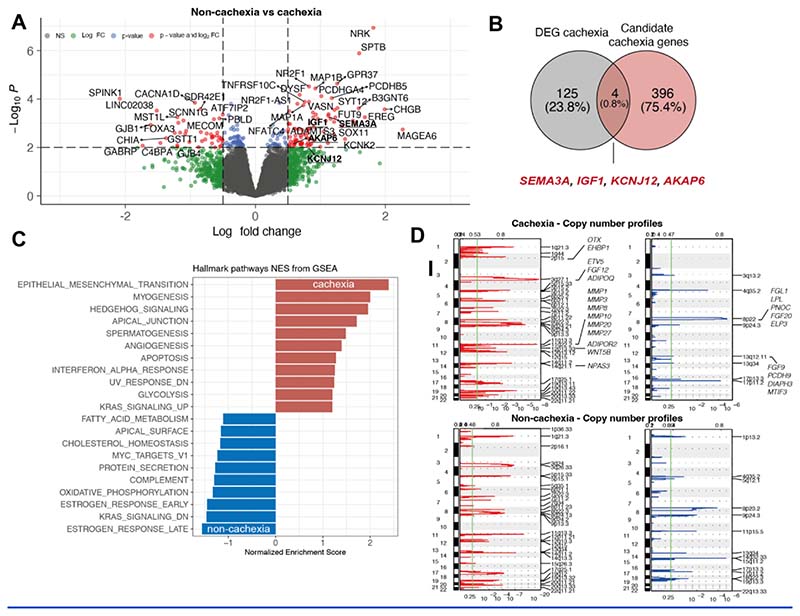
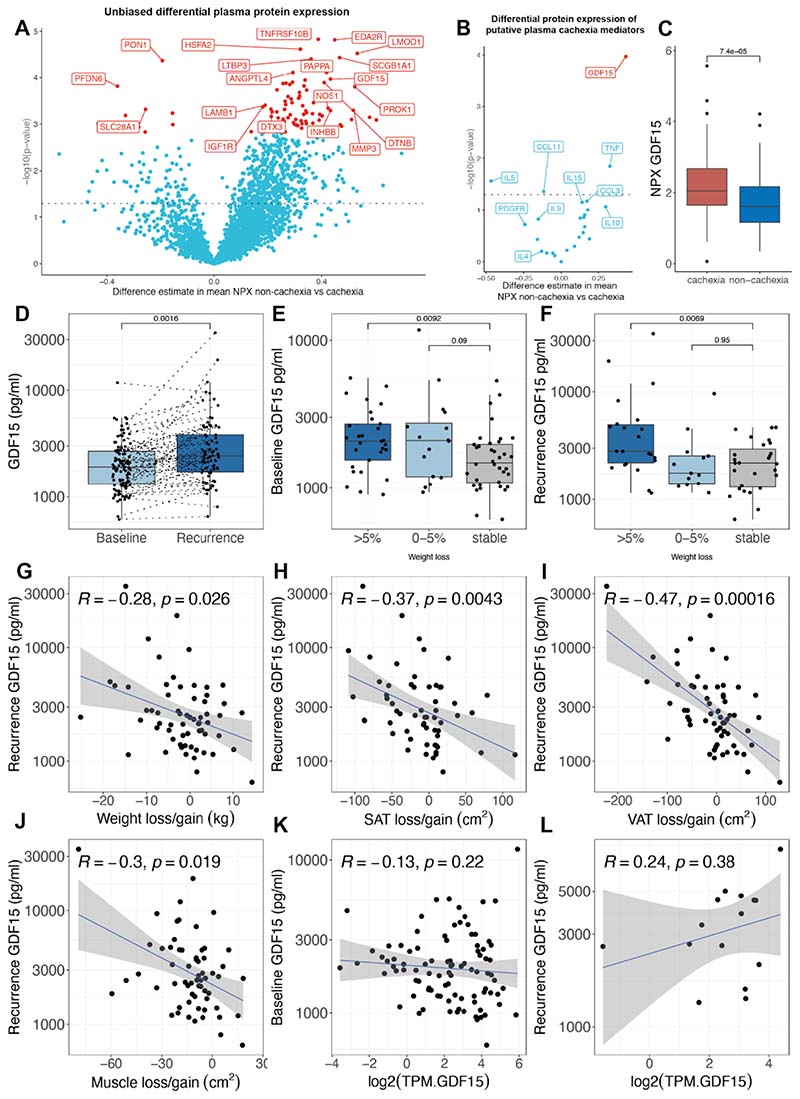
Cancer-associated cachexia (CAC) is a major contributor to morbidity and mortality in individuals with non-small cell lung cancer. Key features of CAC include alterations in body composition and body weight. Here, we explore the association between body composition and body weight with survival and delineate potential biological processes and mediators that contribute to the development of CAC. Computed tomography-based body composition analysis of 651 individuals in the TRACERx (TRAcking non-small cell lung Cancer Evolution through therapy (Rx)) study suggested that individuals in the bottom 20th percentile of the distribution of skeletal muscle or adipose tissue area at the time of lung cancer diagnosis, had significantly shorter lung cancer-specific survival and overall survival. This finding was validated in 420 individuals in the independent Boston Lung Cancer Study. Individuals classified as having developed CAC according to one or more features at relapse encompassing loss of adipose or muscle tissue, or body mass index-adjusted weight loss were found to have distinct tumor genomic and transcriptomic profiles compared with individuals who did not develop such features. Primary non-small cell lung cancers from individuals who developed CAC were characterized by enrichment of inflammatory signaling and epithelial-mesenchymal transitional pathways, and differentially expressed genes upregulated in these tumors included cancer-testis antigen MAGEA6 and matrix metalloproteinases, such as ADAMTS3. In an exploratory proteomic analysis of circulating putative mediators of cachexia performed in a subset of 110 individuals from TRACERx, a significant association between circulating GDF15 and loss of body weight, skeletal muscle and adipose tissue was identified at relapse, supporting the potential therapeutic relevance of targeting GDF15 in the management of CAC.
© 2023. The Author(s) under exclusive license to Springer Nature America, Inc.
Figures
References
-
- Martin L, et al. Cancer cachexia in the age of obesity: skeletal muscle depletion is a powerful prognostic factor, independent of body mass index. Journal of clinical oncology : official journal of the American Society of Clinical Oncology. 2013;31:1539–1547. - PubMed
-
- Calle EE, Rodriguez C, Walker-Thurmond K, Thun MJ. Overweight, obesity, and mortality from cancer in a prospectively studied cohort of U.S. adults. The New England journal of medicine. 2003;348:1625–1638. - PubMed
-
- Lavie CJ, McAuley PA, Church TS, Milani RV, Blair SN. Obesity and cardiovascular diseases: implications regarding fitness, fatness, and severity in the obesity paradox. J Am Coll Cardiol. 2014;63:1345–1354. - PubMed
-
- Baracos VE, Martin L, Korc M, Guttridge DC, Fearon KCH. Cancer-associated cachexia. Nature Reviews Disease Primers. 2018;4:17105 - PubMed
Publication types
MeSH terms
Substances
Grants and funding
- MC_UU_12012/1/MRC_/Medical Research Council/United Kingdom
- CTRNBC-2022/100001/CRUK_/Cancer Research UK/United Kingdom
- 24956/CRUK_/Cancer Research UK/United Kingdom
- MC_UU_00014/5/MRC_/Medical Research Council/United Kingdom
- 30025/CRUK_/Cancer Research UK/United Kingdom
- CC2041/WT_/Wellcome Trust/United Kingdom
- MC_UU_00014/1/MRC_/Medical Research Council/United Kingdom
- FC001169/WT_/Wellcome Trust/United Kingdom
- MR/V033077/1/MRC_/Medical Research Council/United Kingdom
- 29569/CRUK_/Cancer Research UK/United Kingdom
- R35 CA197449/CA/NCI NIH HHS/United States
- 21999/CRUK_/Cancer Research UK/United Kingdom
- 25349/CRUK_/Cancer Research UK/United Kingdom
- 17786/CRUK_/Cancer Research UK/United Kingdom
LinkOut - more resources
Full Text Sources
Other Literature Sources
Medical
