. 2023 Apr;616(7958):755-763.
doi: 10.1038/s41586-023-05806-1. Epub 2023 Apr 12.

Aberrant activation of TCL1A promotes stem cell expansion in clonal haematopoiesis

Joshua S Weinstock #  1 Jayakrishnan Gopakumar #  2 Bala Bharathi Burugula  3 Md Mesbah Uddin  4 Nikolaus Jahn  2 Julia A Belk  2 Hind Bouzid  2 Bence Daniel  2 Zhuang Miao  5 Nghi Ly  2 Taralynn M Mack  6 Sofia E Luna  7 Katherine P Prothro  8 Shaneice R Mitchell  2 Cecelia A Laurie  9   10 Jai G Broome  9   10   11 Kent D Taylor  12   13 Xiuqing Guo  12   14 Moritz F Sinner  15   16 Aenne S von Falkenhausen  15   16 Stefan Kääb  15   16 Alan R Shuldiner  17 Jeffrey R O'Connell  17 Joshua P Lewis  17   18 Eric Boerwinkle  19   20 Kathleen C Barnes  21   22 Nathalie Chami  23   24 Eimear E Kenny  25   26 Ruth J F Loos  23   24   27 Myriam Fornage  20   28 Lifang Hou  29 Donald M Lloyd-Jones  29 Susan Redline  30   31 Brian E Cade  4   30   31   32 Bruce M Psaty  10   33   34   35 Joshua C Bis  33 Jennifer A Brody  10   33 Edwin K Silverman  32   36 Jeong H Yun  36 Dandi Qiao  32   36 Nicholette D Palmer  37   38 Barry I Freedman  39 Donald W Bowden  37   38 Michael H Cho  32   40 Dawn L DeMeo  32   40 Ramachandran S Vasan  41 Lisa R Yanek  42   43 Lewis C Becker  42   43 Sharon L R Kardia  44   45 Patricia A Peyser  44   45 Jiang He  46   47 Michiel Rienstra  48 Pim Van der Harst  48 Robert Kaplan  49   50 Susan R Heckbert  34   51 Nicholas L Smith  34   51   52   53 Kerri L Wiggins  33 Donna K Arnett  54   55 Marguerite R Irvin  56 Hemant Tiwari  57 Michael J Cutler  58 Stacey Knight  58 J Brent Muhlestein  58 Adolfo Correa  59   60 Laura M Raffield  61 Yan Gao  62   63 Mariza de Andrade  64 Jerome I Rotter  12   65 Stephen S Rich  66   67 Russell P Tracy  68   69 Barbara A Konkle  70   71 Jill M Johnsen  70   72 Marsha M Wheeler  73 J Gustav Smith  70   74   75   76 Olle Melander  77 Peter M Nilsson  77 Brian S Custer  78 Ravindranath Duggirala  79   80 Joanne E Curran  79   80   81 John Blangero  79   80 Stephen McGarvey  82   83 L Keoki Williams  84   85 Shujie Xiao  84 Mao Yang  84 C Charles Gu  86   87 Yii-Der Ida Chen  12   14 Wen-Jane Lee  88   89 Gregory M Marcus  90 John P Kane  91 Clive R Pullinger  92 M Benjamin Shoemaker  93   94 Dawood Darbar  95   96 Dan M Roden  97 Christine Albert  98   99 Charles Kooperberg  100   101 Ying Zhou  100 JoAnn E Manson  32   102 Pinkal Desai  103   104 Andrew D Johnson  105   106   107 Rasika A Mathias  42   43 NHLBI Trans-Omics for Precision Medicine (TOPMed) ConsortiumThomas W Blackwell  1 Goncalo R Abecasis  1   108 Albert V Smith  1 Hyun M Kang  1 Ansuman T Satpathy  2 Pradeep Natarajan  4   53   109   110 Jacob O Kitzman  3 Eric A Whitsel  111 Alexander P Reiner  53   100   112 Alexander G Bick  113 Siddhartha Jaiswal  114   115
Collaborators, Affiliations

Aberrant activation of TCL1A promotes stem cell expansion in clonal haematopoiesis

Joshua S Weinstock et al. Nature. 2023 Apr.

Abstract

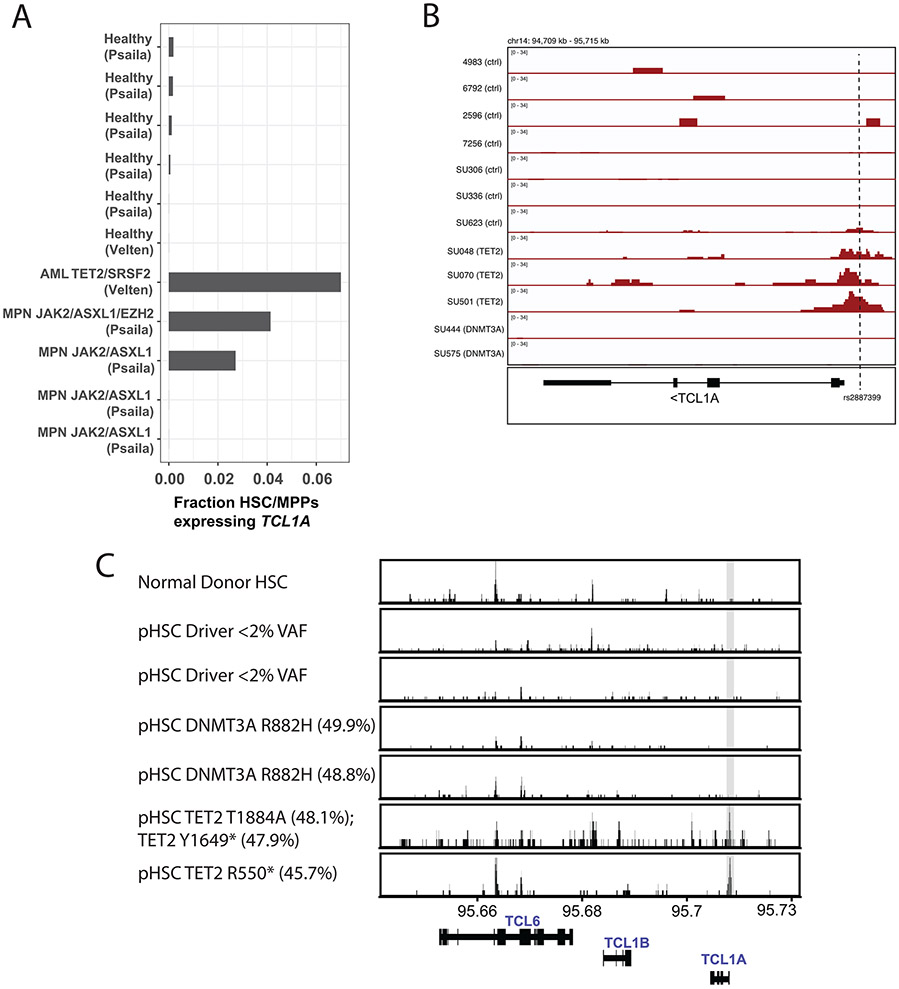
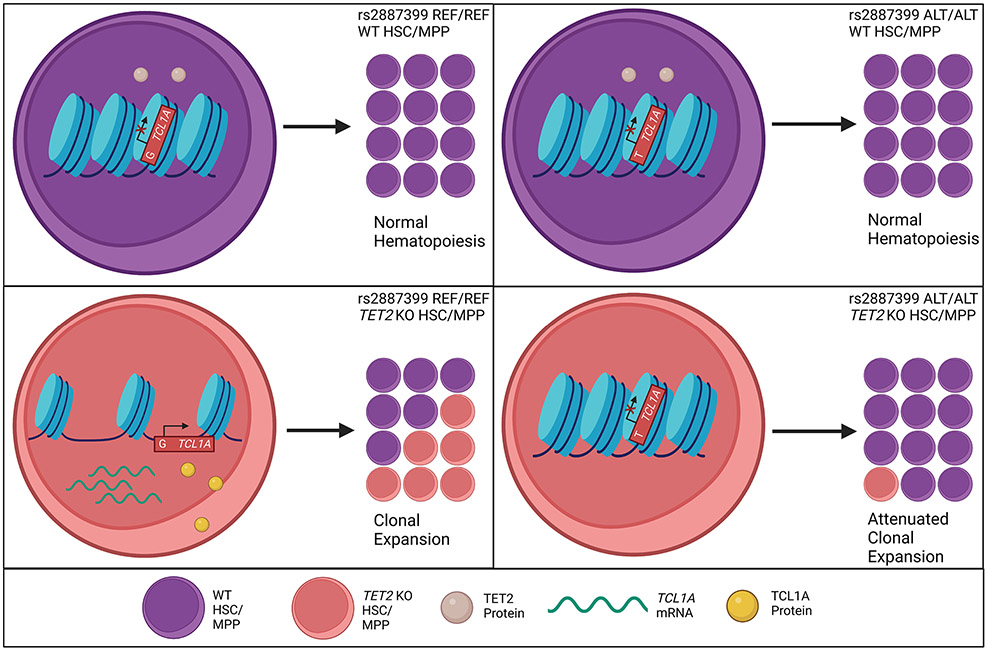
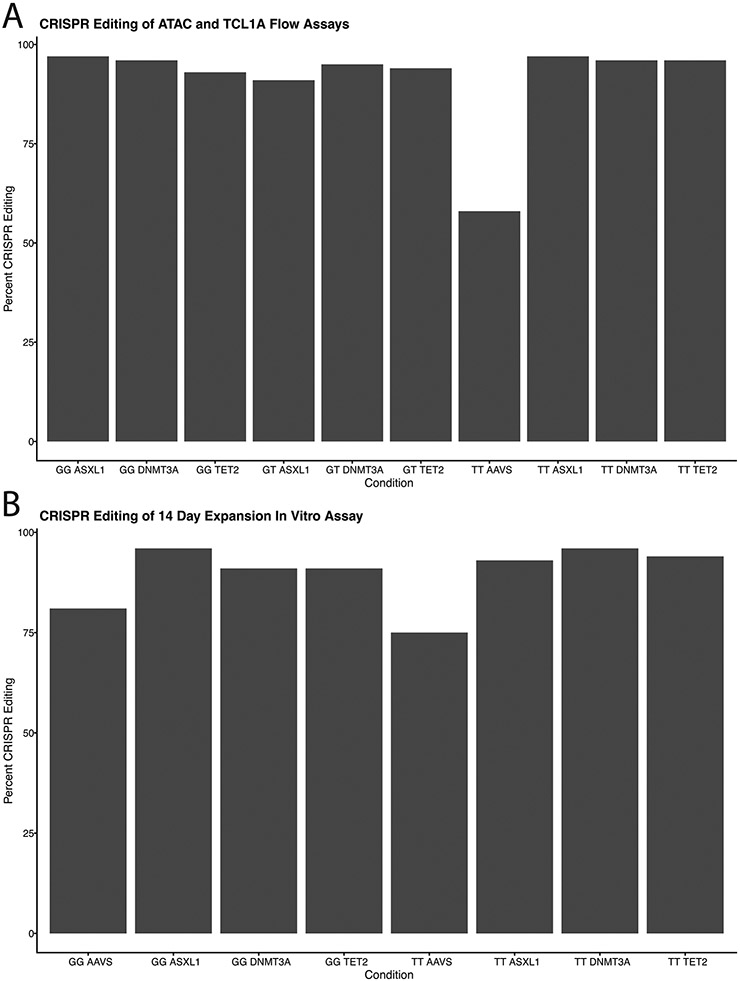
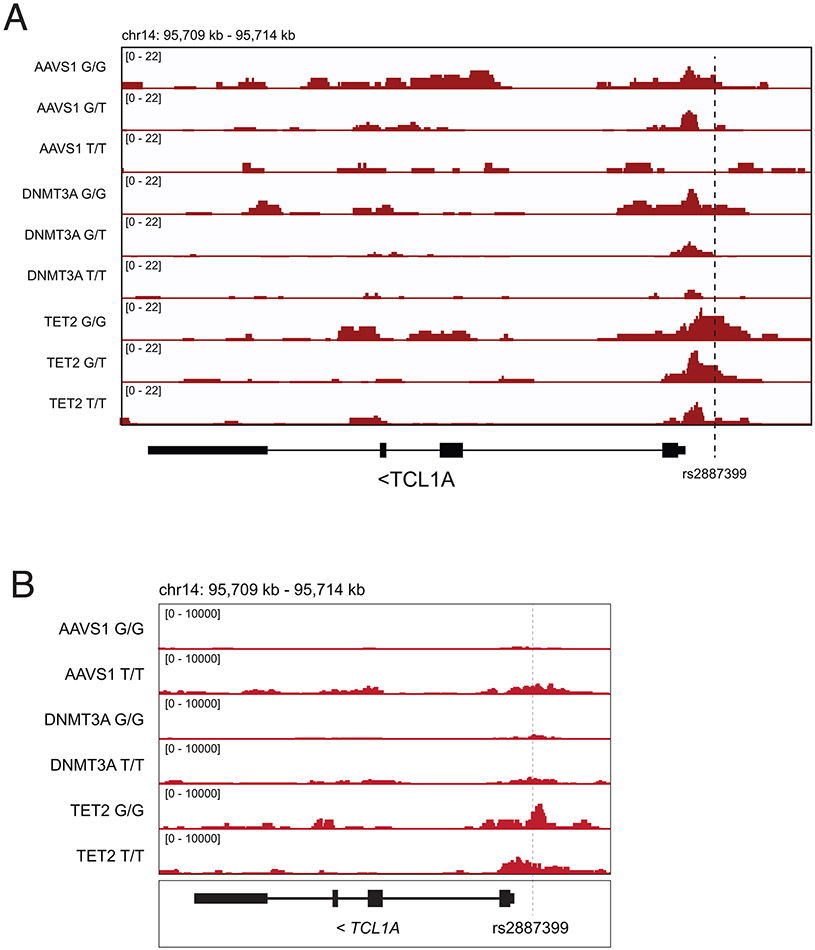
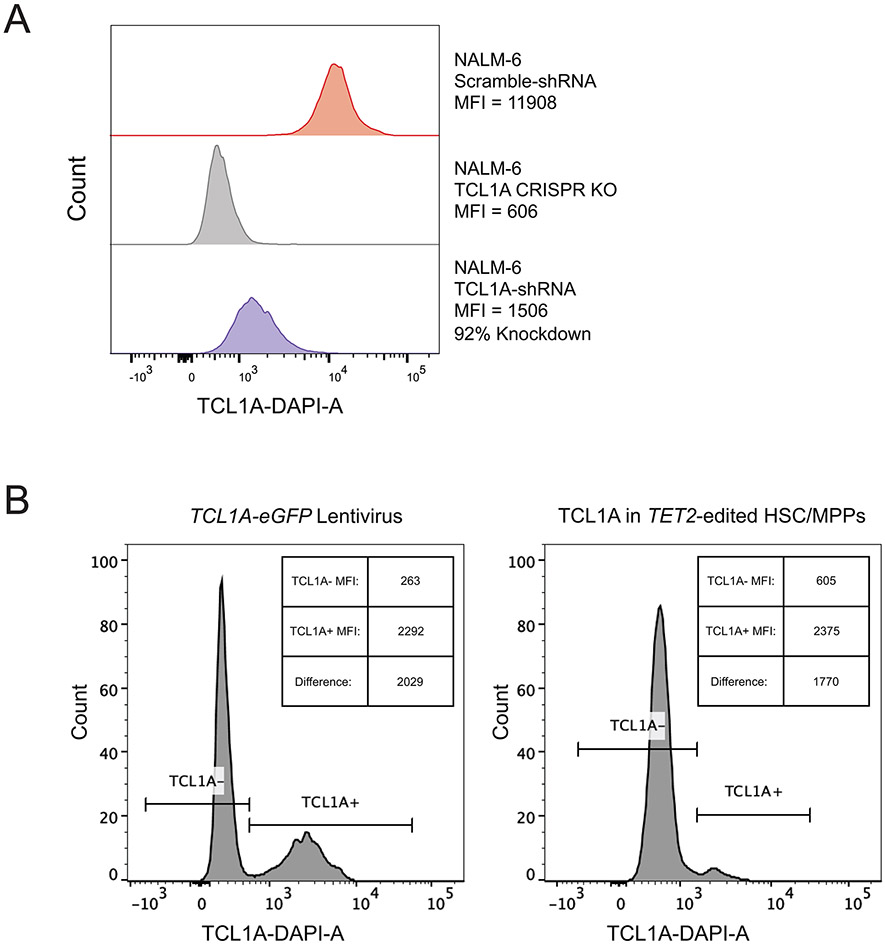
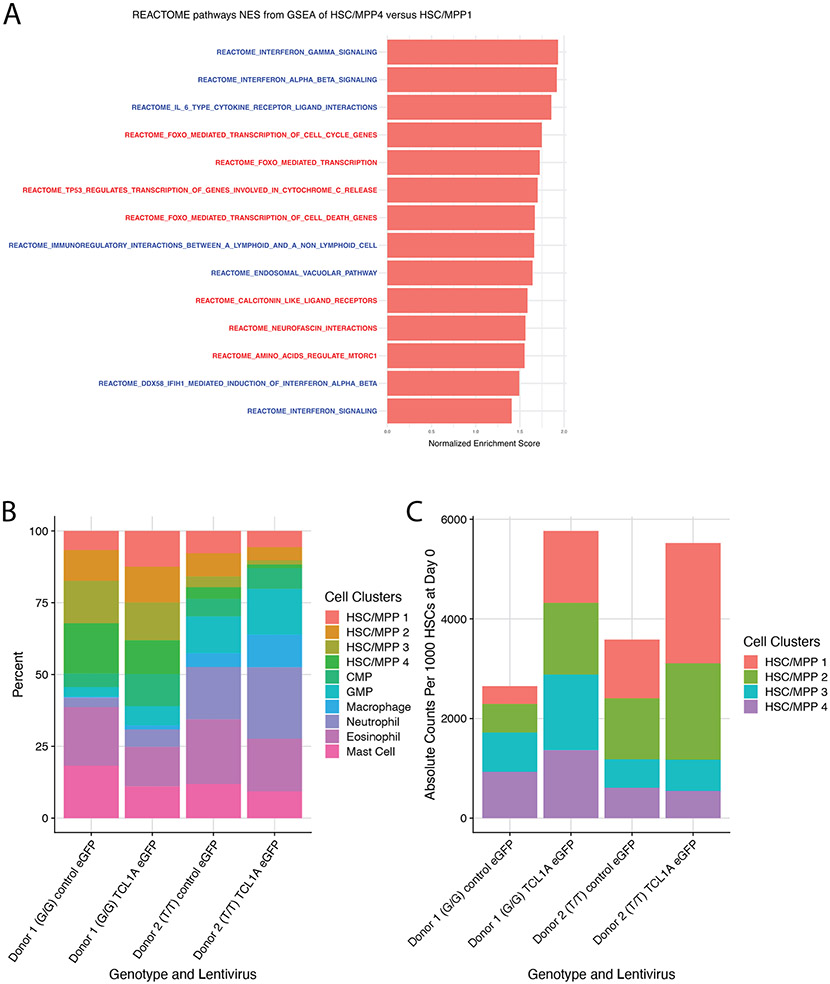
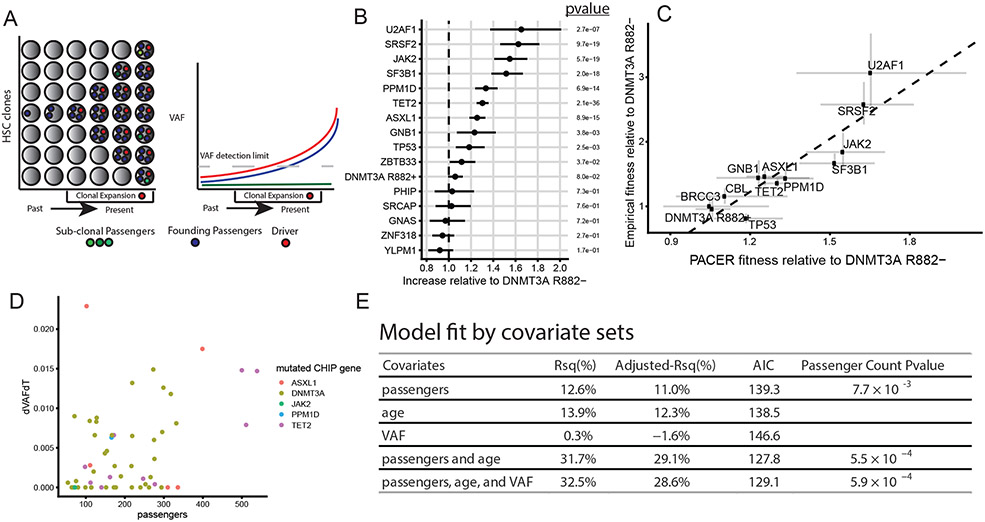
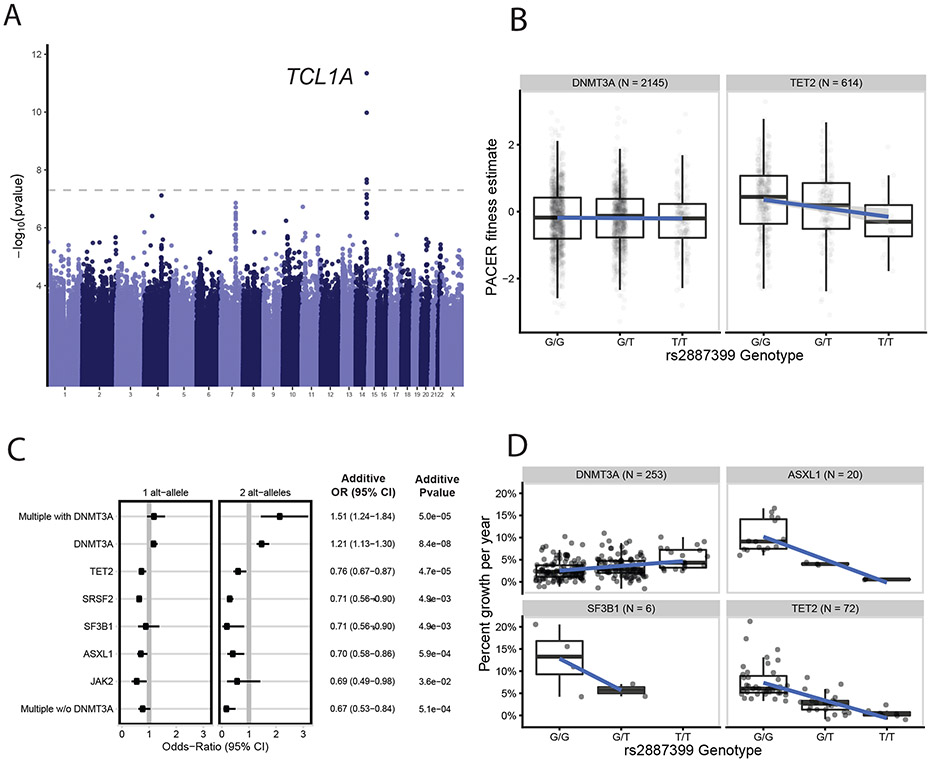
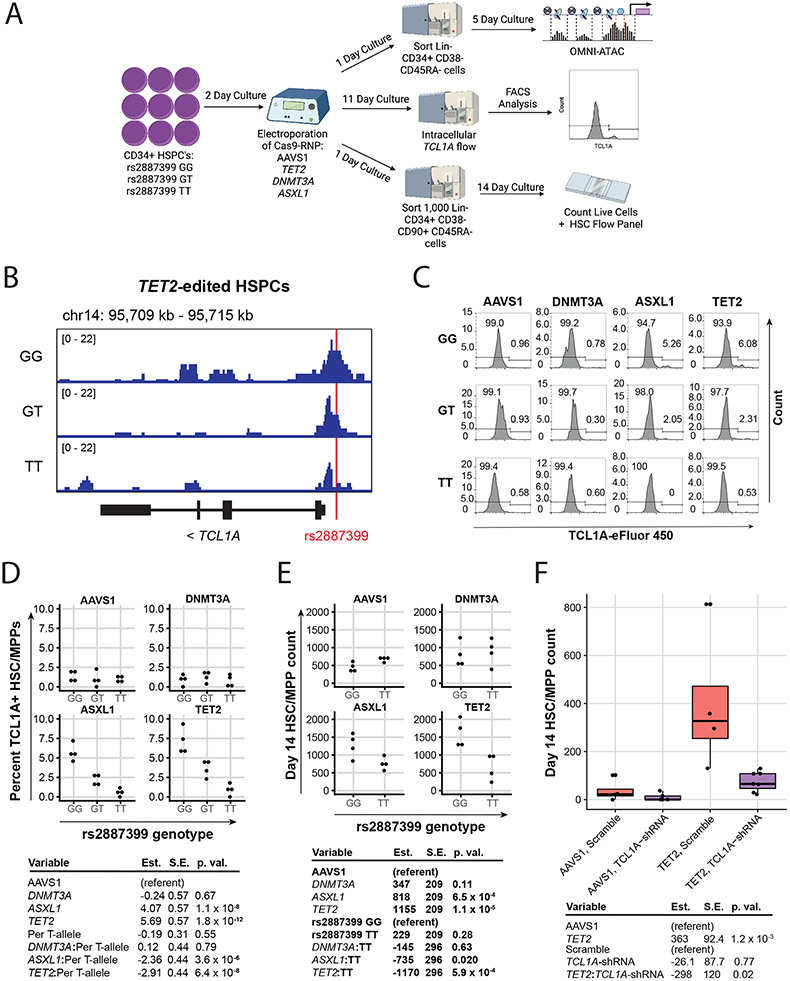
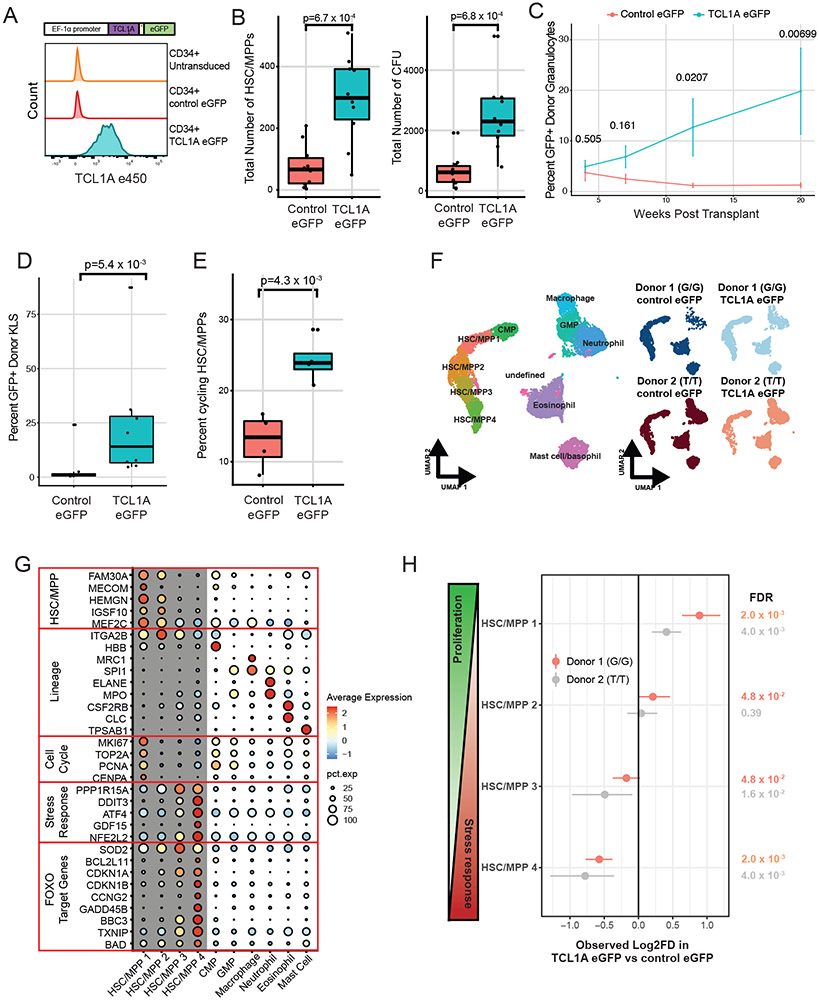
Mutations in a diverse set of driver genes increase the fitness of haematopoietic stem cells (HSCs), leading to clonal haematopoiesis1. These lesions are precursors for blood cancers2-6, but the basis of their fitness advantage remains largely unknown, partly owing to a paucity of large cohorts in which the clonal expansion rate has been assessed by longitudinal sampling. Here, to circumvent this limitation, we developed a method to infer the expansion rate from data from a single time point. We applied this method to 5,071 people with clonal haematopoiesis. A genome-wide association study revealed that a common inherited polymorphism in the TCL1A promoter was associated with a slower expansion rate in clonal haematopoiesis overall, but the effect varied by driver gene. Those carrying this protective allele exhibited markedly reduced growth rates or prevalence of clones with driver mutations in TET2, ASXL1, SF3B1 and SRSF2, but this effect was not seen in clones with driver mutations in DNMT3A. TCL1A was not expressed in normal or DNMT3A-mutated HSCs, but the introduction of mutations in TET2 or ASXL1 led to the expression of TCL1A protein and the expansion of HSCs in vitro. The protective allele restricted TCL1A expression and expansion of mutant HSCs, as did experimental knockdown of TCL1A expression. Forced expression of TCL1A promoted the expansion of human HSCs in vitro and mouse HSCs in vivo. Our results indicate that the fitness advantage of several commonly mutated driver genes in clonal haematopoiesis may be mediated by TCL1A activation.


Figures

Extended Data Fig 1∣
Extended Data Fig 1∣. PACER Estimates Clonal Expansion Rate
A. The passenger counts are enriched by 54% (95% CI: 51%-57%) after adjusting for age and study using a negative binomial regression. The different colors in the density plots correspond to quartiles of the marginal probability distributions. As the density estimates are smoothed, the underlying data points are indicated with hash marks. B. The distributions of passenger counts are stratified by the number of CHIP driver variants acquired. The different colors in the density plots correspond to quartiles of the marginal probability distributions. C. The observed clonal expansion rates (dVAFdT), as expressed in the change in variant allele frequency (VAF) over time (years), were associated with increased PACER fitness estimates in 55 CHIP carriers from the Women’s Health Initiative. The PACER fitness estimates have been inverse normal transformed. D. The posterior inclusion probabilities (PIP) as estimated by SuSIE are plotted on the y-axis, and the genomic position of a 0.8 Mb region including TCL1A is plotted on the x-axis. The linkage disequilibrium (LD) estimates are plotted on a color scale and are estimated on the genotypes used for association analyses. E. Rare variant analyses were performed using the SCANG rare variant scan procedure including all variants with a minor allele count less than 300. Identified rare variant windows are plotted as gray rectangles where the width corresponds to the size of the genomic region and the height corresponds to the pvalue of the SCANG test statistic for the window. F. Rare variant analyses were performed including the rs2887399 genotypes as covariate. Hypothesis testing was performed using the SCANG rare variant scan procedure. G. Multiz alignments across multiple species are shown for the TCL1A locus.
Extended Data Fig 2∣
Extended Data Fig 2∣. GWAS Implicates rs2887399 as a Modifier of Clonal Expansion Rate
A. The distributions of the four conditions – DNMT3A and TET2 mutant clones stratified by homozygous genotype of rs2887399. The y-axis indicates the density of the distributions and the x-axis indicates the log10 founding censored passengers, which are the simulated equivalent to the singleton mutations observed in the real data analysis. Simulated DNMT3A mutations out-compete TET2 when rs2887399 is set to the protective T/T allele even though its fitness is unchanged by rs2887399. B. The top panel includes the -log10 pvalues from both the PACER GWAS and TCL1A cis-eQTLs in whole blood from GTEx v8. The GWAS p-values are estimated with SAIGE. In the bottom panel, posterior probability of colocalization from COLOC identifies rs2887399 as the likely shared causal variant. C. UMAP plot of scRNA-seq data from immune cells in the Human Cell Atlas. TCL1A expression is highlighted on the bottom plot. UMAP plot was generated in the EMBL-EBI Single Cell Expression Atlas.
Extended Data Fig 3∣
Extended Data Fig 3∣. Chromatin Accessibility and Transcript Expression of TCL1A
A. Quantification of fraction of HSC/MPPs expressing TCL1A transcripts in patients with TET2 or ASXL1 driven acute myeloid leukemia (AML) or myeloproliferative neoplasm (MPN) compared to healthy donors. Data is from single-cell RNA sequencing generated in Psaila et al. and Velten et al. B. ATAC-sequencing tracks of the TCL1A locus near rs2887399 in HSCs from healthy donors (row 1-4), pre-leukemic hematopoietic stem cells (pHSCs) from patients with AML but no detected driver mutations (rows 5-7), in pHSCs with TET2 mutations (rows 8-10), and pHSCs with DNMT3A mutations (rows 11-12). Data is from Corces et al. Vertical dashed line indicates location of the rs2887399 SNP. C. ATAC-sequencing tracks of the TCL6-TCL1A locus in HSCs from healthy donors (row 1), pre-leukemic hematopoietic stem cells (pHSCs) from patients with AML but no detected driver mutations (rows 2-3), pHSCs with DNMT3A mutations (rows 4-5), and in pHSCs with TET2 mutations (rows 6-7). Amino acid change and variant allele fraction (VAF) for the driver mutations are shown. Data is from Corces et al.
Extended Data Fig 4∣
Extended Data Fig 4∣. Schematic of rs2887399 Effect on TET2 Clonal Expansion
Proposed model for clonal advantage due to mutations in TET2. In cells with the rs2887399 REF/REF genotype, loss of TET2 function leads to an accessible TCL1A locus, aberrant TCL1A RNA and protein expression in hematopoietic stem cells (HSC's) and multi-potent progenitors (MPP's), and subsequent clonal expansion. The presence of rs2887399 ALT alleles diminishes the TET2 clonal expansion phenotype by limiting TCL1A locus accessibility and downstream protein expression. Figure created with BioRender under a paid license.
Extended Data Fig 5∣
Extended Data Fig 5∣. CRISPR Editing Efficiency
A. ICE analysis of Sanger traces to determine targeted CRISPR editing efficiency. Bar plots display percent of CD34+ CD38− CD45RA− cells with indel formation in gene of interest. These cells were used for the OMNI-ATAC and intracellular TCL1A flow assays. B. ICE analysis of Sanger traces to determine targeted CRISPR editing efficiency. Bar plots display percent of CD34+ CD38− CD45RA− cells with indel formation in gene of interest. These cells were used for the 14-day expansion assay.
Extended Data Fig 6∣
Extended Data Fig 6∣. ATAC Sequencing Tracks of TCL1A
A. ATAC-sequencing tracks illustrating chromatin accessibility at rs2887399 in TET2 or DNMT3A-edited HSC/MPPs cultured for 5 days from donors of the GG, GT, and TT genotypes. Red line indicates location of rs2887399. TET2 edited samples are the same as in Figure 4, shown here for comparison. B. ATAC-sequencing tracks illustrating chromatin accessibility at rs2887399 in AAVS, TET2 or DNMT3A-edited HSC/MPPs cultured for 7 days from donors of the GG and TT genotypes, and then sorted for CD34hi CD38− CD45RA− Lin− cells prior to nuclei preparation. Red line indicates location of rs2887399.
Extended Data Fig 7∣
Extended Data Fig 7∣. Interaction of CHIP Mutations and rs2887399 in human HSPC phenotypes
A. Representative intracellular flow plots of TCL1A protein expression in edited HSC/MPPs from each rs2887399 donor after 11 days in culture. B. Quantification of Lin−/lo CD34+ CD38− CD45RAlo HSPCs (CD45RAlo HSPCs) after 14 days of in vitro expansion stratified by edited gene and rs2887399 genotype. Results of a linear regression model for the effect of edited gene (referent to AAVS1), rs2887399 genotype (referent to GG), and the interaction term of edited gene with rs2887399 genotype are presented below. Unadjusted p-values from two-sided tests are reported. n=4 for each group. C. Ratio of CD34+CD45RA− cells to CD34− cells after 14 days of in vitro expansion stratified by edited gene and rs2887399 genotype. Results of a linear regression model for the effect of edited gene (referent to AAVS1), rs2887399 genotype (referent to GG), and the interaction term of edited gene with rs2887399 genotype are presented below. The horizontal line in each box indicates the median, the tops and bottoms of the boxes indicate the interquartile range, and the top and bottom error bars indicate maxima and minima, respectively. Unadjusted p-values from two-sided tests are reported. n=4 for each group.
Extended Data Fig 8∣
Extended Data Fig 8∣. Validation of TCL1A shRNA and Expression Lentivirus
A. Histogram of TCL1A-DAPI in wild-type, TCL1A CRISPR knockout, and TCL1A shRNA knockdown in NALM-6 cell line. B. Histogram of TCL1A-DAPI in human HSC/MPPs transduced with TCL1A-eGFP lentivirus or TET2-edited HSC/MPPs. MFI = geometric mean fluorescence intensity.
Extended Data Fig 9∣
Extended Data Fig 9∣. TCL1A Expression Promotes HSC Fitness in Mice
A. Post-hoc analysis of percent GFP+ cells in the lineage negative fraction of the input cell mixture used for transplant. B. GFP+ chimerism over 20 weeks post-transplant as a fraction of total donor white blood cells. Shown are mean percent GFP+ cells and error bars represent standard errors for each time point. Hypothesis testing was performed with a two-sided Wilcoxon rank sum test and unadjusted p-values are shown above each timepoint. n=8 for each group. C. Percent GFP+ cells in donor HSC/MPP subsets at 22 weeks post-transplant. The horizontal line in each box indicates the median, the tops and bottoms of the boxes indicate the interquartile range, and the top and bottom error bars indicate maxima and minima, respectively. Unadjusted p-values obtained from two-sided Wilcoxon rank sum tests are reported. n=8 for each group.
Extended Data Fig 10∣
Extended Data Fig 10∣. CITE-seq of TCL1A Expressing Human HSPCs
A. UMAP feature plots of Antibody Derived Tags (ADTs) for cell surface markers for HSPC identification. B. UMAP clustering of HSC/MPP populations colored by cell subtype clusters next to UMAP clustering of HSC/MPP populations colored by Monocle Pseudotime values. C. Stacked bar plot of percent of cells in each cell cycle phase as determined by Seurat cell cycle scoring module for each cell cluster. D. UMAP feature plot of select stress response and FOXO target genes.
Extended Data Fig 11∣
Extended Data Fig 11∣. Effect of TCL1A Expression on Human HSC/MPP Phenotypes
A. Normalized enrichment scores (NES) of REACTOME pathways upregulated in HSC/MPP cluster 4 compared to HSC/MPP cluster 1 and filtered for those with FDR<0.1 and NES>1. Pathways printed in blue contain interferon response genes and pathways printed in red contain FOXO response genes. B. Stacked bar plot of all clusters in each analyzed sample dataset as a percentage of total cells in that sample. G/G or T/T refers to the genotype at rs2887399 in the donor. C. Stacked bar plot of absolute counts for each HSC/MPP cluster from each sample. Counts are shown as number of output cells at Day 7 per 1000 HSC/MPPs plated at Day 0.
Fig 1∣
Fig 1∣. PACER Enables Estimation of Clonal Expansion Rate from a Single Blood Draw
A, A schematic depiction of using passenger counts to estimate the rate of expansion of a hematopoietic stem cell (HSC) clone after the acquisition of a driver mutation. The passengers (blue) that precede the driver (red) can be used to date the acquisition of the driver. B, The relative abundances of passenger counts were estimated for CHIP driver genes with at least 30 cases using a negative binomial regression, adjusting for age at blood draw, driver VAF, and study. The total number of CHIP carriers included is 4,536. The coefficients are relative to DNMT3A R882- CHIP. Unadjusted, two-sided p-values are reported. Error bars indicate 95 percent confidence intervals. C, The relative abundances of passenger counts are plotted against the empirical estimates of gene fitness derived from the longitudinal deep sequencing in Fabre et al.. Error bars indicate 95 percent confidence intervals. The estimate of the association from weighted least squares (slope = 2.7, p-value = 9.6 x 10⁻⁵, R2 = 80%) is plotted as a dashed line. D, The observed clonal expansion rates (dVAFdT), as expressed in the change in variant allele frequency (VAF) over time (years), were associated with increased passenger counts in 55 CHIP carriers from the Women’s Health Initiative. Colors indicate the mutated driver gene. E, A multivariable model including passenger counts, age at blood draw, and VAF indicates the relative contributions of age and VAF over baseline models. AIC is Akaike information criteria, where smaller values indicate better model fit. Unadjusted, two-sided p-values are reported for the passengers variable in the respective models.
Fig 2∣
Fig 2∣. GWAS of PACER Identifies Germline Determinants of Clonal Expansion in Blood
A, A genome-wide association study (GWAS) of passenger counts identifies TCL1A as a genome-wide significant locus. Test statistics were estimated with SAIGE. B, The association between the genotypes of rs2887399 and PACER varied between TET2 and DNMT3A. Alt-alleles were associated with decreased PACER score in TET2 mutation carriers, but no association was observed in DNMT3A carriers. C, The association between alt-alleles at rs2887399 and presence of specific CHIP mutations varies by CHIP mutations (n = 5,071 CHIP carriers). Forest plot shows the odds ratios for having specific mutations in those carrying a single T-allele and two T-alleles, respectively. Odds ratios were estimated using Firth logistic regression, with error bars representing 95 percent confidence intervals. On the right of the forest plot, effect estimates and p-values are included from SAIGE, which uses an additive coding of the alt-alleles for hypothesis testing and uses a generalized linear mixed model to estimate test statistics. Unadjusted, two-sided p-values are reported. In the additive tests, SF3B1 and SRSF2 were grouped together to aid convergence. D, The association between the genotypes of rs2887399 and percent growth per year of CHIP clones from 351 carriers in the Women’s Health Initiative. Percent growth per year is estimated using a Bayesian logistic growth model of clonal expansion. For box and whisker plots in 2b and 2d, the horizontal line indicates the median, the tops and bottoms of the boxes indicate the interquartile range, and top and bottom error bars indicate maxima and minima, respectively.
Figure 3∣
Figure 3∣. Effect of rs2887399 on TCL1A Expression and Clonal Expansion
A, Schematic of experimental workflow. B, ATAC-sequencing tracks illustrating chromatin accessibility at rs2887399 in TET2-edited HSPCs from donors of the GG, GT, and TT genotypes after 5 days liquid culture. Red line indicates location of rs2887399. See also Extended Data Figure 8 and Table S14. C, Percent Lin− CD34+ CD38− CD45RA− cells expressing TCL1A by flow cytometry after 11 days liquid culture of edited HSPCs, stratified by edited gene and rs2887399 genotype. Results of a linear regression model for the effect of edited gene (referent to AAVS1), number of T-alleles at rs2887399, and the interaction term of edited gene with T-alleles are presented below. Est. = estimate, S.E. = standard error, p. val. = p-value. Unadjusted p-values from a two-sided test are reported. n=4 biologically independent replicates for each group. D, Lin− CD34+ CD38− CD45RA− cell counts after 14 days liquid culture of edited HSCs. Results of a linear regression model for the effect of edited gene (referent to AAVS1), rs2887399 genotype (referent to GG), and the interaction term of edited gene with rs2887399 genotype are presented below. Unadjusted p-values from a two-sided test are reported. n=4 biologically independent replicates for each group. E, Lin− CD34+ CD38− CD45RA− cell counts after 14 days liquid culture of edited and shRNA transduced HSCs. Results of a linear regression model for the effect of edited gene (referent to AAVS1), shRNA (referent to scramble control), and the interaction term of edited gene with shRNA are presented below. Unadjusted p-values from a two-sided test are reported. The horizontal line in each box indicates the median, the tops and bottoms of the boxes indicate the interquartile range, and the top and bottom error bars indicate maxima and minima, respectively. n=4 for AAVS1 gRNA/scramble, n=5 for AAVS1 gRNA/TCL1A shRNA, n=4 for TET2 gRNA/scramble, and n=7 for TET2 gRNA/TCL1A shRNA, which represent biologically independent replicates.
Figure 4∣
Figure 4∣. TCL1A Expression is Sufficient for HSC Expansion
A, Schematic of TCL1A-eGFP lentivirus construct (top) and effect of viral transduction on TCL1A expression in human CD34+ HSPCs (bottom). B, Lin−CD34+CD38−CD45RA− cell counts after 14 days liquid culture of transduced HSCs (left), and quantification of colony forming units in methylcellulose after 14 days of liquid culture of transduced HSCs (right); p-values were estimated using a two-sided t-test. n=10 biologically independent replicates for each group. C, Donor granulocyte chimerism of mice transplanted with TCL1A-eGFP or control-eGFP transduced c-Kit+ marrow cells plus GFP− competitor marrow. Shown are mean percent GFP+ donor granulocytes and standard errors for each time point. Hypothesis testing was performed using two-sided Wilcoxon rank sum tests and p-values are indicated above each timepoint. n=8 mice for each group. D, Percent GFP+ donor cells in Lin− c-Kit+ Sca-1+ (KLS) marrow at 22 weeks post-transplant. P-value obtained from a two-sided Wilcoxon rank sum test. n=8 mice for each group. E, Percent Lin−CD34+CD38− cells in cycle by DAPI staining after 10 days liquid culture of transduced HSC/MPPs; p-values were calculated using a two-sided Wilcoxon rank sum test. n=4 biologically independent replicates for each group. F, UMAP of clusters identified after 7 days liquid culture of transduced HSC/MPPs; all samples combined (left) and split by the 4 individual samples (right). G/G or T/T refers to the donor rs2887399 genotype. G, Dot plot illustrating expression of representative marker genes across different cell clusters arranged by functional group. H, Forest plot of log2 fold-difference (Log2FD) in proportion of cells within each HSC/MPP cluster in TCL1A-eGFP versus control-eGFP transduced cells using a permutation test. Each donor represents an independent experiment and the false discovery rate (FDR) for each comparison is shown to the right. For box and whisker plots in 4b, 4d, and 4e, horizontal lines indicate the median, the tops and bottoms of the boxes indicate the interquartile range, and top and bottom error bars indicate maxima and minima, respectively.

Comment in

Similar articles

Cited by

  • Causes and consequences of clonal hematopoiesis.
    Weeks LD, Ebert BL. Weeks LD, et al. Blood. 2023 Dec 28;142(26):2235-2246. doi: 10.1182/blood.2023022222. Blood. 2023. PMID: 37931207 Free PMC article. Review.
  • Developmental hematopoietic stem cell variation explains clonal hematopoiesis later in life.
    Kreger J, Mooney JA, Shibata D, MacLean AL. Kreger J, et al. Nat Commun. 2024 Nov 26;15(1):10268. doi: 10.1038/s41467-024-54711-2. Nat Commun. 2024. PMID: 39592593 Free PMC article.
  • Driver mutation zygosity is a critical factor in predicting clonal hematopoiesis transformation risk.
    Kishtagari A, Khan MAW, Li Y, Vlasschaert C, Marneni N, Silver AJ, von Beck K, Spaulding T, Stockton S, Snider C, Sochacki A, Dorand D, Mack TM, Ferrell PB Jr, Xu Y, Bejan CA, Savona MR, Bick AG. Kishtagari A, et al. Blood Cancer J. 2024 Jan 15;14(1):6. doi: 10.1038/s41408-023-00974-9. Blood Cancer J. 2024. PMID: 38225345 Free PMC article.
  • Multiomic profiling identifies predictors of survival in African American patients with acute myeloid leukemia.
    Stiff A, Fornerod M, Kain BN, Nicolet D, Kelly BJ, Miller KE, Mrózek K, Boateng I, Bollas A, Garfinkle EAR, Momoh O, Fasola FA, Olawumi HO, Mencia-Trinchant N, Kloppers JF, van Marle AC, Hu E, Wijeratne S, Wheeler G, Walker CJ, Buss J, Heyrosa A, Desai H, Laganson A, Hamp E, Abu-Shihab Y, Abaza H, Kronen P, Sen S, Johnstone ME, Quinn K, Wronowski B, Hertlein E, Miles LA, Mims AS, Oakes CC, Blachly JS, Larkin KT, Mundy-Bosse B, Carroll AJ, Powell BL, Kolitz JE, Stone RM, Duarte C, Abbott D, Amaya ML, Jordan CT, Uy GL, Stock W, Archer KJ, Paskett ED, Guzman ML, Levine RL, Menghrajani K, Chakravarty D, Berger MF, Bottomly D, McWeeney SK, Tyner JW, Byrd JC, Salomonis N, Grimes HL, Mardis ER, Eisfeld AK. Stiff A, et al. Nat Genet. 2024 Nov;56(11):2434-2446. doi: 10.1038/s41588-024-01929-x. Epub 2024 Oct 4. Nat Genet. 2024. PMID: 39367245 Free PMC article.
  • Evolution of myeloproliferative neoplasms from normal blood stem cells.
    Hormoz S, Sankaran VG, Mullally A. Hormoz S, et al. Haematologica. 2025 Apr 1;110(4):840-849. doi: 10.3324/haematol.2023.283951. Epub 2024 Dec 5. Haematologica. 2025. PMID: 39633553 Free PMC article. Review.

References

WORKS CITED MAIN TEXT

    1. Steensma DP et al. Clonal hematopoiesis of indeterminate potential and its distinction from myelodysplastic syndromes. Blood 126, 9–16 (2015). - PMC - PubMed
    1. Jaiswal S. et al. Age-Related Clonal Hematopoiesis Associated with Adverse Outcomes A BS TR AC T. NEJM.org. N Engl J Med 26, 2488–98 (2014). - PMC - PubMed
    1. Genovese G. et al. Clonal Hematopoiesis and Blood-Cancer Risk Inferred from Blood DNA Sequence. New England Journal of Medicine 371, 2477–2487 (2014). - PMC - PubMed
    1. Xie M. et al. Age-related mutations associated with clonal hematopoietic expansion and malignancies. Nature Medicine 20, 1472–1478 (2014). - PMC - PubMed
    1. Abelson S. et al. Prediction of acute myeloid leukaemia risk in healthy individuals. Nature 559, 400–404 (2018). - PMC - PubMed

WORKS CITED METHODS

    1. Regier AA et al. Functional equivalence of genome sequencing analysis pipelines enables harmonized variant calling across human genetics projects. Nature Communications 9, 1–8 (2018). - PMC - PubMed
    1. Jun G, Wing MK, Abecasis GR & Kang HM An efficient and scalable analysis framework for variant extraction and refinement from population scale DNA sequence data. Genome Res. gr.176552.114 (2015) doi:10.1101/gr.176552.114. - DOI - PMC - PubMed
    1. Cingolani P. et al. A program for annotating and predicting the effects of single nucleotide polymorphisms, SnpEff: SNPs in the genome of Drosophila melanogaster strain w1118; iso-2; iso-3. Fly 6, 80–92 (2012). - PMC - PubMed
    1. Voss K, Gentry J & Van der Auwera G Full-stack genomics pipelining with GATK4 + WDL + Cromwell. in (F1000 Research, 2017). doi:10.7490/f1000research.1114631.1. - DOI
    1. Beauchamp EM et al. ZBTB33 Is Mutated in Clonal Hematopoiesis and Myelodysplastic Syndromes and Impacts RNA Splicing. Blood Cancer Discov (2021) doi:10.1158/2643-3230.BCD-20-0224. - DOI - PMC - PubMed

Publication types