. 2023 Apr;616(7957):495-503.
doi: 10.1038/s41586-023-05868-1. Epub 2023 Apr 12.

The little skate genome and the evolutionary emergence of wing-like fins

Affiliations

The little skate genome and the evolutionary emergence of wing-like fins

Ferdinand Marlétaz et al. Nature. 2023 Apr.

Abstract

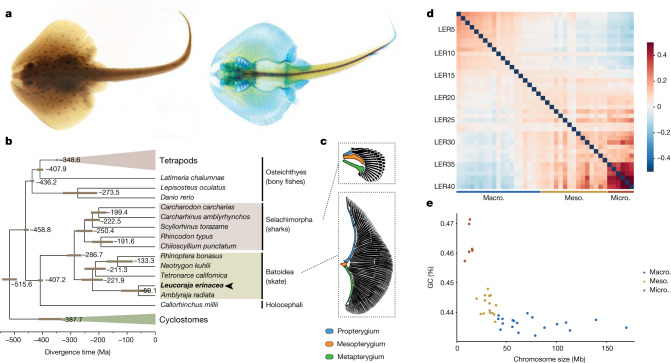
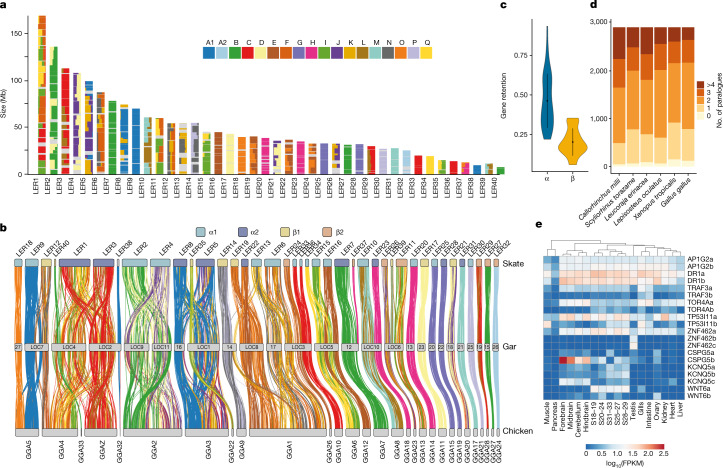
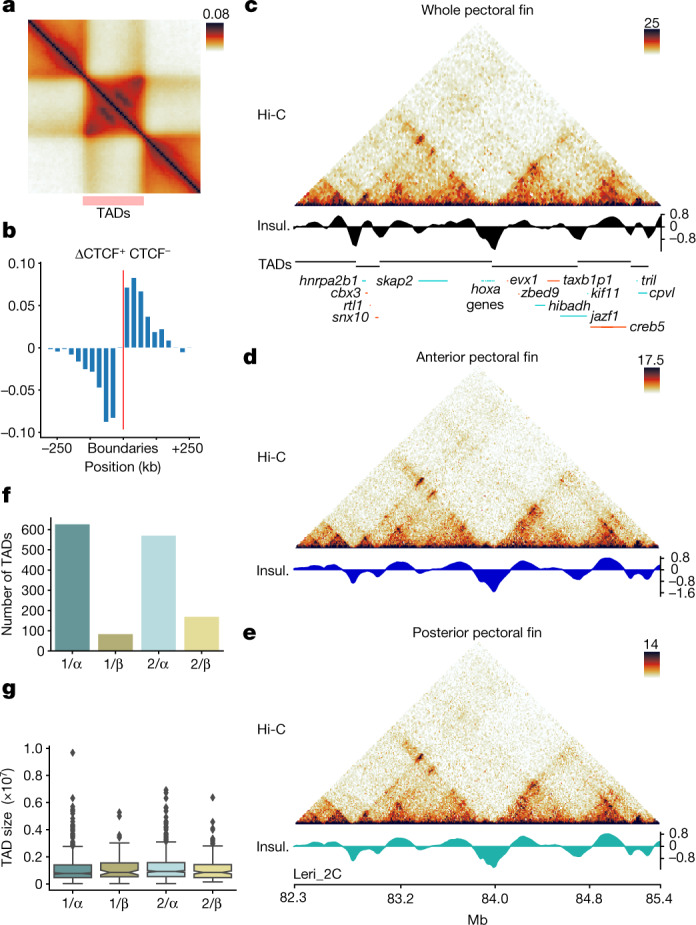
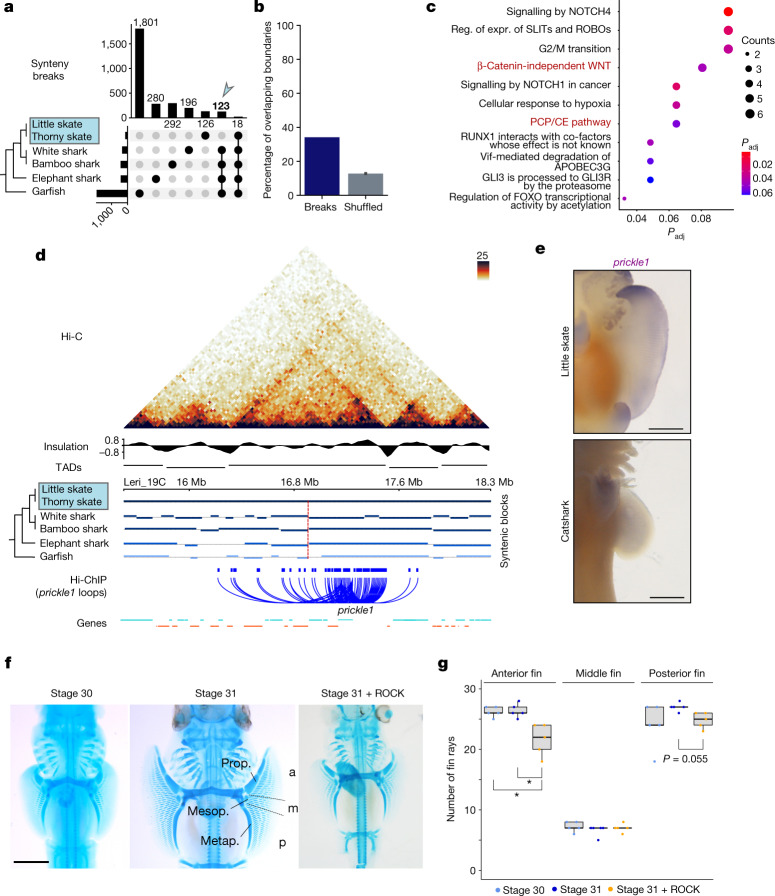
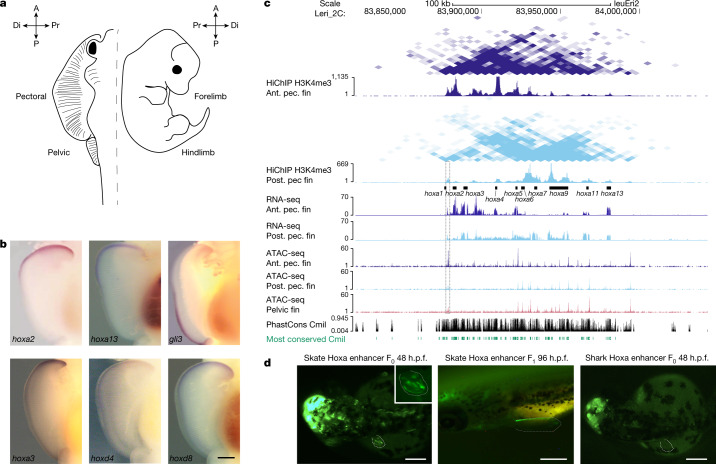
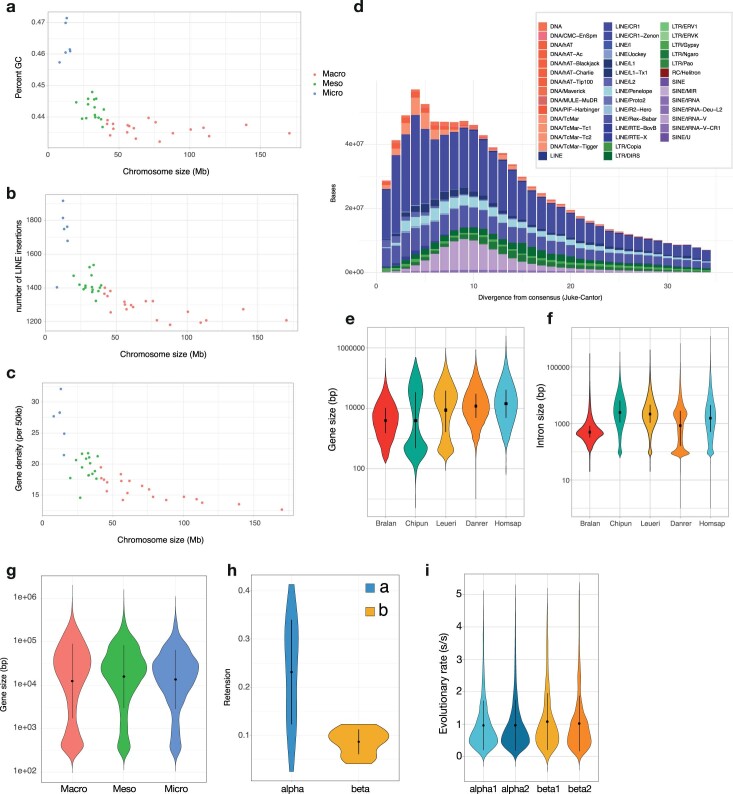
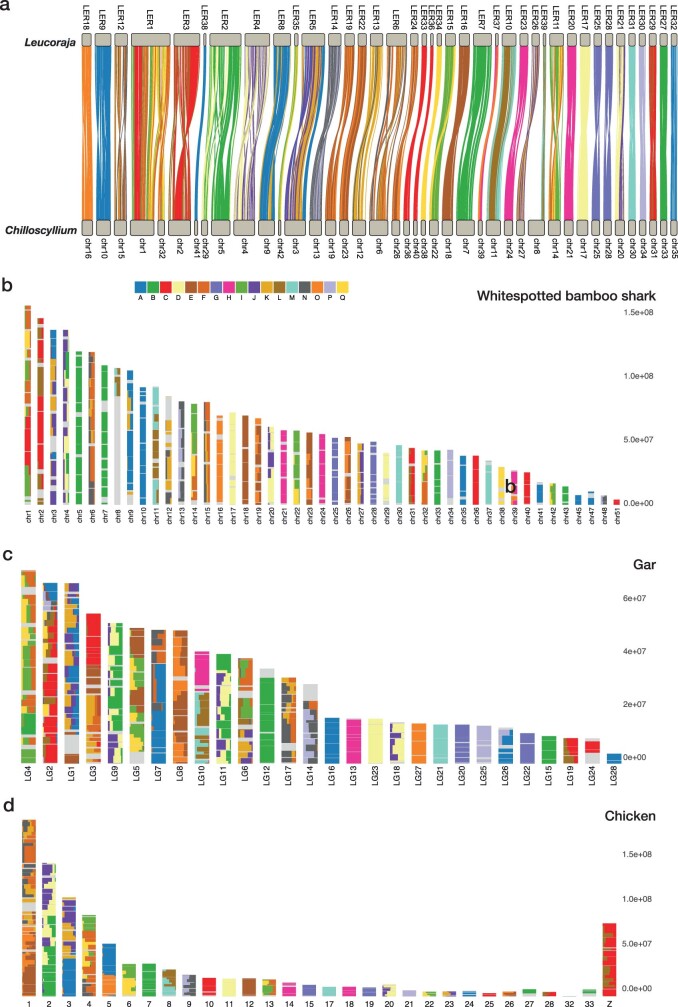
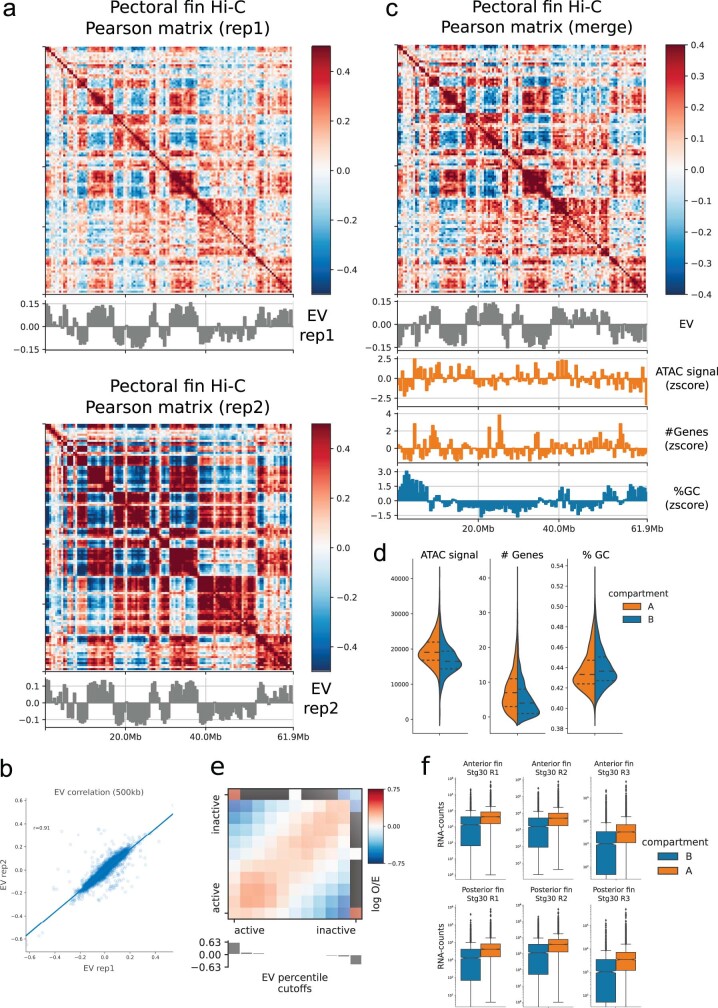
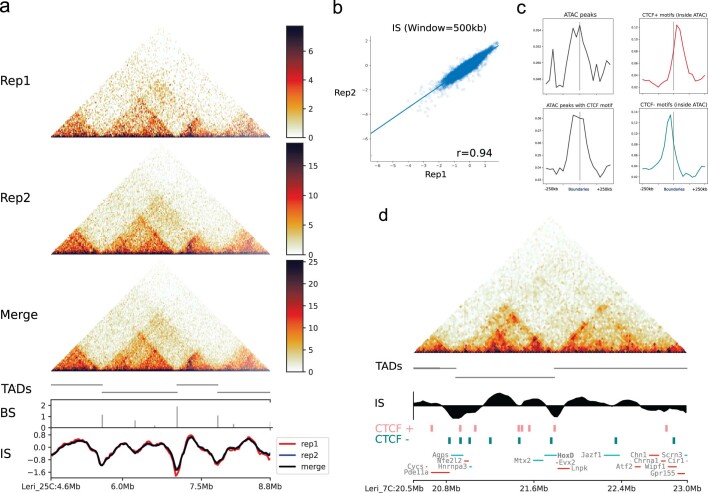
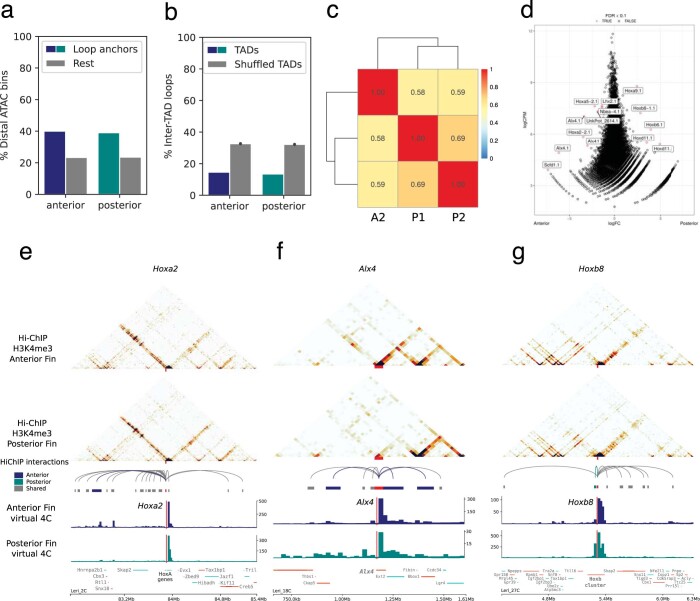
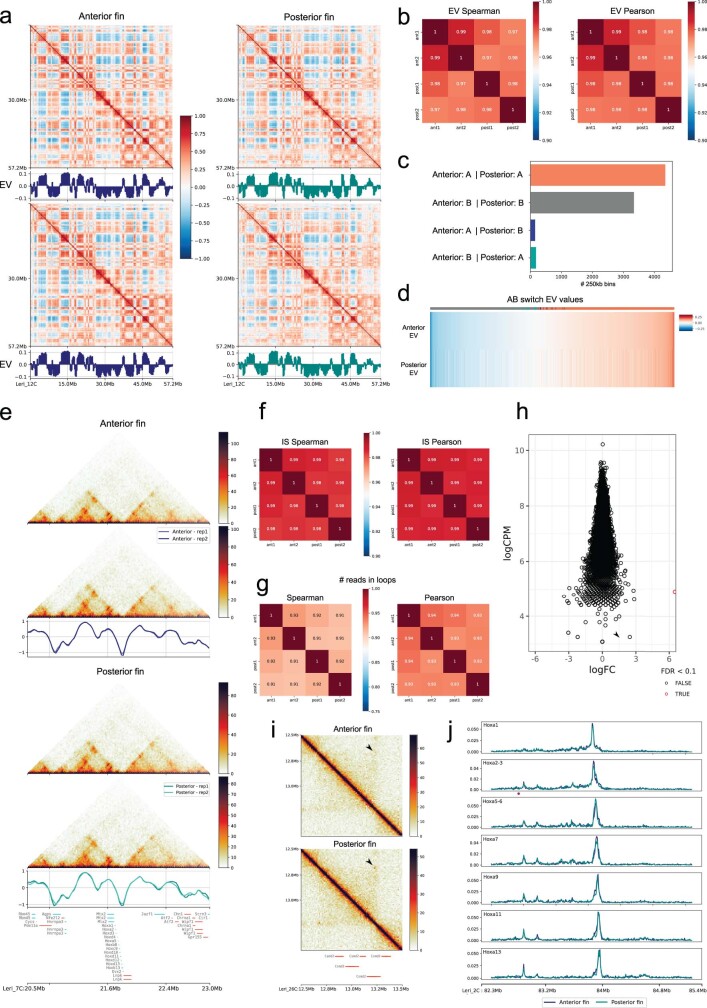
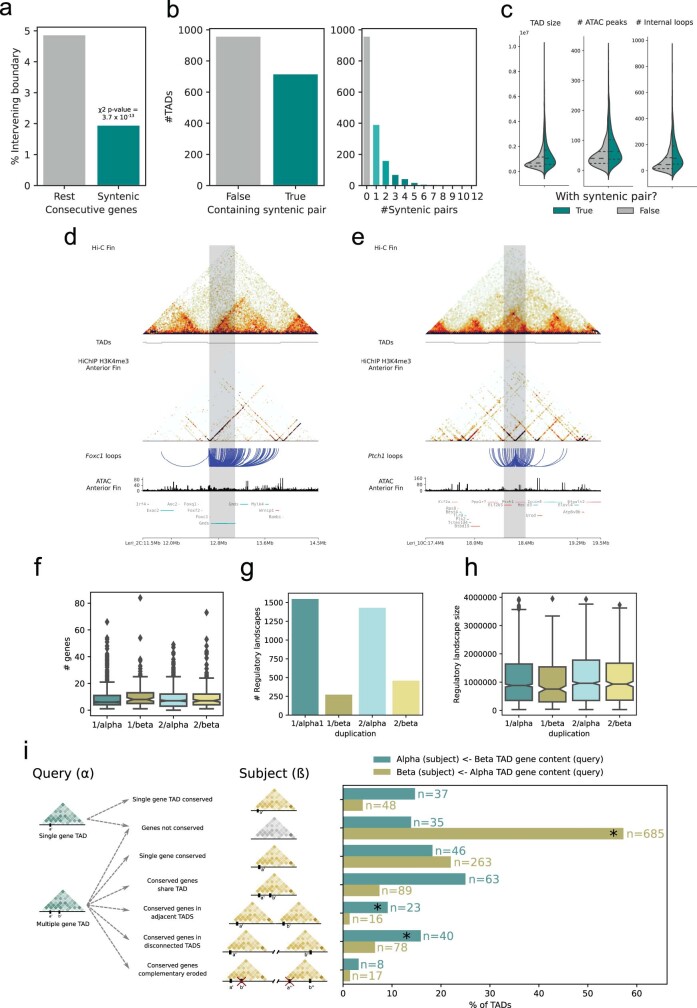
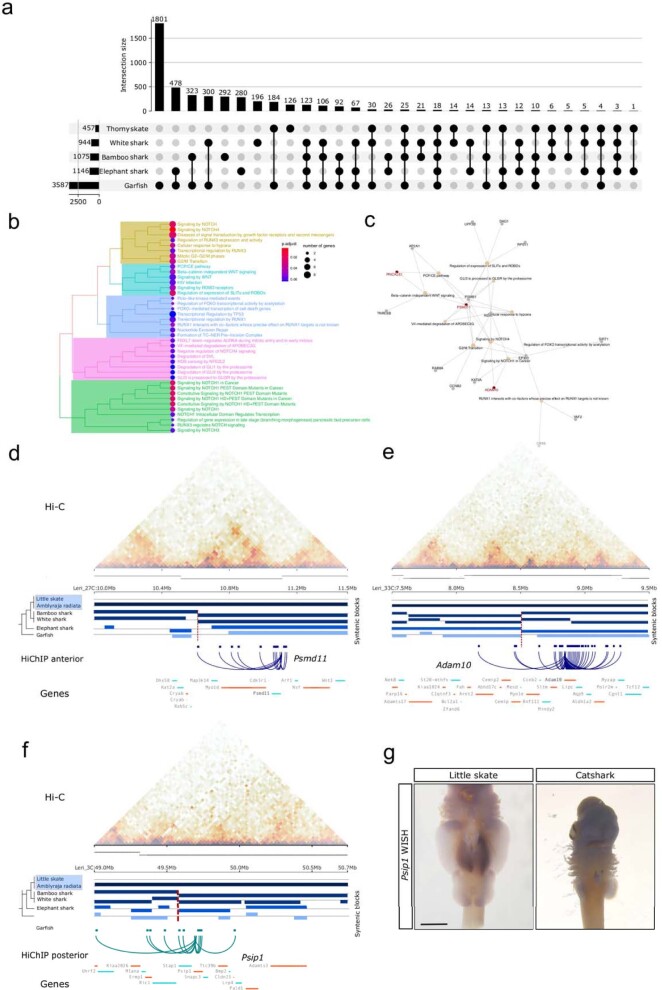
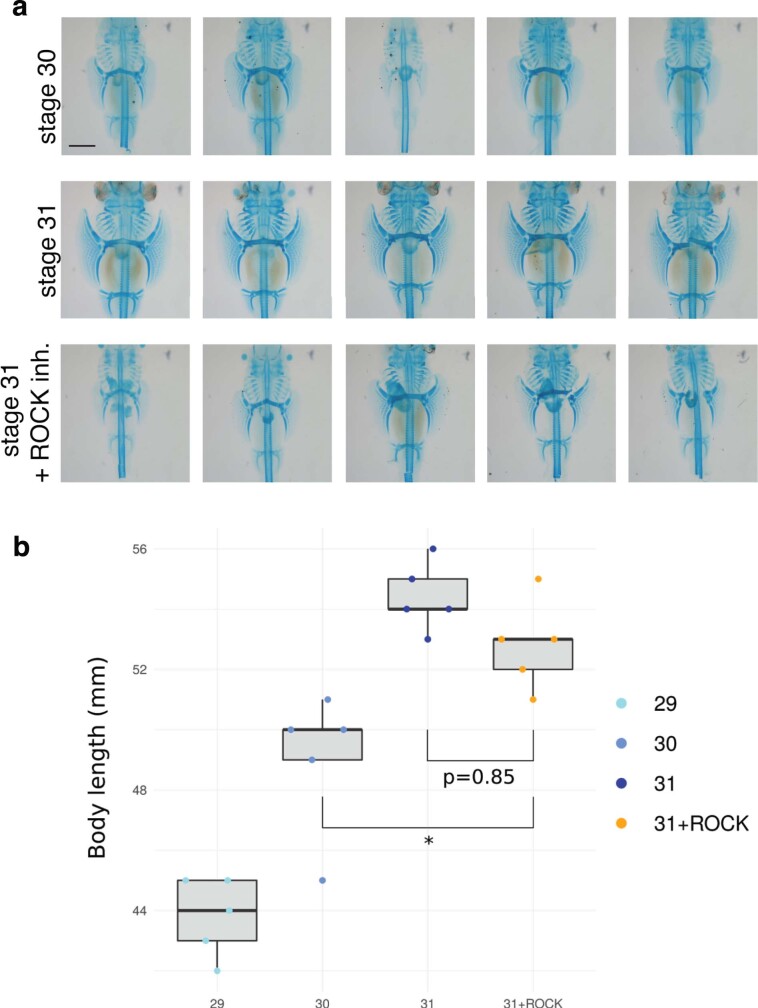
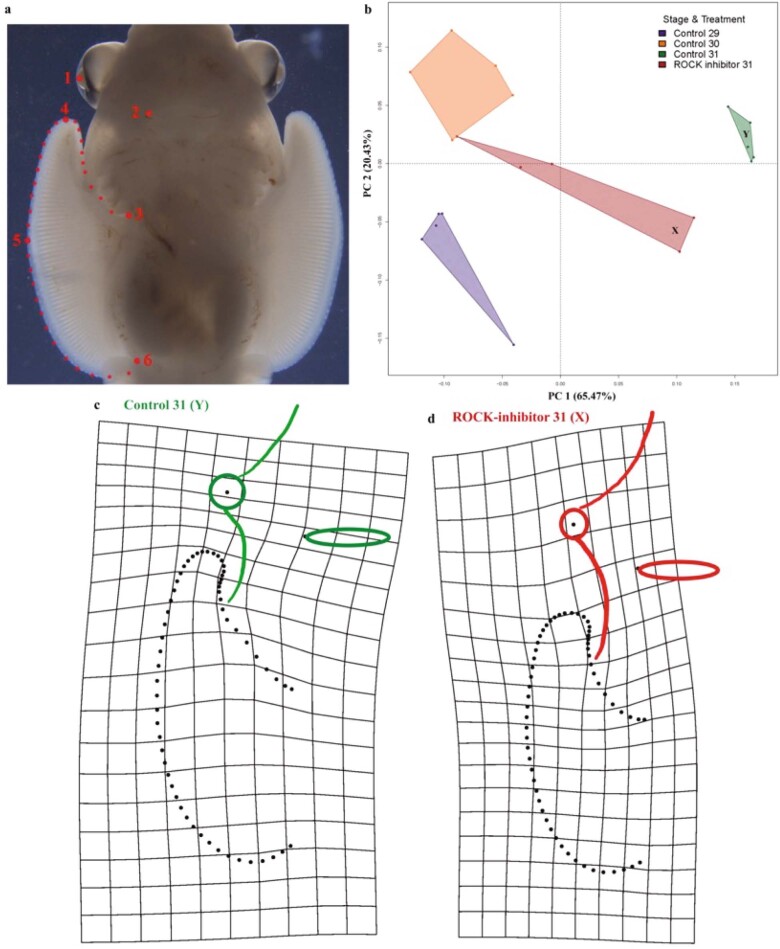
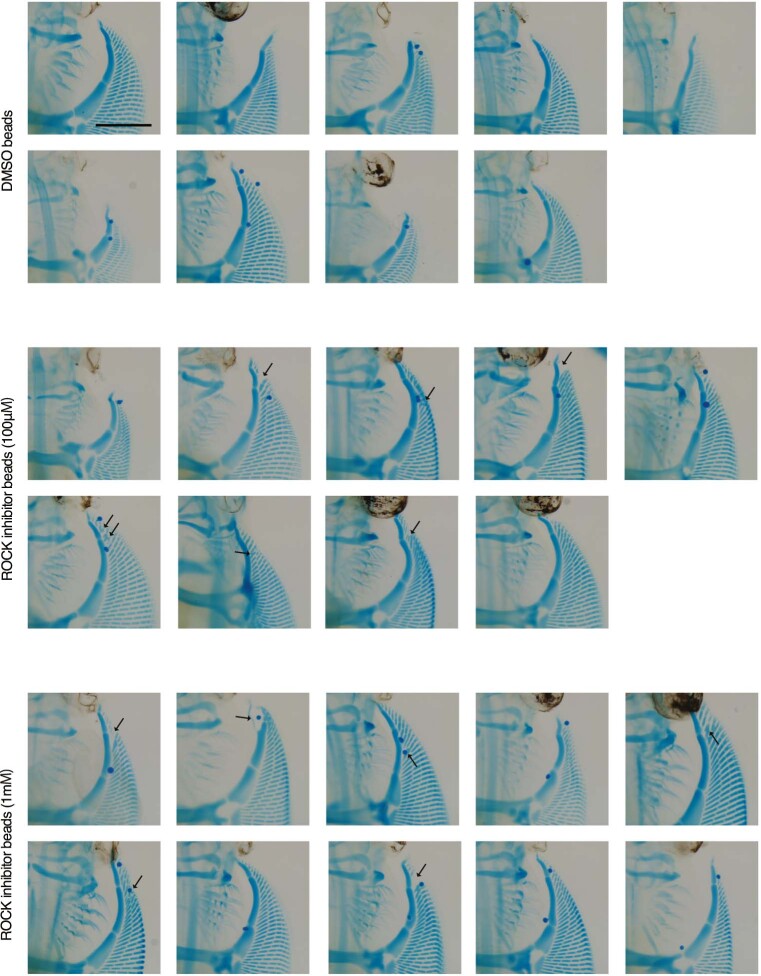
Skates are cartilaginous fish whose body plan features enlarged wing-like pectoral fins, enabling them to thrive in benthic environments1,2. However, the molecular underpinnings of this unique trait remain unclear. Here we investigate the origin of this phenotypic innovation by developing the little skate Leucoraja erinacea as a genomically enabled model. Analysis of a high-quality chromosome-scale genome sequence for the little skate shows that it preserves many ancestral jawed vertebrate features compared with other sequenced genomes, including numerous ancient microchromosomes. Combining genome comparisons with extensive regulatory datasets in developing fins-including gene expression, chromatin occupancy and three-dimensional conformation-we find skate-specific genomic rearrangements that alter the three-dimensional regulatory landscape of genes that are involved in the planar cell polarity pathway. Functional inhibition of planar cell polarity signalling resulted in a reduction in anterior fin size, confirming that this pathway is a major contributor to batoid fin morphology. We also identified a fin-specific enhancer that interacts with several hoxa genes, consistent with the redeployment of hox gene expression in anterior pectoral fins, and confirmed its potential to activate transcription in the anterior fin using zebrafish reporter assays. Our findings underscore the central role of genome reorganization and regulatory variation in the evolution of phenotypes, shedding light on the molecular origin of an enigmatic trait.


Conflict of interest statement

J.D. is on the scientific advisory board of Arima Genomics and of Omega Therapeutics. The other authors declare no competing interests.

Figures

Fig. 1
Fig. 1. The little skate morphology and genome evolution.
a, Adult little skate (L. erinacea) and skeletal staining using Alcian Blue and Alizarin Red. b, Chronogram showing the branching and divergence time of chondrichthyan and selected osteichthyan lineages (Supplementary Fig. 1). c, Morphological differences in the skeleton between the pectoral fins in shark and skate highlighting the expansion of a wing-like fin. The illustrations were reproduced from a previous publication. d, Pairwise Hi-C contact density between 40 skate chromosomes, showing an increased interchromosomal interaction between the smallest ones (microchromosomes). The colour scale shows log-transformed observed/expected interchromosomal Hi-C contacts. Macro., macrochromosome; meso., mesochromosome; micro., microchromosome. e, Little skate chromosome classification based on the relationship between their size and GC percentage, highlighting the high GC content of microchromosomes.
Fig. 2
Fig. 2. Ancestral linkage and the architecture of early vertebrate genomes.
a, The fraction of genes derived from each CLG (depicted as squares named A1–Q) in skate chromosomes represented for bins of 20 genes. b, The syntenic orthology relationship between skate, gar and chicken, relying on genes with a significant CLG assignment in regard to amphioxus. Skate chromosomes are coloured by segmental identity and links are coloured by CLG. c, Rates of gene retention for α or β segments derived from the second alloploid event of vertebrate WGD. d, Respective gene-family composition for ohnologues in selected jawed vertebrate species indicating differential paralogue loss. e, Gene expression for selected sets of differentially lost ohnologues for which a copy was lost in the gnathostome but not in the chondrichthyan lineage. FPKM, fragments per kilobase of transcript per million mapped reads; S, stage.
Fig. 3
Fig. 3. Features of 3D chromatin organization in the little skate.
a, TAD metaplot displaying focal interactions at the apex of domains. b, Orientation bias of CTCF-binding site motifs inside ATAC–seq peaks at TAD boundary regions. c, Hi-C maps from whole pectoral fins of the skate hoxa locus at 25 kb resolution, denoting the presence of bipartite TAD configuration. Insul., insulation score. d,e, Hi-C maps from the same locus of c from dissected anterior (d) and posterior (e) portions of skate pectoral fins at 10 kb resolution. No changes in TADs or looping patterns were observed. f, The number of TADs detected associated to the different paralogous segments descending from the two rounds of WGD (1 or 2 for the 1R; α or β for the 2R) g, TAD sizes observed in the different paralogous segments from f. The box plots show the median (centre line) and the first and third quartiles (Q1 and Q3; box limits), and the whiskers extend to the last point within 1.5× the interquartile range below and above Q1 and Q3, respectively. The rest of the observations, including the maximum and minimum values, are shown as outliers. n = 626 (1/α), n = 83 (1/β), n = 570 (2/α) and n = 169 (2/β) TADs.
Fig. 4
Fig. 4. Skate-specific genomic rearrangements and the PCP pathway.
a, Upset plot for quantification of synteny breaks in vertebrate species with the skate genome as a reference. The bar plot at the top shows quantification of synteny breaks for the species combination indicated by dots. The blue arrow highlights the 123 synteny breaks found in non-skate species, therefore probably derived in skates. The bar plot on the left shows the total quantification of synteny breaks for individual species. b, The percentage of synteny breaks at TAD boundaries (dark blue) and the expected percentage for shuffled boundaries (grey). c, Reactome signalling pathway analysis of genes contained in rearranged TADs. expr., expression; Padj, adjusted P; reg., regulation. d, Hi-C map from pectoral fins for the prickle1 locus. Synteny blocks, insulation scores, TAD predictions and chromatin loops detected in H3K4me3 HiChIP datasets are indicated. e, WISH analysis of prickle1 in skates (L. erinacea, stage 30) and catshark (Scyliorhinus retifer, stage 30). Note that anterior expression is skate specific. n = 5 animals. Scale bars, 1 mm. f, Cartilage staining of embryos with or without ROCK inhibitor. Compared with the stage 30 and 31 controls, the number of fin rays decreased in embryos treated with ROCK inhibitor. Note the more severe reduction in fin rays in the anterior compared with in the posterior pectoral fin. Photographs of all replicates are provided in Extended Data Fig. 11 and Supplementary Fig. 10. Scale bar, 2 mm. The pectoral fin was divided into three domains from anterior to posterior (Methods). Prop., propterygium; mesop., mesopterygium; metap., metapterygium; a, anterior; m, middle; p, posterior. g, Quantification of the number of rays emerging from propterygium, mesopterygium and metapterygium in samples for the conditions shown in f. Individual data points are shown. The box plots show the median (centre line), Q1 and Q3 (box limits), and the whiskers extend to the last point within 1.5× the interquartile range below and above Q1 and Q3, respectively. P values were calculated using pairwise Wilcoxon rank-sum tests with correction for false-discovery rate (FDR); *P < 0.05; P = 0.018 in both significant comparisons in anterior fin.
Fig. 5
Fig. 5. Functional experiments in skate fin samples.
a, Outline of a skate and a mouse embryo and their homologous appendages, used in our comparative analyses. A, anterior; P, posterior. The distal (Di) and proximal (Pr) regions of the fin/limb are indicated. b, In situ hybridization reveals the opposite expression pattern of many hox genes and the gli3 gene in the pectoral fin. n = 8 animals for each gene. Scale bar, 1 mm. The images of hoxa2 and gli3 were adapted from ref. . c, UCSC Genome Browser view showing HiChIP, RNA-seq and ATAC–seq data around the hoxa cluster in skate. The anterior-specific open chromatin region between the hoxa1 and hoxa2 genes is marked with a dotted rectangle (see ‘A skate-specific hoxa fin enhancer’ section). Green denotes the most conserved regions with the elephant shark (Callorhinchus milii; Cmil) genome. Ant. pec. fin, anterior pectoral fin; post. pec. fin, posterior pectoral fin. d, GFP expression driven by the anterior-specific open chromatin region between the hoxa1 and hoxa2 genes from skate and shark in transgenic assays in zebrafish. The brain expression induced by the midbrain enhancer:egfp indicates a successful injection of the mini-Tol2 vector with the skate or shark hox enhancer as a positive control. Note that only the skate enhancer drives expression on the pectoral fin (5 eGFP-positive embryos at 48 h after fertilization (h.p.f.) out of 18 F0 embryos for the skate enhancer (left), in contrast to 0 out of 31 F0 embryos for the shark enhancer (right)). In F1 stable embryos, the GFP is driven to the pectoral fin with a clear anterior pattern at 96 h after fertilization (middle). Scale bars, 250 µm.
Extended Data Fig. 1
Extended Data Fig. 1. Characteristics of skate chromosomes, repeat content and skate genome.
a–c, Characteristics and classification of skate chromosomes according to their size (x-axis) and GC% (a), number of LINE insertions (b) and gene density (c) per 50kb window. d, Repetitive landscape computed as JC divergence of repeat occurrence toward the consensus element in the repeat library. e–f, Distribution of gene and intron size in selected chordate species: amphioxus (Branchiostoma floridae, Bralan), the cloudy catshark (Chiloscyllium punctatum, Chipun), the little skate (Leuraja erinacea, Leueri), the zebrafish (Danio rerio, Danrer) and human (Homo sapiens, Homsap). g, gene size distribution in three chromosomal categories. h, distribution of retention rates inferred for CLGs in the spotted gar (Lepisosteus oculatus). e–h, mean dot) and standard deviation (bar) are indicated with the violin plot area. i. Rates of evolution of genes located in α or β segments estimated as ML distance to the amphioxus outgroup (LG+Γ).
Extended Data Fig. 2
Extended Data Fig. 2. Chromosomal architecture and synteny conservation in cartilaginous and bony fishes.
a, Syntenic orthology relationship between skate and bamboo shark highlighting the conservation of chromosomal architecture among chondrichtyans. b–d, Organisation of segments derived from each CLG in bamboo shark, gar and chicken genome using the same colour code as in Fig. 1. Each bin along chromosomes represents 20 genes.
Extended Data Fig. 3
Extended Data Fig. 3. The skate genome is organized in A/B compartments.
a. 500 kb resolution Pearson matrices of a representative chromosome (Leri_11C) and their associated eigenvectors showing marked compartmentalization in A/B compartments in both replicates. b. Eigenvector correlation among the two replicates. c. Merged Pearson matrix presented together with its eigenvector, the normalized signal for ATAC-seq in anterior pectoral fin, the number of gene models and the percentage of GC content. As shown in d, the A compartment in skates correlates with chromatin accessibility and the number of gene models, but no clear correlation was observed with the GC content. e. Saddle plot demonstrating the aggregated enrichment of homotypic A-A and B-B interactions. f. Gene expression in either the A or the B compartment as measured with bulk RNA-seq performed in the anterior and posterior portions of the skate pectoral fin at Stg 30. Top: anterior, bottom: posterior, n = 4046 bins of 500kb (A compartment n = 2125, B compartment n = 1921). Boxes correspond to the median and the first and third quartiles (Q1 and Q3). Whiskers extend to the last point within 1.5 times the interquartile range below and above Q1 and Q3, respectively.
Extended Data Fig. 4
Extended Data Fig. 4. Skate chromosomes are organized in TADs flanked by convergent CTCF sites.
a. Hi-C interaction matrices in skate pectoral fins in either of the two replicates and the merge (25kb resolution). The TAD calling performed in the merged matrix and the associated boundary scores (BS) and insulation scores (IS) are shown below (window size of 500kb). b. Insulation score correlations between the two replicates. c. From top to bottom, enrichment around TAD boundaries (+-250kb) of ATAC-seq peaks and ATAC-seq peaks containing the CTCF motif regardless of the strand, in the plus and in the minus strand. d. Hi-C matrix around the HoxD locus showing the conserved bipartite configuration in two TADs with HoxD genes located precisely at the boundary. TADs, insulation scores and ATAC-seq peaks containing the CTCF motif are shown. The tendency of having divergent CTCF sites at insulation minima is observable.
Extended Data Fig. 5
Extended Data Fig. 5. H3K4me3 HiChIP unveils the regulatory landscapes of active genes in the anterior and posterior portions of the skate pectoral fin.
a. Proportion of distal loop anchors that also correspond to distal ATAC-seq peaks in the pectoral fin in both the anterior and posterior H3K4me3 HiChIP datasets. b. Proportion of inter-TAD interactions calculated in the anterior and posterior HiChIP datasets compared to a random shuffling of the TADs (grey). c. Spearman correlation of the three valid replicates (1 for anterior and 2 for posterior fins). The correlation between the matrices is limited to the non-redundant set of interactions (union = 50,601 interactions). d. Differential loop analysis derived from read counts in c. logFC vs. logCPM plot with significant differential loops highlighted in red. e,f. Anterior specific contacts in the Hoxa2 and Alx4 regulatory landscape (dark blue). g. Posterior specific contacts in the Hoxb8 regulatory landscape (turquoise).
Extended Data Fig. 6
Extended Data Fig. 6. Preformed 3D chromatin folding in anterior vs. posterior fin.
a. Pearson matrices and eigenvectors showing A/B compartmentalization of the chromosome Leri_12C of skates in the anterior and posterior portions of the pectoral fin. b. Genome-wide eigenvector correlations. c. Quantification of A/B compartment switches between anterior and posterior portions of the fin. d. Comparison of all EV values between anterior and posterior fin. Heatmaps are sorted according to anterior EV values and compartment switches are indicated in the colour bar on top. Most switches are concentrated towards the centre, where EV values are intermediate. e. Comparison of insulation scores and overall TAD structures around the HoxD locus. f. Genome wide insulation score correlations. g. Correlations of number of reads found inside a consensus set of loops consisting of the union of the loops (see Methods) h. Differential loop analysis derived from read counts in g. logFC vs. logCPM plot with the only significant differential loop highlighted in red. i. Snapshot of the Hi-C heatmap around the only significant differential loop located in the Csmd2 locus. Arrowheads indicate the position of the loop. j. Virtual 4C-seq profiles of Hoxa cluster genes derived from the Hi-C experiments. Few differences are appreciated, and no differences are evident in contacts between Hoxa2 and the differential loop predicted by HiChIP (purple asterisk).
Extended Data Fig. 7
Extended Data Fig. 7. Conservation of vertebrate TADs after the Whole Genome Duplications.
a. Intergenic spaces between microsyntenic pairs conserved across vertebrates (present in skate and osteichthyes, here mouse and garfish) are devoid of TAD boundaries. Syntenic gene pairs n = 3017, non-syntenic n = 25386. Two-sided χ2 p-value = 3.7 x 10⁻¹³ b. 40% of skate TADs contain a deeply conserved microsyntenic pair. Several of them contain more than one association. c. TADs containing deeply microsyntenic associations are bigger, contain more ATAC-seq peaks and more loops as defined using HiChIP (Syntenic TAD n = 718, non-syntenic TAD n = 960). Foxc1/Gmds (d) and Ptch1/Eif2b3 (e) are examples of deeply conserved microsyntenic associations. Microsyntenic area is shaded in grey. Hi-C, TADs, HiChIP and ATAC-seq data are shown along with the gene tracks. f. Gene content of TADs associated to the different paralogous segments of the genome originated after the two rounds of WGD (1 or 2 for the 1R, alpha or beta for the 2R) Boxes correspond to the median and the first and third quartiles (Q1 and Q3). Whiskers extend to the last point within 1.5 times the interquartile range below and above Q1 and Q3, respectively. g. Number of regulatory landscapes (defined as the group of interactions anchored by a single gene promoter) belonging to the different paralogous segments of the genome originated after the two rounds of WGD (1 or 2 for the 1R, alpha or beta for the 2R). h. Regulatory landscape sizes observed in the paralogous segments of f defined as the genomic space spanning from the two more distal loop anchors anchored to a given promoter. Boxplots defined as in f. i. The fate of the counterparts of alpha TADs was investigated in the beta copy and vice versa. TADs with more than one gene conserved allowed us to infer scenarios of TAD fissions-fusions in either or the genome copies. Asterisks (*) highlight complete TAD losses in beta (yellow bar) and TAD fission events in alpha (blue bars).
Extended Data Fig. 8
Extended Data Fig. 8. Rearranged TADs in the skate lineage involve PCP-related genes.
a. Extended version of the upset plot presented in Fig. 4a with the quantification of synteny breaks detected in different vertebrate species using the skate genome as a reference. The barplot on top shows the quantification of synteny breaks for the species combination indicated by the dots below. The barplot on the left shows the total quantification of synteny breaks for each individual species. b. ReactomePA clustering of significant terms found in the set of candidate genes for regulatory rearrangements in the anterior pectoral fin. P-values are BH corrected p-values obtained with a one-sided Fisher test for term overrepresentation (ReactomePA default). A selection of these terms is shown in Fig. 4c. c. Cnetplot showing the relationship of candidate genes with each of the different enriched terms. d. Candidate rearrangement at the Psmd11 locus, implicated in the PCP pathway. Pectoral fin Hi-C map is shown on top together with the TAD predictions. Below, the synteny blocks that are shared with the different species studied and the candidate synteny break is highlighted in red. Finally, arachnogram with the contacts devised from the anterior fin H3K4me3 HiChIP experiment. e. Same as in d, but for the Notch-signalling related gene Adam10. f. Same as in d and e but for the Hox activator Psip1. Note that this time the presented H3K4me3 HiChIP is from posterior pectoral fins. g. Whole mount in situ hybridization against Psip1 in both the little skate L. erinacea and the catshark S. retifer shows species-specific expression of Psip1 in the anterior portion of the skate pectoral fins. n = 5 for skates and sharks. The scale bar corresponds to 2 mm.
Extended Data Fig. 9
Extended Data Fig. 9. Fin ray development in control and ROCK inhibitor-treated skate embryos.
a. Cartilages in control (stages 30 and 31) and ROCK inhibitor-treated embryos (stage 31) were examined by Alcian blue staining. Five replicates for each condition are shown. The whole-mount staining showed that anterior fin ray development is affected by ROCK inhibitor-treatment with some variations. The number of fin rays attached to propterygium (pro), mesopterygium (meso), and metapterygium (meta) was counted under a stereomicroscope and statistically analysed (Fig. 4). The scale bar is 2 mm. b. The total body length of control and ROCK-treated skate embryos. The total body length of control (stages from 29 to 31) and ROCK inhibitor-treated embryos (stage 31). Note that the body length of ROCK inhibitor-treated embryos is longer than stage 30 embryos (* = Bonferroni corrected two-sided t-test p-value = 0.01232), indicating that the embryos with the inhibitor normally developed, and the pectoral fin phenotype was not due to the overall defects of body development. Five replicates for each condition were examined and body length distributions were assumed to be normal. The minima, maxima, and median values of the box and whisker plots of stage 29, 30, 31, and ROCK inhibitor-treated embryos are 42, 45, and 44, 49, 51, and 50, 53, 56, and 54, 51, 55, and 53, respectively. Boxes correspond to the median and the first and third quartiles (Q1 and Q3). Whiskers extend to the last point within 1.5 times the interquartile range below and above Q1 and Q3, respectively.
Extended Data Fig. 10
Extended Data Fig. 10. Geometric morphometric analyses of the inhibition of the PCP pathway using a rho-kinase (ROCK) inhibitor in stage 31 skate embryos.
a. Schematic of the landmark design used in these analyses, including both landmarks (numbered red points) and semi-landmarks (small red points). b. Principal components analysis shows that specimen shapes cluster by treatment and stage. Points X and Y were used to generate the deformation grids showing the shape changes between the area of the PCA plot dominated by control (c) and ROCK-inhibited specimens (d). Note the inhibition of growth on the anterior region of the pectoral fin in the ROCK-inhibited specimens.
Extended Data Fig. 11
Extended Data Fig. 11. Cartilage staining of DMSO or the ROCK inhibitor-beads implanted skate embryos at stage 31.
The beads were repeatedly implanted into the anterior part of the right pectoral fin every two weeks (the total is three times) from stage 29. Some beads were retained until stage 31 (blue dots), while others fell during the treatment The embryos with the ROCK-inhibitor beads exhibited fusion, loss, or disorganized fin ray patterning (arrows, 6/9 for 100 μM and 6/10 for 1 mM). Note that abnormal fin ray patterning was never observed in control animals, indicating that the effects not directly associated with a bead in treated embryos were likely derived from the loss of the bead during the treatment. N = 9 for DMSO, 9 for 100 μM inhibitor, and 10 for 1 mM inhibitor beads. The scale bar is 2 mm.
Extended Data Fig. 12
Extended Data Fig. 12. Genetic interactions among Hox and Gli3 genes.
a. ChIP-seq experiment in mouse embryonic branchial arches performed in Amin et al. 2015, which shows the binding profile of HoxA2 to Gli3 genomic locus. b. Whole-mount in situ hybridization of gli3 in zebrafish embryos inyected with a hoxd13a-GR mRNA. Developing fins are indicated with red arrowheads. In the absence of dexamethasone (left panel), the construct is inactive and the embryos develop normally (50 out of 57, 88%). Upon treatment with dexamethasone (right panel), hoxd13a is activated and causes a reduction of gli3 expression at the developing fin region (mild reduction in 39 out of 93, 42%; strong reduction in 22 out of 93, 24%). Scale bars = 250 µm.

Comment in

References

    1. Nakamura T, et al. Molecular mechanisms underlying the exceptional adaptations of batoid fins. Proc. Natl Acad. Sci. USA. 2015;112:15940–15945. doi: 10.1073/pnas.1521818112. - DOI - PMC - PubMed
    1. Turner N, et al. The evolutionary origins and diversity of the neuromuscular system of paired appendages in batoids. Proc. Biol. Sci. 2019;286:20191571. - PMC - PubMed
    1. Shimeld SM, Holland PW. Vertebrate innovations. Proc. Natl Acad. Sci. USA. 2000;97:4449–4452. doi: 10.1073/pnas.97.9.4449. - DOI - PMC - PubMed
    1. Simakov O, et al. Deeply conserved synteny and the evolution of metazoan chromosomes. Sci. Adv. 2022;8:eabi5884. doi: 10.1126/sciadv.abi5884. - DOI - PMC - PubMed
    1. Touceda-Suárez, M. et al. Ancient genomic regulatory blocks are a source for regulatory gene deserts in vertebrates after whole genome duplications. Mol. Biol. Evol.10.1093/molbev/msaa123 (2020). - PMC - PubMed

Publication types

Substances